Rates of Reaction (SQA National 5 Chemistry): Revision Note
Exam code: X813 75

Monitoring chemical reactions
The rate of a chemical reaction is a measure of its speed
Some reactions are very slow, like rusting
Other reactions are extremely fast, like an explosion
To find the rate of a reaction, we track how much a quantity changes over a set amount of time
No matter which method you use, you are always measuring two things:
A change in quantity, for example:
Mass (usually in grams, g)
Volume (usually in cm3)
The time taken for that change (usually in seconds, s)
Methods for tracking a reaction
Here are three common ways to follow a reaction's progress in the lab
1. Measuring mass loss (when a gas escapes)
This is used when a reaction produces a gas that can leave the flask
Example reaction:
calcium carbonate + hydrochloric acid → calcium chloride + water + carbon dioxide
CaCO3 (s) + 2HCl (aq) → CaCl2 (aq) + H2O (l) + CO2 (g)
The reaction is performed in a flask on a digital balance.
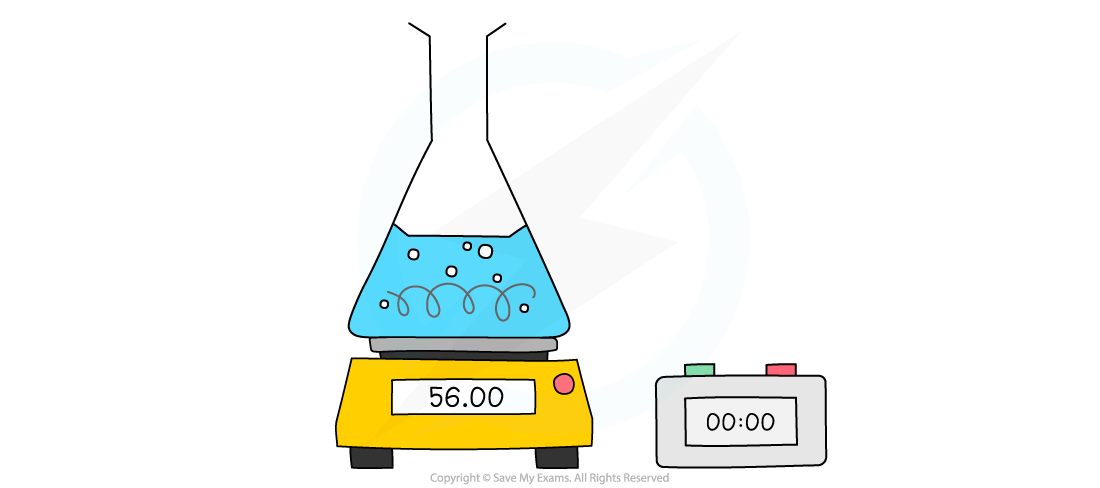
As the gas escapes, the mass on the balance goes down.
You record the mass at regular time intervals (e.g., every 30 seconds).
Examiner Tips and Tricks
A cotton wool plug is often placed in the top of the flask.
This lets the gas out but stops any acid from splashing out, which would affect your results.
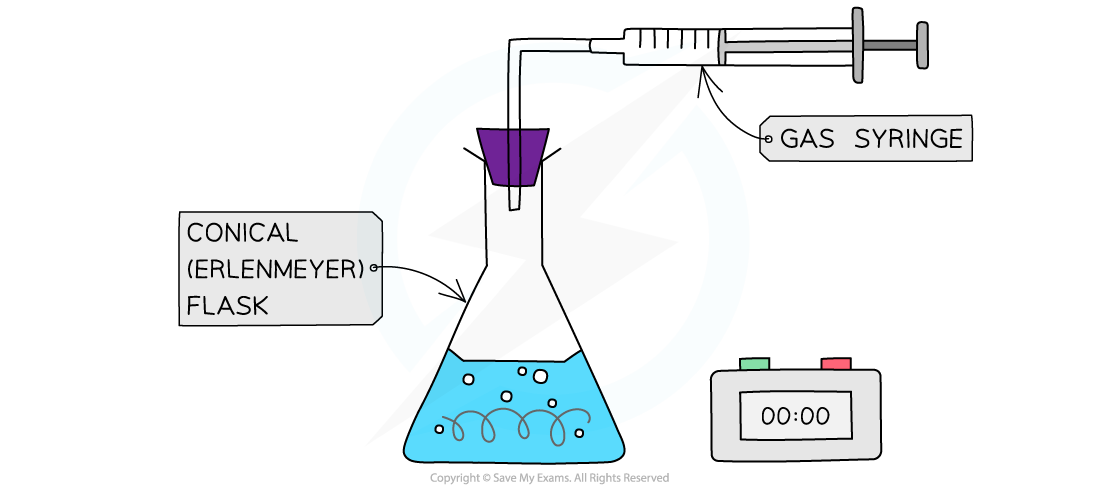
2. Collecting a gas
This is used for reactions that produce a gas
Example reaction:
magnesium + hydrochloric acid → magnesium chloride + hydrogen
Mg (s) + 2HCl (aq) → MgCl2 (aq) + H2 (g)
The reaction is performed in a flask with a delivery tube attached
The two most common ways to measure the volume of gas produced in the lab are:
Using a gas syringe
Collecting over water in an inverted measuring cylinder
For full diagrams and details on which method to use for which gas, see the Collecting gases revision note
3. Watching a precipitate form
This is used when two solutions react to form an insoluble solid, called a precipitate
The reaction is performed in a flask with a black cross underneath it
Example reaction:
sodium thiosulfate + hydrochloric acid → sodium chloride + sulfur dioxide + water + sulfur
Na2S2O3 (aq) + 2HCl (aq) → 2NaCl (aq) + SO2 (g) + H2O (l) + S (s)
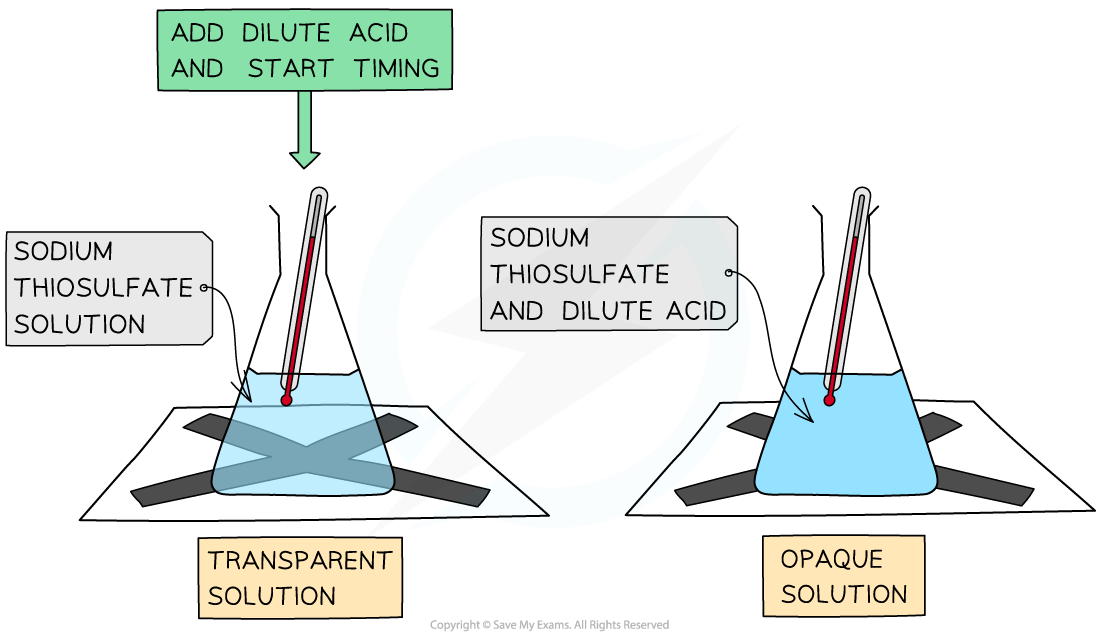
As the reaction proceeds, the black cross becomes less visible through the flask
You time how long it takes for the mixture to get cloudy enough to hide the black cross
This is often called the "disappearing cross" experiment
Examiner Tips and Tricks
Watch out for questions that switch between acids like H2SO4 and HCl
For the same concentration, a H2SO4 solution has twice as many H+ ions as an HCl solution
This means the reaction with HCl will be slower and may produce half the amount of gas
Also, you might be asked to pick a method for a certain reaction. It’s easy if you look for clues in the chemical equation:
If you see gaseous products (g) being formed, you can use mass loss or gas collection
If you start with two aqueous solutions (aq) and form a solid product (s), you can use the disappearing cross method
Rate of reaction graphs
When you collect data from a rates experiment, plotting it on a graph gives you a reaction-rate graph
This graph visually tells you the story of the reaction's speed over time
Understanding the shape of the curve
A typical reaction rate graph is a curve that starts steep and gradually flattens out, as shown:
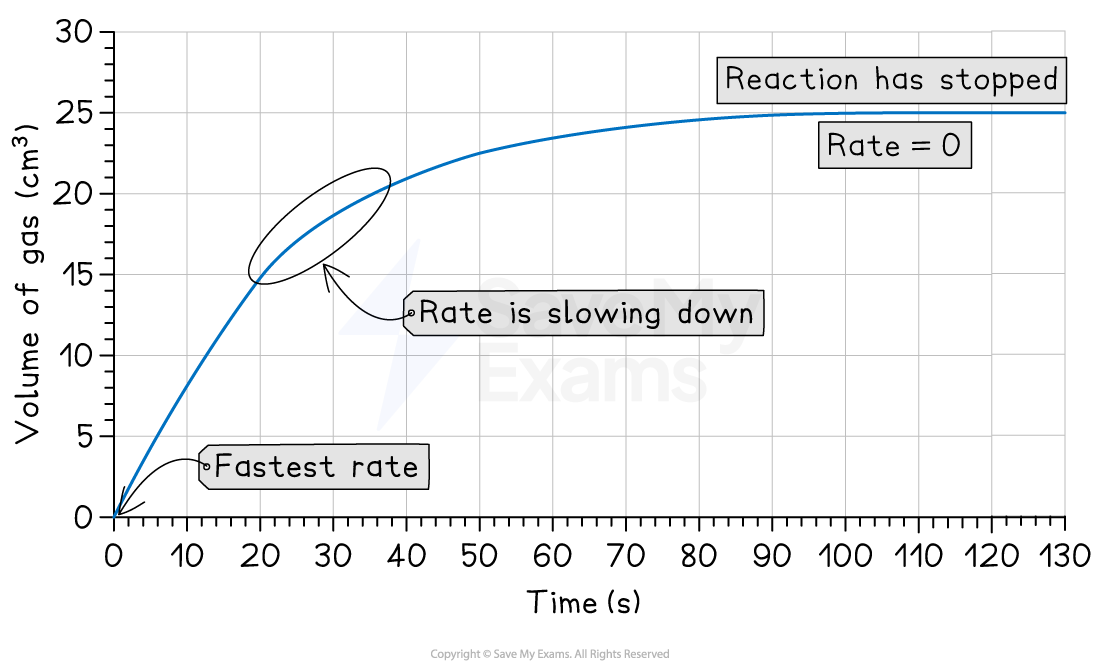
This graph shows three key stages of the reaction:
1. The start (steepest part)
The curve is steepest at the beginning
This shows the reaction is fastest when the reactants are first mixed.
2. The middle (curving part)
The curve becomes less steep as time goes on
This shows that the reaction is slowing down
This happens because the reactants are being used up
3. The end (flat part)
The curve becomes a horizontal line
This is the end-point of the reaction, where the rate is zero
At least one of the reactants has been completely used up
So, the reaction has stopped
How to read information from the graph
You can get three pieces of information from a rates graph:
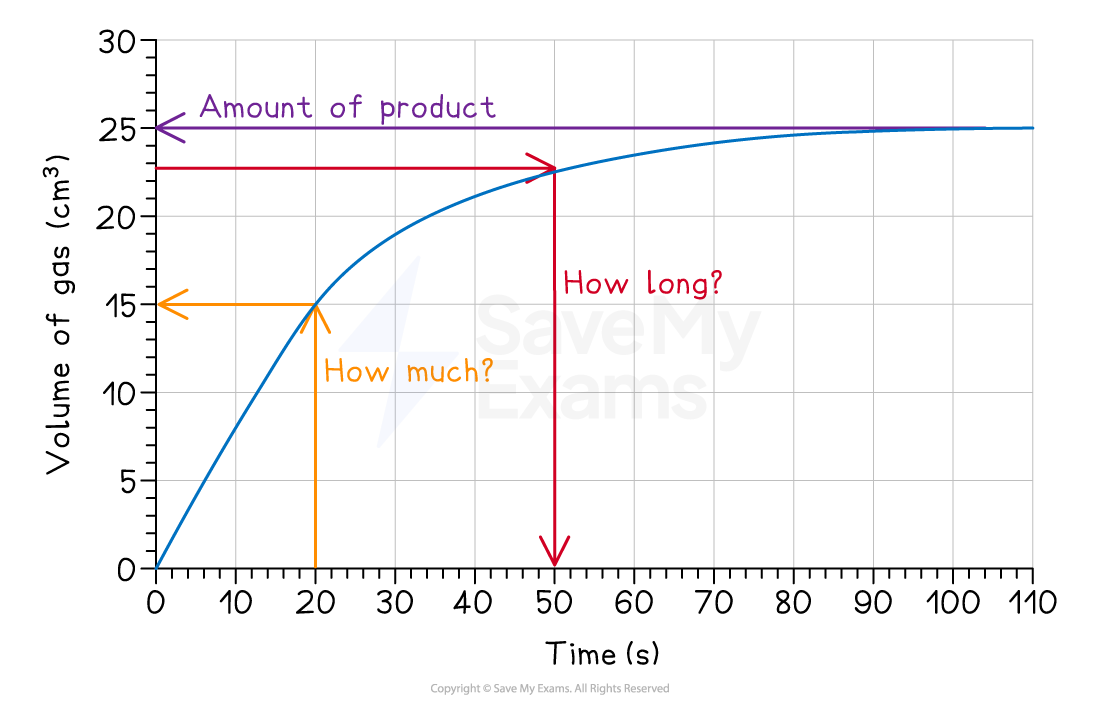
1. How much product is made?
Find the point where the graph goes flat
Draw a line across to the y-axis
Read the final volume
For example, the graph above shows that a total of 25 cm3 of gas is made
2. How long does it take to make a certain amount of product?
Find the required volume on the y-axis
Draw a line across to the curve
Then, draw a second line straight down to the x-axis
Read the time
For example, the graph above shows that it takes 50 seconds to produce 22.5 cm3 of gas
3. How much product is made in a certain time?
Find the time on the x-axis
Draw a line up to the curve
Then, draw a line across to the y-axis
Read the volume
For example, the graph above shows that 15cm3 of gas is produced in 20 seconds
Comparing graphs for different conditions
Exams often ask you to draw or identify a graph for a reaction where one condition has been changed
You always need to think about two things:
The speed of the reaction
The final amount of product
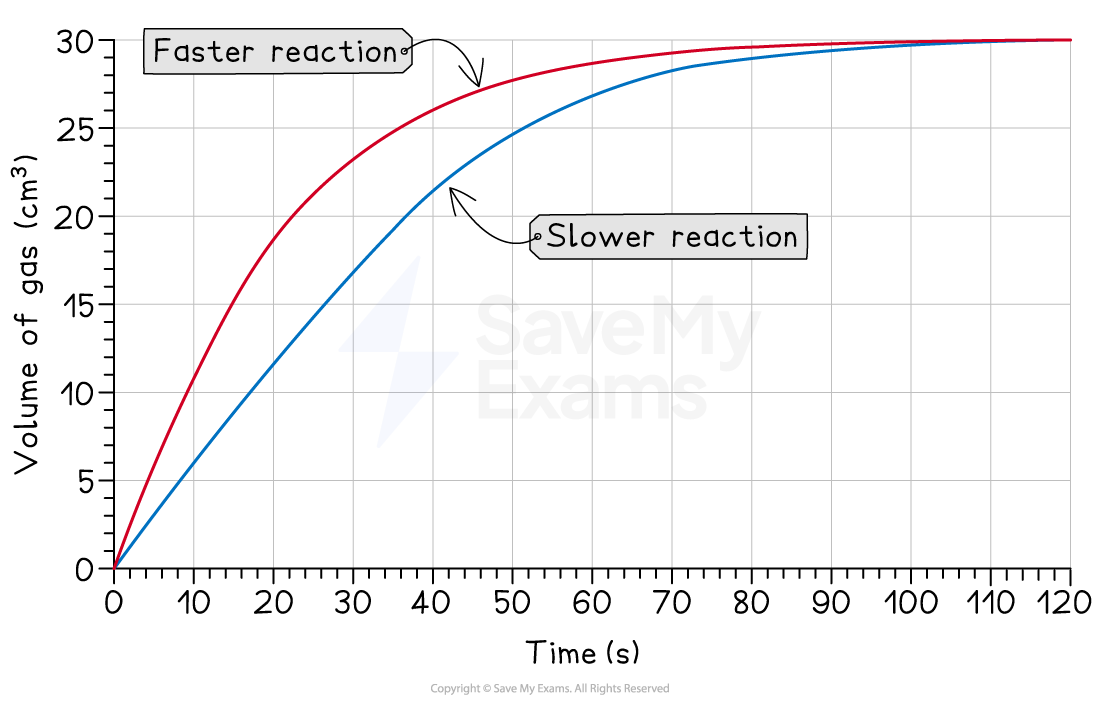
1. Changing the reaction speed
If you change a condition that only affects the rate, the reaction will:
Speed up or slow down
Make the same total amount of product
Changing temperature or adding a catalyst can have this effect
A faster reaction will have a steeper curve and finish sooner
A slower reaction will have a less steep curve and finish later
Examiner Tips and Tricks
When you are asked to draw a new curve for a reaction that is just faster or slower (e.g., different temperature), make sure your new curve flattens out at the exact same final volume/mass as the original curve
You only get less product if you use less reactant!
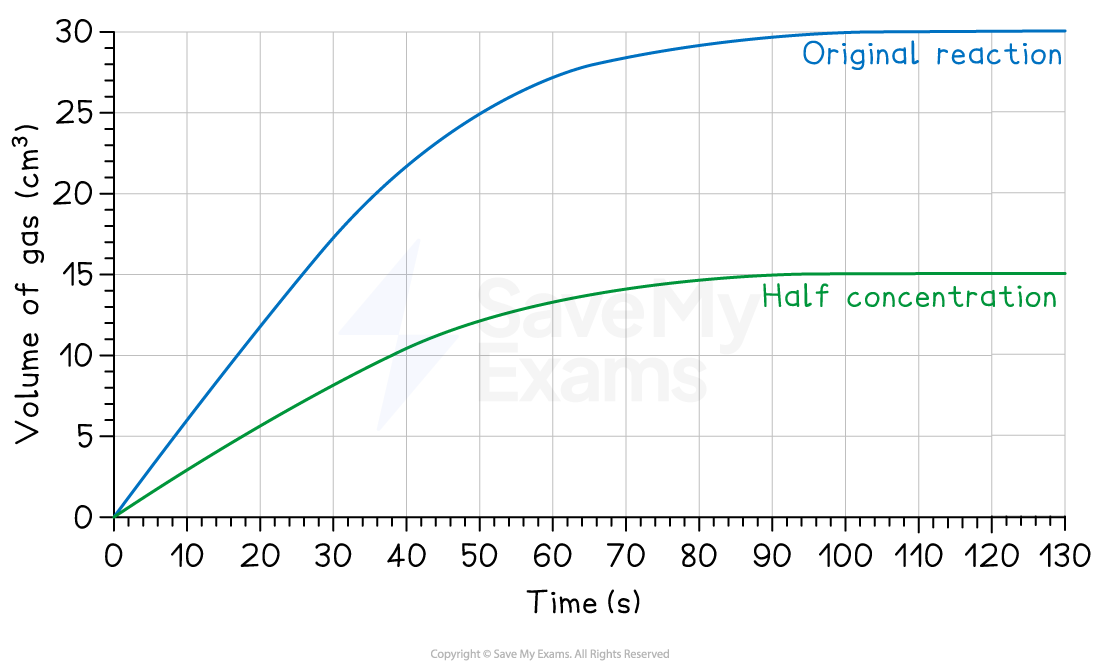
2. Changing the amount of product
If you change the amount of a starting reactant, you will change the total amount of product you can make
Reducing the concentration of one reactant can have this effect
Using less reactant will:
Make the reaction slower (a less steep curve)
Produce less product
For more information about why temperature, concentration and other factors affect the rate, see the Factors Affecting Rates of Reaction revision note
Examiner Tips and Tricks
When asked to draw or identify a new curve, always ask yourself two questions:
How will the RATE change? (Will the line be steeper or less steep?)
How will the final AMOUNT of product change? (Will the line finish at the same height or a different height?)

Unlock more, it's free!
Join the 100,000+ Students that ❤️ Save My Exams
the (exam) results speak for themselves:

Was this revision note helpful?
