Resistance & Illumination (Edexcel International A Level Physics)

Revision Note

Test Yourself
Joanna

Author

Joanna

Expertise

Physics

Modelling the Variation of Resistance with Illumination

  • Light can cause a change in conductivity of some semi-conductors
  • When light is absorbed by the material it causes more electrons to be available for conduction

3-20-free-electrons-in-an-ldr_edexcel-al-physics-rn

  • An increase in the number of conduction electrons reduces the resistance

Resistance & Illumination for LDRs

  • A light-dependent resistor (LDR) is a non-ohmic conductor and sensory resistor
  • Its resistance automatically changes depending on the light energy falling onto it (illumination)
  • As the light intensity increases, the resistance of an LDR decreases

LDR diagram, downloadable AS & A Level Physics revision notes

Resistance of an LDR depends on the light intensity falling on it

  • This is shown by the following graph:

LDR graph, downloadable AS & A Level Physics revision notes

Graph of light intensity and resistance for an LDR

  • LDRs can be used as light sensors, so, they are useful in circuits which automatically switch on lights when it gets dark, for example, street lighting and garden lights
    • In the dark, its resistance is very large (millions of ohms)
    • In bright light, its resistance is small (tens of ohms)

LDR Street Lights, downloadable IGCSE & GCSE Physics revision notes

LDRs are used for automatic street lights

Worked example

The graphs show various possible relationships between current and voltage through a component.

Which graph best represents the relationship between the current and voltage of an LDR?

Step 1: Consider the relationship between light intensity and resistance

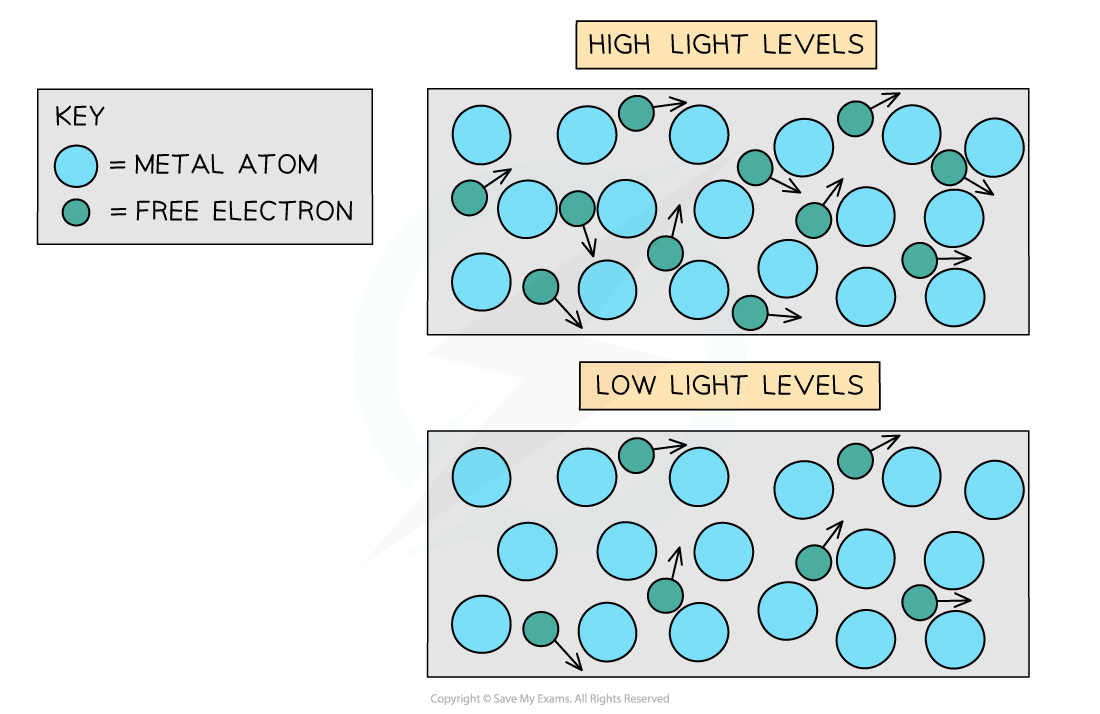
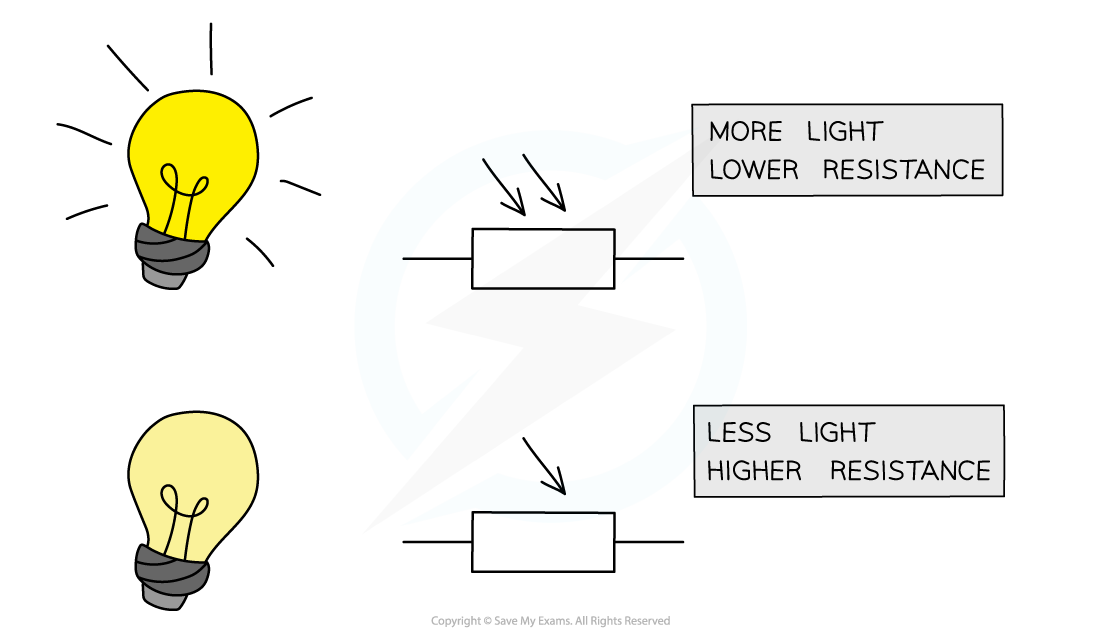
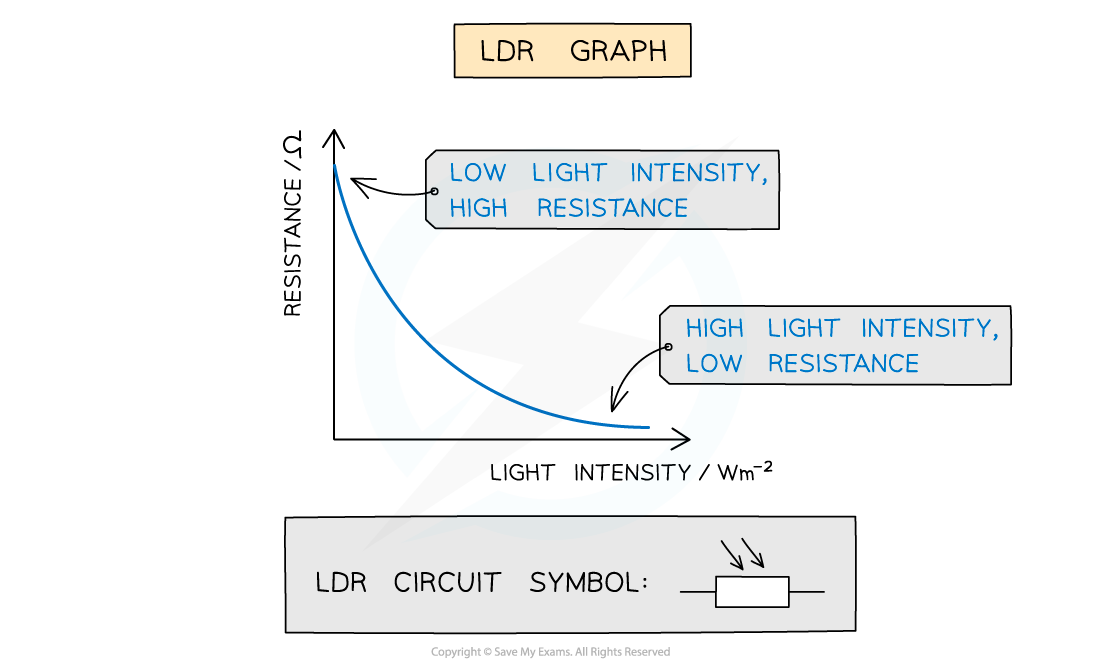
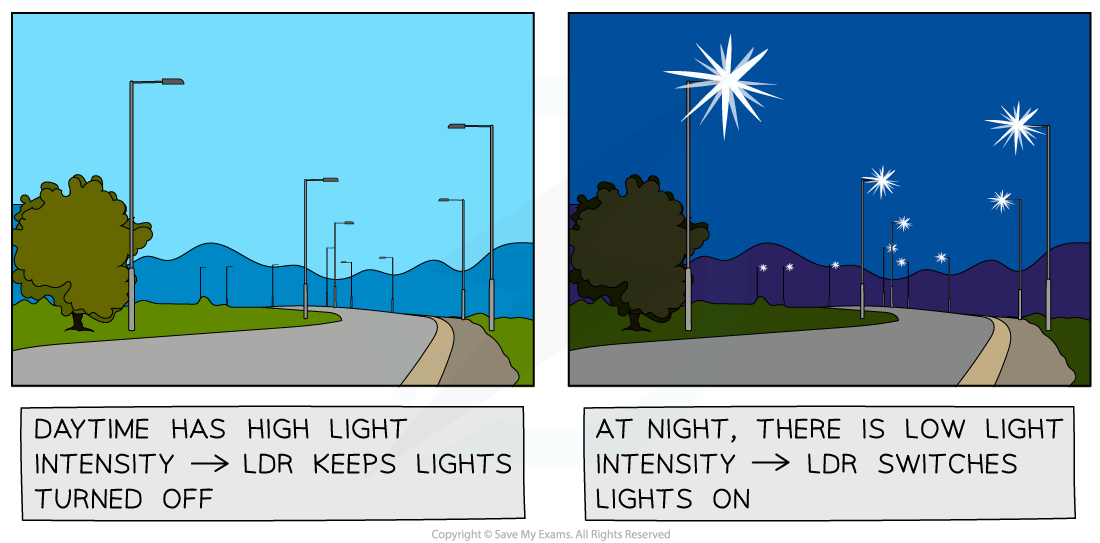
    • As light intensity increases, resistance decreases in an LDR
    • If the resistance decreases then the potential difference will increase

Step 2: Consider a relevant equation

    • Ohm’s law states that V = IR
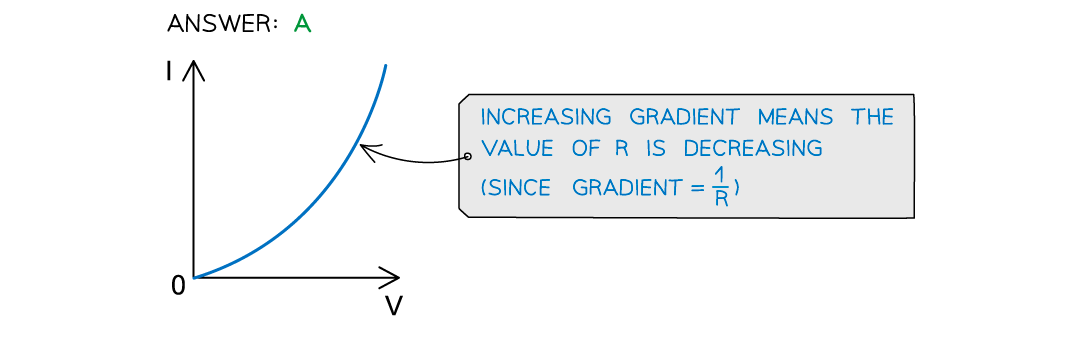
    • The resistance is equal to V/I or 1/R = I/V = gradient of the graph
      • Since R decreases, the value of 1/R increases, so the gradient must increase

Step 3: State the conclusion

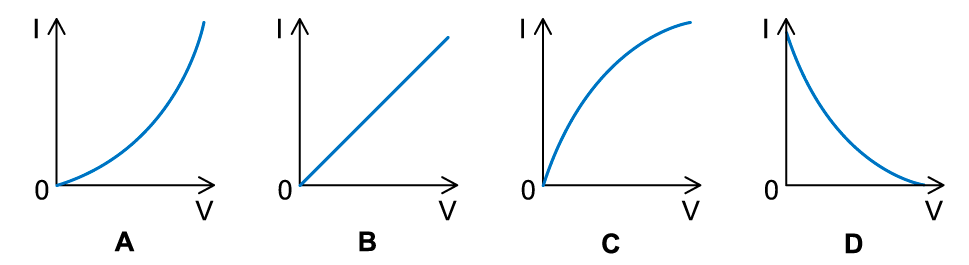
    • Therefore, I increases with changing V with an increasing gradient
    • This is seen in graph A

You've read 0 of your 0 free revision notes

Get unlimited access

to absolutely everything:

  • Downloadable PDFs
  • Unlimited Revision Notes
  • Topic Questions
  • Past Papers
  • Model Answers
  • Videos (Maths and Science)

Join the 100,000+ Students that ❤️ Save My Exams

the (exam) results speak for themselves:

Did this page help you?

Joanna

Author: Joanna

Joanna obtained her undergraduate degree in Natural Sciences from Cambridge University and completed her MSc in Education at Loughborough University. After a decade of teaching and leading the physics department in a high-performing academic school, Joanna now mentors new teachers and is currently studying part-time for her PhD at Leicester University. Her passions are helping students and learning about cool physics, so creating brilliant resources to help with exam preparation is her dream job!

Join over 500 thousand students
getting better grades