
Electric Potential Energy
- Electric field strength, E and the electric potential, V can be graphically represented against the distance from the centre of a charge, r
- E, V and r are related by the equation:
format('truetype')%3Bfont-weight%3Anormal%3Bfont-style%3Anormal%3B%7D%3C%2Fstyle%3E%3C%2Fdefs%3E%3Ctext%20font-family%3D%22Times%20New%20Roman%22%20font-size%3D%2218%22%20font-style%3D%22italic%22%20text-anchor%3D%22middle%22%20x%3D%225.5%22%20y%3D%2230%22%3EE%3C%2Ftext%3E%3Ctext%20font-family%3D%22math17f39f8317fbdb1988ef4c628eb%22%20font-size%3D%2216%22%20text-anchor%3D%22middle%22%20x%3D%2220.5%22%20y%3D%2230%22%3E%3D%3C%2Ftext%3E%3Cline%20stroke%3D%22%23000000%22%20stroke-linecap%3D%22square%22%20stroke-width%3D%221%22%20x1%3D%2231.5%22%20x2%3D%2260.5%22%20y1%3D%2223.5%22%20y2%3D%2223.5%22%2F%3E%3Ctext%20font-family%3D%22Times%20New%20Roman%22%20font-size%3D%2218%22%20text-anchor%3D%22middle%22%20x%3D%2239.5%22%20y%3D%2216%22%3E%26%23x394%3B%3C%2Ftext%3E%3Ctext%20font-family%3D%22Times%20New%20Roman%22%20font-size%3D%2218%22%20font-style%3D%22italic%22%20text-anchor%3D%22middle%22%20x%3D%2251.5%22%20y%3D%2216%22%3EV%3C%2Ftext%3E%3Ctext%20font-family%3D%22Times%20New%20Roman%22%20font-size%3D%2218%22%20text-anchor%3D%22middle%22%20x%3D%2243.5%22%20y%3D%2241%22%3E%26%23x394%3B%3C%2Ftext%3E%3Ctext%20font-family%3D%22Times%20New%20Roman%22%20font-size%3D%2218%22%20font-style%3D%22italic%22%20text-anchor%3D%22middle%22%20x%3D%2252.5%22%20y%3D%2241%22%3Er%3C%2Ftext%3E%3C%2Fsvg%3E)
- Where:
- E = electric field strength (V m-1)
- ΔV = change in potential (V)
- Δr = displacement in the direction of the field (m)
- An electric field can be defined in terms of the variation of electric potential at different points in the field:
The electric field at a particular point is equal to the gradient of a potential-distance graph at that point
- The potential gradient in an electric field is defined as:
The rate of change of electric potential with respect to displacement in the direction of the field
- The graph of potential V against distance r for a negative or positive charge is:
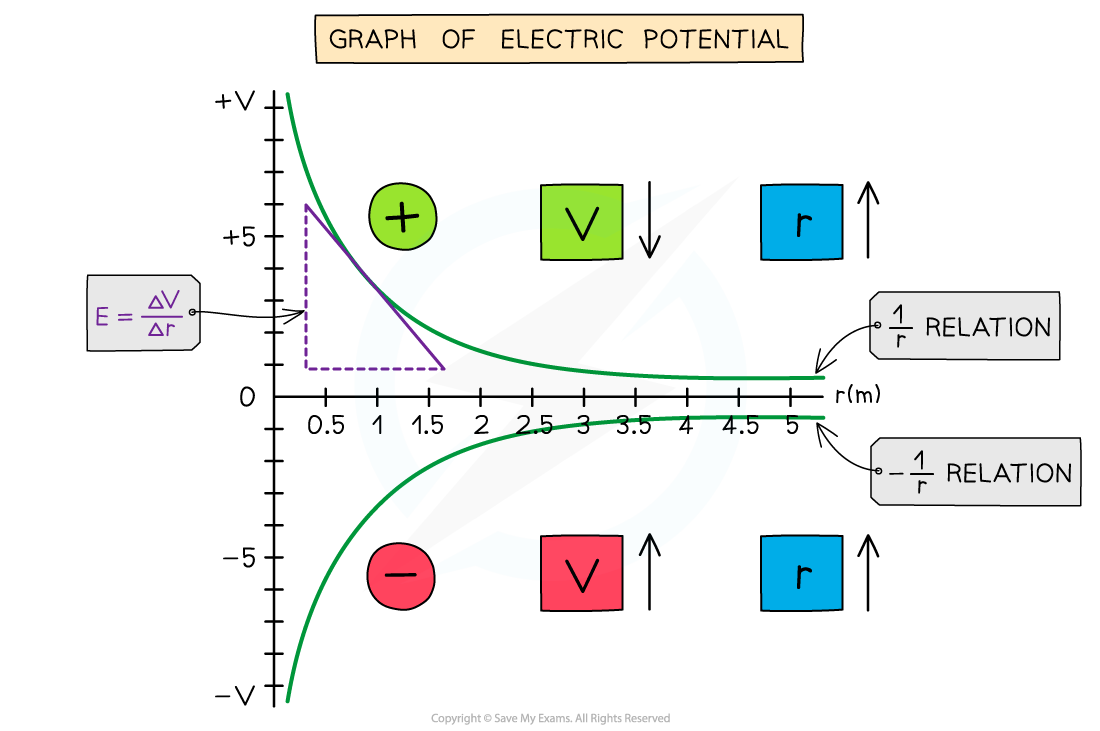
The electric potential around a positive charge decreases with distance and increases with distance around a negative charge
- The key features of this graph are:
- The values for V are all negative for a negative charge
- The values for V are all positive for a positive charge
- As r increases, V against r follows a 1/r relation for a positive charge and -1/r relation for a negative charge
- The gradient of the graph at any particular point is the value of E at that point
- The graph has a shallow increase (or decrease) as r increases
- The electric potential changes according to the charge creating the potential as the distance r increases from the centre:
- If the charge is positive, the potential decreases with distance
- If the charge is negative, the potential increases with distance
- To calculate E, draw a tangent to the graph at that point and calculate the gradient of the tangent
- This is a graphical representation of the equation:
format('truetype')%3Bfont-weight%3Anormal%3Bfont-style%3Anormal%3B%7D%3C%2Fstyle%3E%3C%2Fdefs%3E%3Ctext%20font-family%3D%22Times%20New%20Roman%22%20font-size%3D%2218%22%20font-style%3D%22italic%22%20text-anchor%3D%22middle%22%20x%3D%226.5%22%20y%3D%2230%22%3EV%3C%2Ftext%3E%3Ctext%20font-family%3D%22math1da1748c56a8e6b097a67ee67c2%22%20font-size%3D%2216%22%20text-anchor%3D%22middle%22%20x%3D%2222.5%22%20y%3D%2230%22%3E%3D%3C%2Ftext%3E%3Cline%20stroke%3D%22%23000000%22%20stroke-linecap%3D%22square%22%20stroke-width%3D%221%22%20x1%3D%2233.5%22%20x2%3D%2281.5%22%20y1%3D%2223.5%22%20y2%3D%2223.5%22%2F%3E%3Ctext%20font-family%3D%22Times%20New%20Roman%22%20font-size%3D%2218%22%20font-style%3D%22italic%22%20text-anchor%3D%22middle%22%20x%3D%2257.5%22%20y%3D%2216%22%3EQ%3C%2Ftext%3E%3Ctext%20font-family%3D%22Times%20New%20Roman%22%20font-size%3D%2218%22%20text-anchor%3D%22middle%22%20x%3D%2239.5%22%20y%3D%2241%22%3E4%3C%2Ftext%3E%3Ctext%20font-family%3D%22math1da1748c56a8e6b097a67ee67c2%22%20font-size%3D%2216%22%20font-style%3D%22italic%22%20text-anchor%3D%22middle%22%20x%3D%2250.5%22%20y%3D%2241%22%3E%26%23x3C0%3B%3C%2Ftext%3E%3Ctext%20font-family%3D%22Times%20New%20Roman%22%20font-size%3D%2218%22%20font-style%3D%22italic%22%20text-anchor%3D%22middle%22%20x%3D%2260.5%22%20y%3D%2241%22%3E%26%23x3B5%3B%3C%2Ftext%3E%3Ctext%20font-family%3D%22Times%20New%20Roman%22%20font-size%3D%2213%22%20font-style%3D%22italic%22%20text-anchor%3D%22middle%22%20x%3D%2268.5%22%20y%3D%2249%22%3Eo%3C%2Ftext%3E%3Ctext%20font-family%3D%22Times%20New%20Roman%22%20font-size%3D%2218%22%20font-style%3D%22italic%22%20text-anchor%3D%22middle%22%20x%3D%2276.5%22%20y%3D%2241%22%3Er%3C%2Ftext%3E%3C%2Fsvg%3E)
- Where Q and 4πε0 are constants
- The graph of E against r for a charge is:
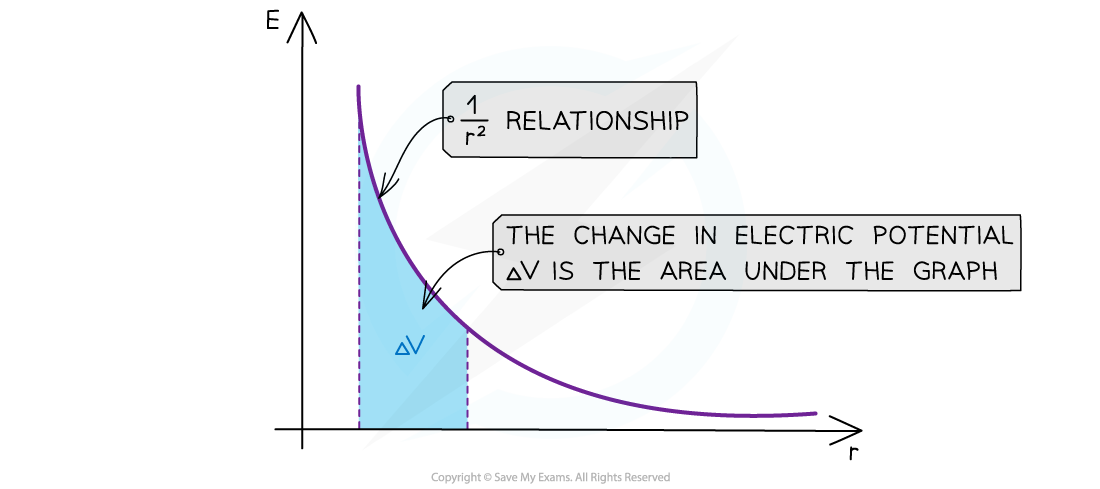
The electric field strength E has a 1/r2 relationship
- The key features of this graph are:
- The values for E are all positive
- As r increases, E against r follows a 1/r2 relation (inverse square law)
- The area under this graph is the change in electric potential ΔV
- The graph has a steep decline as r increases
- The area under the graph can be estimated by counting squares, if it is plotted on squared paper, or by splitting it into trapeziums and summing the area of each trapezium
- The inverse square law relation means that as the distance r doubles, E decreases by a factor of 4
- This is a graphical representation of the equation:
format('truetype')%3Bfont-weight%3Anormal%3Bfont-style%3Anormal%3B%7D%3C%2Fstyle%3E%3C%2Fdefs%3E%3Ctext%20font-family%3D%22Times%20New%20Roman%22%20font-size%3D%2218%22%20font-style%3D%22italic%22%20text-anchor%3D%22middle%22%20x%3D%225.5%22%20y%3D%2230%22%3EE%3C%2Ftext%3E%3Ctext%20font-family%3D%22math1da1748c56a8e6b097a67ee67c2%22%20font-size%3D%2216%22%20text-anchor%3D%22middle%22%20x%3D%2220.5%22%20y%3D%2230%22%3E%3D%3C%2Ftext%3E%3Cline%20stroke%3D%22%23000000%22%20stroke-linecap%3D%22square%22%20stroke-width%3D%221%22%20x1%3D%2231.5%22%20x2%3D%2286.5%22%20y1%3D%2223.5%22%20y2%3D%2223.5%22%2F%3E%3Ctext%20font-family%3D%22Times%20New%20Roman%22%20font-size%3D%2218%22%20font-style%3D%22italic%22%20text-anchor%3D%22middle%22%20x%3D%2258.5%22%20y%3D%2216%22%3EQ%3C%2Ftext%3E%3Ctext%20font-family%3D%22Times%20New%20Roman%22%20font-size%3D%2218%22%20text-anchor%3D%22middle%22%20x%3D%2237.5%22%20y%3D%2242%22%3E4%3C%2Ftext%3E%3Ctext%20font-family%3D%22math1da1748c56a8e6b097a67ee67c2%22%20font-size%3D%2216%22%20font-style%3D%22italic%22%20text-anchor%3D%22middle%22%20x%3D%2248.5%22%20y%3D%2242%22%3E%26%23x3C0%3B%3C%2Ftext%3E%3Ctext%20font-family%3D%22Times%20New%20Roman%22%20font-size%3D%2218%22%20font-style%3D%22italic%22%20text-anchor%3D%22middle%22%20x%3D%2258.5%22%20y%3D%2242%22%3E%26%23x3B5%3B%3C%2Ftext%3E%3Ctext%20font-family%3D%22Times%20New%20Roman%22%20font-size%3D%2213%22%20font-style%3D%22italic%22%20text-anchor%3D%22middle%22%20x%3D%2266.5%22%20y%3D%2250%22%3Eo%3C%2Ftext%3E%3Ctext%20font-family%3D%22Times%20New%20Roman%22%20font-size%3D%2218%22%20font-style%3D%22italic%22%20text-anchor%3D%22middle%22%20x%3D%2274.5%22%20y%3D%2242%22%3Er%3C%2Ftext%3E%3Ctext%20font-family%3D%22Times%20New%20Roman%22%20font-size%3D%2213%22%20text-anchor%3D%22middle%22%20x%3D%2281.5%22%20y%3D%2237%22%3E2%3C%2Ftext%3E%3C%2Fsvg%3E)
- Where Q and 4πε0 are constants
Exam Tip
Drawing, interpreting or calculating from inverse square law graphs are common exam questions - there are lots of similarities between gravitational and electric field graphs:
Graphs of field strength against distance should start off steeper and decrease rapidly compared to that of potential graphs against distance, to distinguish it as an inverse square law (1/r2) relation instead of just an inverse relation (1/r)
There are plenty of differences too:
For example, gravitational potential always increases with respect to distance whereas electric potential can increase or decrease
One way to remember whether the electric potential increases or decreases with respect to the distance from the charge is by the direction of the electric field lines - the potential always decreases in the same direction as the field lines and vice versa.
