Short-run Aggregate Supply (SRAS) (AQA A Level Economics)

Revision Note

Test Yourself
Lorraine Clancy

Expertise

Economics Content Creator

An Introduction to Short-run Aggregate Supply (SRAS)

  • Aggregate supply is the total supply of goods/services produced within an economy at a specific price level at a given time

Diagram: Short-run Aggregate Supply (SRAS) Curve


Diagram showing the upward sloping short run aggregate supply sras curve for A level Economics

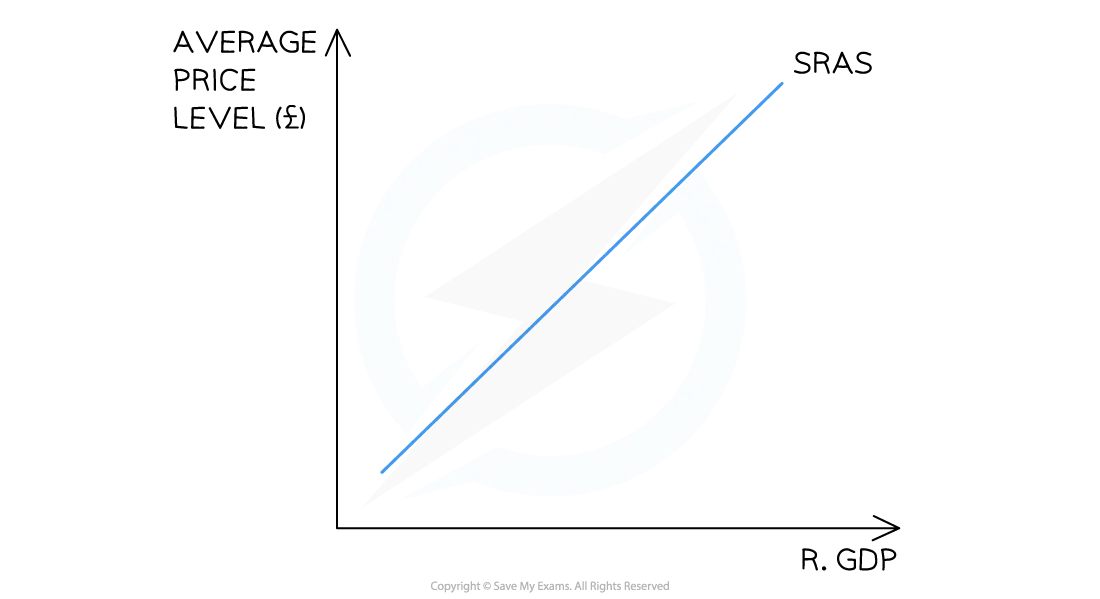
The SRAS is upward-sloping. As price levels rise, firms are incentivised to supply more 

Diagram analysis

  • The SRAS curve is upward-sloping due to two reasons
    • The aggregate supply is the combined supply of all individual supply curves in an economy which are also upward-sloping
    • As real output increases, firms have to spend more to increase production e.g. wage bills will increase
      • Increased costs result in higher average prices

A Movement Along the SRAS Curve

  • Whenever there is a change in the average price level (AP) in an economy, there is a movement along the short-run aggregate supply (SRAS) curve

Diagram: A Movement Along the SRAS Curve

a-diagram-showing-an-increase-and-decrease-in-the-average-price-level-ap-a-level-economics-revision

An increase or decrease in the average price level (AP) causes a movement along the short-run aggregate supply (SRAS) curve, leading to a contraction or expansion of SRAS

Diagram analysis

  • An increase in the AP (ceteris paribus) from AP1 → AP2 leads to a movement along the SRAS curve from A → B
    • There is an expansion of real GDP from Y1 → Y2

  • A decrease in the AP (ceteris paribus) from AP1 → AP3 leads to a movement along the SRAS curve from A → C
    • There is a contraction of real GDP (output) from Y1→Y3

Factors that Cause the Entire SRAS Curve to Shift

  • Shifts in SRAS are caused by changes in conditions of supply in an economy; this usually means changes in the costs of production
      • Changes in the cost of raw materials and energy
      • Changes in exchange rates (E/R)
      • Changes in tax rates

Diagram: A Shift in the SRAS Curve

a-diagram-showing-a-shift-in-the-entire-short-run-aggregate-supply-sras-curve-a-level-economics-revision

The shift of the entire short-run aggregate supply (SRAS) curve is due to a change in one of the determinants of aggregate supply

Diagram analysis

  • A decrease in costs or increase in productivity results in a shift right of the entire curve from SRAS1 → SRAS2
    • At every price level, output and real GDP have increased from Y1 → Y2

  • An increase in costs or decrease in productivity results in a shift left of the entire curve from SRAS1 → SRAS3
    • At every price level, output and real GDP have decreased from Y1 → Y3

The Determinants of Short-run Aggregate Supply

  • Whenever there is a change in the conditions of supply in an economy (e.g. costs of production or productivity changes), there is a shift of the entire SRAS curve
  • There are multiple factors that can influence the short-run aggregate supply (SRAS). These include:
    • Changes in costs of raw materials and energy
    • Changes in wage rates
    • Changes in tax rates
       

The Influences on Short-Run Aggregate Supply (SRAS)


Factor

Explanation Impact on SRAS

Increase in the cost of raw materials and energy

  • As the price of input costs rises, fewer goods and services can be produced with the same amount of money

  • SRAS decreases - curve shifts left

Decrease in costs of raw materials/energy

  • As the price of input costs decrease, more goods/services can be produced with the same amount of money

  • SRAS increases - curve shifts right

Increase in wage rates 

  • Increases in wages increases the cost of production 
    • Higher costs = lower output 

  • SRAS decreases - curve shifts Left

Decrease in wage rates

  • Decrease in wages decreases the cost of production 
    • Lower costs = higher output 

  • SRAS Increases - curve shifts right

Decrease in tax rates

  • Taxes represent an additional cost for firms
  • Decreasing taxes = decrease in costs
    • Lower costs = more output

  • SRAS increases - curve shifts right

Increase in tax rates

  • Taxes represent an additional cost for firms
  • Increasing taxes = increase in costs
  • Higher costs = less output

  • SRAS decreases - curve shifts left

You've read 0 of your 0 free revision notes

Get unlimited access

to absolutely everything:

  • Downloadable PDFs
  • Unlimited Revision Notes
  • Topic Questions
  • Past Papers
  • Model Answers
  • Videos (Maths and Science)

Join the 100,000+ Students that ❤️ Save My Exams

the (exam) results speak for themselves:

Did this page help you?

Lorraine Clancy

Author: Lorraine Clancy

Lorraine brings over 12 years of dedicated teaching experience to the realm of Leaving Cert and IBDP Economics. Having served as the Head of Department in both Dublin and Milan, Lorraine has demonstrated exceptional leadership skills and a commitment to academic excellence. Lorraine has extended her expertise to private tuition, positively impacting students across Ireland. Lorraine stands out for her innovative teaching methods, often incorporating graphic organisers and technology to create dynamic and engaging classroom environments.