
Flood Hydrographs
- The volume of water moving past a point in a river per given time is called the discharge – m³ /sec or cumecs
- Discharge is calculated as Q = A x V
- Q is discharged in cumecs
- A is a cross-sectional area in m²
- V is the velocity in m/s
- There is a discharge relationship within drainage basins
- The level of discharge is influenced by:
- Rate of precipitation
- The speed at which water transfers to the river across the drainage basin
- Rivers act as the main conduit within a drainage basin to transfer water within the system
- Knowing a drainage basin's input (precipitation) and calculating a river's discharge (output) shows how much water is stored within a drainage basin at any given time
Hydrographs
- Hydrographs are used to measure discharge
- There are two types of hydrographs:
- Annual
- Storm
- Annual hydrographs, also known as a river's regime, show the pattern of seasonal variation that takes place through a drainage basin to river discharge over a year
- Hydrographs are measured in cumecs
- Different conditions in different locations produce different levels of discharge over the course of a year
- They may show marked seasonal peaks and low flows, greatly influenced by changes in precipitation, temperature, vegetation or geology
- E.g. big swings in discharge in tropical rivers relate to the wet and dry seasons; spring increases often suggest melting snow; and permeable rocks reduce discharge most of the year
- E.g. big swings in discharge in tropical rivers relate to the wet and dry seasons; spring increases often suggest melting snow; and permeable rocks reduce discharge most of the year
Worked example
The figure below shows the river regime of a temperate deciduous region - typical of a cool temperate maritime climate. Outline the characteristics of this river regime.
[4 marks]

- Marks are awarded for using information taken from the graph [1] - facts, figures, calculations between the totals and development of the data - annual rate, % of precipitation in summer against winter or comparison between months [d] - rather than just standard statements
- In this graph, there is no indication of which country the River Severn is located and unless absolutely sure of the location, it is best to avoid assuming that winter is Nov - March as this river could be in the southern hemisphere in which case, it would be summer!
- In this instance, the River Severn is in the UK, and therefore, the northern hemisphere
Answer:
- The total discharge of the River Severn over the year is 7475 cumecs [1] with an average discharge of 623 cumecs per month [1d]
- The highest discharges are during the months of November to April with 4700 cumecs and lowest between May and October with 2775 cumecs [1], a difference of 1925 cumecs which is 2.43 times larger than the drier months discharge [1d]
- The wettest month is February, with a discharge measuring 850 cumecs [1]
- The driest month is August with a discharge of 350 cumecs [d]
- The discharge declines in half a year and then takes half a year to increase [d]
Storm hydrographs
- Storm hydrographs show changes in a river’s discharge during and after a storm
- Usually, they are drawn to show how a river reacts to an individual storm
- They compare two variables - rainfall received during an event in mm and river discharge m3/sec
-
Each storm hydrograph has a series of parts

Image showing the terminology of a flood/storm hydrograph. Note that rainfall is always in mm and a bar chart and discharge in cumecs m³/sec as a line graph measured over time (usually hours, but can be days)
- There are 3 ways that water from a drainage basin is transferred:
- Directly into the channel – not much
- Surface flow – most often
- Infiltration - through and baseflow
- The typical shape of a flood/storm hydrograph can be referred to as either 'flashy' or 'flat'
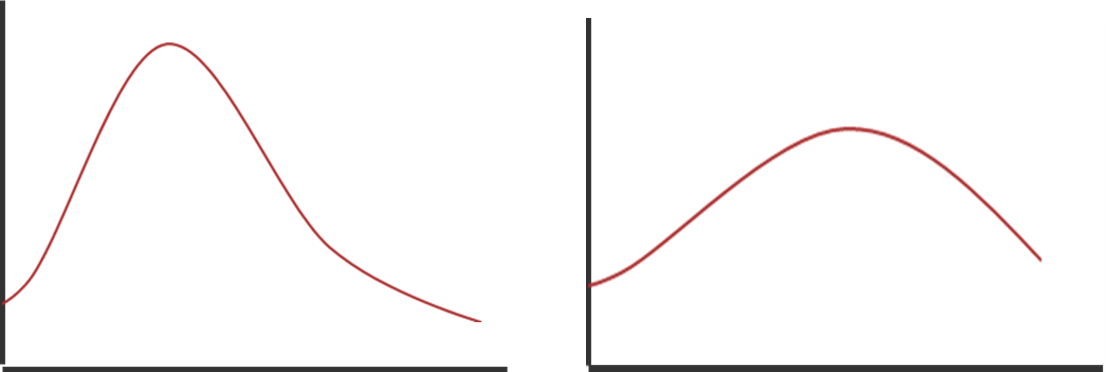
|
'Flashy' hydrograph showing short lag time with high peak discharge |
‘Flat’ hydrograph with low peak discharge |
Exam Tip
- You may be asked to compare graphs of the same river on different occasions or different rivers responding to the same storm
- Key points to mention when describing hydrographs:
- Steepness of the rising and falling limb
- The value of the peak discharge
- The lag time (period of time between peak rainfall and peak discharge)
- Time is taken to return to normal
