Water Budgets & River Systems (Edexcel A Level Geography)

Revision Note

Test Yourself
Bridgette

Author

Bridgette

Expertise

Geography Lead

Water Budgets

  • Drainage basins are self-adjusting systems to create balance
  • If one part is 'out', then one or all the others will compensate
  • The balance between inputs and outputs is known as the water balance 
  • The water balance helps to understand the behaviour of individual drainage basins 
  • The water balance can be shown using the formula:
    • precipitation (P) = total runoff (streamflow) (O) + evapotranspiration (E) +/- changes in storage (S)

bold P bold space bold equals bold O bold plus bold E bold plus-or-minus bold S

  • The water balance shows how much water is stored in a system
  • The general water balance in the UK shows seasonal patterns
  • In wet seasons, precipitation is greater than evapotranspiration which creates a water surplus
  • Ground stores fill with water which results in increased surface runoff, higher discharge and higher river levels
  • This means there is a positive water balance
  • In drier seasons evapotranspiration exceeds precipitation, as plants absorb water, ground stores are depleted
  • This produces a water deficit at the end of a dry season generating a negative water balance

Soil water budget

  • Shows the balance between inputs and outputs of a soil store over a year
  • The budget depends on soil depth, type, texture and permeability 
  • The following is based on a typical UK soil budget

water-budget-1

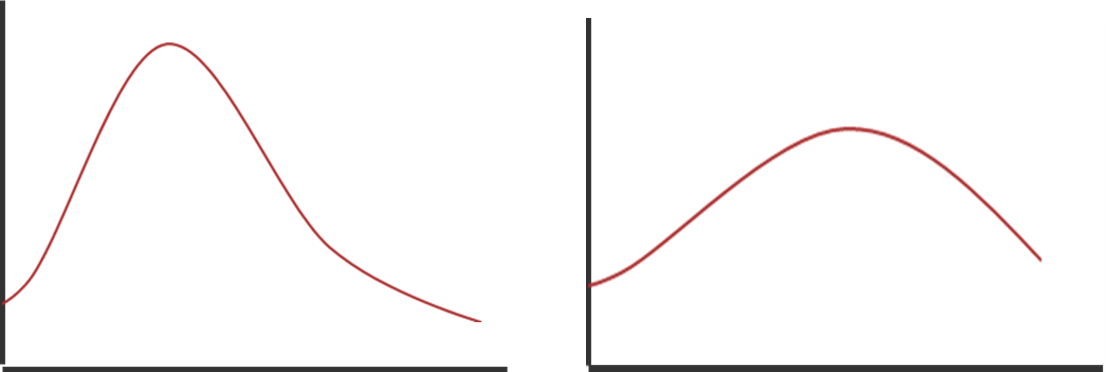
Graph showing changes in soil moisture stores, on a local scale, over a year

River Regimes

  • The volume of water moving past a point in a river per given time is called the discharge – m³ /sec or cumecs
  • Discharge is calculated as Q = A x V
    • Q is discharged in cumecs
    • A is a cross-sectional area in m²
    • V is the velocity in m/s 
  • There is a discharge relationship within drainage basins
  • The level of discharge is influenced by:
    • Rate of precipitation
    • The speed at which water transfers to the river across the drainage basin
  • Rivers act as the main conduit within a drainage basin to transfer water within the system
  • Knowing a drainage basin's input (precipitation) and calculating a river's discharge (output) shows how much water is stored within a drainage basin at any given time

Hydrographs

  • Hydrographs are used to measure discharge
  • There are two types of hydrographs:
    • Annual
    • Storm
  • Annual hydrographs, also known as a river's regime, show the pattern of seasonal variation that takes place through a drainage basin to river discharge over a year
  • Hydrographs are measured in cumecs
  • Different conditions in different locations produce different levels of discharge over the course of a year
  • They may show marked seasonal peaks and low flows, greatly influenced by changes in precipitation, temperature, vegetation or geology
    • E.g. big swings in discharge in tropical rivers relate to the wet and dry seasons; spring increases often suggest melting snow; and permeable rocks reduce discharge most of the year

Storm Hydrographs

  • Storm hydrographs show changes in a river’s discharge during and after a storm
  • Usually, they are drawn to show how a river reacts to an individual storm
  • They compare two variables - rainfall received during an event in mm and river discharge m3/sec
  • Each storm hydrograph has a series of parts

storm-hydrographImage showing the terminology of a flood/storm hydrograph. Note that rainfall is always in mm and a bar chart and discharge in cumecs m³/sec as a line graph measured over time (usually hours, but can be days)

  • There are 3 ways that water from a drainage basin is transferred:
    • Directly into the channel – not much
    • Surface flow – most often
    • Infiltration  - through and baseflow
  • The typical shape of a flood/storm hydrograph can be referred to as either 'flashy' or 'flat'

hydrographs

'Flashy' hydrograph showing short lag time with high peak discharge   

‘Flat’ hydrograph with low peak discharge

Factors affecting the shape of the hydrograph

Factor

'Flashy' hydrograph

Short lag time, high peak discharge, steep rising limb

'Flat' hydrograph

Long lag time, low peak discharge, gentle rising limb

Rock type Impermeable rock - decreases percolation and increases surface run off Permeable rock - allow percolation leading to lower surface run off
Soils Clay soils have a low infiltration rate increasing surface run off Sandy soils have a high infiltration rate, decreasing surface run off
Weather/climate

Heavy or prolonged rainfall and rapid snowmelt can exceed the capacity of the soil leading to increased surface run off

Low evaporation rates increases surface run off 

Steady rainfall and slow thaw of snow don't exceed the infiltration capacity of the soil

High evaporation rates lead to lower surface run off

Antecedent conditions Saturated soil so infiltration is low and surface run off greater Unsaturated soils so infiltration is high and surface run off low
Vegetation

Deciduous plants/trees mean interception levels are lower in winter

Lack of vegetation leads to less interception 

Deciduous plants/trees mean there are high levels of interception 

Greater levels of vegetation leads to higher interception

Drainage basin size Smaller basins have steep rising limbs and short lag times as water reaches the rivers more quickly Large basins have longer lag times and gentler rising limbs as the water takes longer to flow through the drainage basin
Human activity

Deforestation reduces interception

Urbanisation increases impermeable surfaces

Agriculture can increase compaction of the soil and ploughing can increase surface run off

Afforestation increases interception

Exam Tip

  • You may be asked to compare graphs of the same river on different occasions or different rivers responding to the same storm
  • Key points to mention when describing hydrographs:
    • Steepness of the rising and falling limb
    • The value of the peak discharge
    • The lag time (period of time between peak rainfall and peak discharge)
    • Time is taken to return to normal

You've read 0 of your 0 free revision notes

Get unlimited access

to absolutely everything:

  • Downloadable PDFs
  • Unlimited Revision Notes
  • Topic Questions
  • Past Papers
  • Model Answers
  • Videos (Maths and Science)

Join the 100,000+ Students that ❤️ Save My Exams

the (exam) results speak for themselves:

Did this page help you?

Bridgette

Author: Bridgette

After graduating with a degree in Geography, Bridgette completed a PGCE over 25 years ago. She later gained an MA Learning, Technology and Education from the University of Nottingham focussing on online learning. At a time when the study of geography has never been more important, Bridgette is passionate about creating content which supports students in achieving their potential in geography and builds their confidence.