Market Failure: Negative Externalities (AQA A Level Economics)

Revision Note

Test Yourself
Claire France

Expertise

Economics Content Creator

An Introduction to Externalities

  • Externalities occur when there is an external impact on a third party not involved in the economic transaction
    • These impacts can be negative or positive and are often referred to as spillover effects
    • These impacts can be on the production side of the market (producer supply) or on the consumption side of the market (consumer demand)

  • External costs occur when the social costs of an economic transaction are greater than the private costs
    • A private cost for the producer is what they actually pay to produce a good/service
    • An external cost (negative externality) is the damage not factored in to the economic activity (for example, generating air pollution when producing electricity)
    • Private cost + external cost = social costs

  • External benefits occur when the social benefits of an economic transaction are greater than the private benefits
    • A private benefit for the consumer is what they actually gain from consuming a good/service
    • An external benefit (positive externality) is the benefit not factored in to the economic activity (for example, someone who studies law enjoys private benefits but society benefits from having strong legal institutions)
    • Private benefit + external benefit = social benefits

Negative Externalities of Production

  • Negative externalities of production are often created during the production of a good/service
    • The externalities are caused by producer supply and result in a negative external impact on a third party

  • As only the private costs are considered by producers and not the external costs, firms will over-produce these goods and services, causing market failure
    • If the external costs were considered, the quantity of goods and services produced would decrease, and they would be sold at a higher price
    • E.g The impact of air pollution, water contamination, noise pollution and health problems in local communities from 

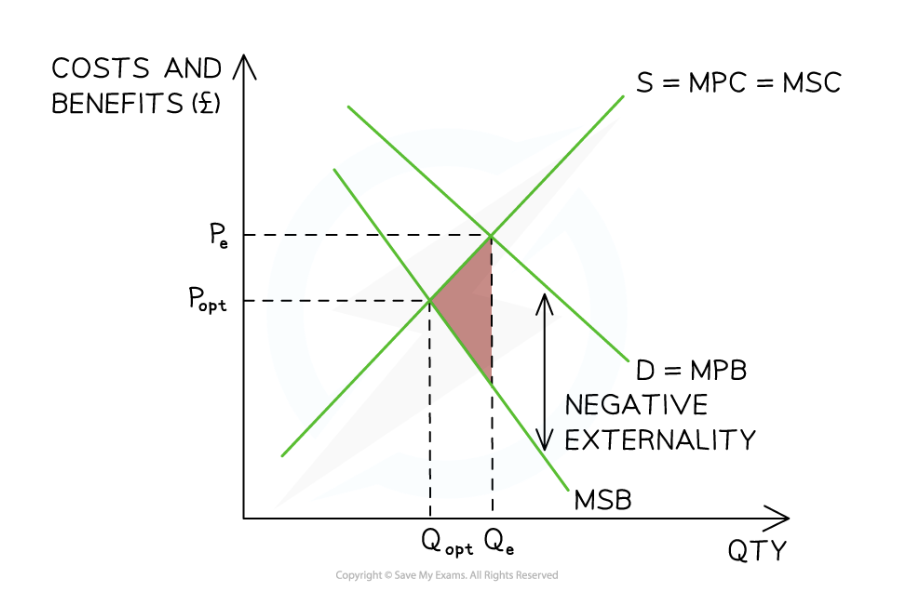
Diagram: Negative Externality of Production

diagram-of-external-costs-of-production-negative-externality-a-level-economics-revision-

External costs of production results in an over-production equal to Qopt - Qe

Diagram analysis

  • The marginal social benefit (MSB) is assumed to equal the marginal private benefit (MPB) as the focus is on the producer (supply) side of the market
  • The larger the external costs in production, the larger the gap between the marginal private cost (MPC) and the marginal social cost (MSC)
  • The optimal allocation of resources for society, would generate an equilibrium where MSB = MSC
    • This is at PoptQopt which is allocatively efficient
    • There is no market failure at this equilibrium

  • The free-market allocates resources at the private optimum as firms fail to take into account the full social costs (negative externalities) from production, resulting in a welfare loss
    • This is shown at PeQe where the MPC = MSB

  • As the MPC are less than the MSC, there is an over-production equal to Qe - Qopt
  • At any quantity produced beyond Qopt, the MSC is greater than the MSB, resulting in a deadweight loss to society (pink triangle)
  • To be socially efficient, factors of production should be reallocated to producing other goods/services
  • There is an opportunity for government intervention (indirect taxes, legislation, regulation, etc.), to force this market to be more socially efficient and reduce the overall welfare loss to society

Negative Externalities of Consumption

  • Negative externalities of consumption are often created during the consumption of a good/service
    • The externalities are caused by consumer demand and result in a negative external impact on a third party

    • As only the private costs are considered by consumers and not the external costs, individuals will over-consume these goods and services, causing a market failure
      • If the external costs were considered, the quantity of goods and services demanded would decrease, and they would be sold at a lower price
      • Common examples of negative externalities from consumption include cigarettes, alcohol, fatty foods and single-use plastic products

Diagram: Negative Externality of Consumption 

screenshot-2024-03-06-at-15-20-04

External costs of consumption result in overconsumption, as shown by the gap between Qopt and Qe

Diagram analysis

  • The MSC is assumed to be equal to the MPC as the focus is on the consumer (demand) side of the market
  • The larger the external costs in consumption, the larger the gap between the MPB and the MSB
  • The optimum allocation of resources for society, would generate an equilibrium where MSB = MSC
    • This is at PoptQopt which is allocatively efficient
    • There is no market failure at this equilibrium

  • The free-market allocates resources at the private optimum as consumers fail to take into account the negative externalities from consumption, resulting in a welfare loss
    • This is shown at PeQe where MPB = MSC

  • As the MPB are greater than the MSB, there is an over-consumption of goods from Qopt - Qe
  • At any quantity consumed beyond Qopt, the MSC is greater than the MSB, resulting in a deadweight loss (DWL) to society (pink triangle)
  • To be socially efficient, fewer factors of production should be allocated to producing this good/service
  • There is an opportunity for government intervention (indirect taxes, legislation, regulation, etc.), to force this market to be more socially efficient and reduce the overall welfare loss to society

Worked example

The existence of negative externalities in consumption results in a misallocation of resources. This is because at the free market level of output the

A. The marginal social benefit exceeds the marginal social cost

B. The marginal private cost equals the marginal social cost.

C. The marginal social benefit is less than the marginal social cost

D. The marginal social cost is less than the marginal private benefit 

Answer

C. The marginal social benefit is less than the marginal social cost

The free market allocates resources at the private optimum as consumers fail to take into account the negative externalities from consumption, this is where the MPB = MSC

The market equilibrium leads to a misallocation of resources, as it fails to account for the negative externalities, resulting in overconsumption of the good or service. The social cost of consumption will be higher than the social benefit (the benefit is only to the private individual consuming the good/service), therefore MSB < MSC

Exam Tip

You should be able to illustrate the misallocation of resources resulting from externalities in production and consumption. 

When the external benefit or cost is on the producer side, there will be two supply curves. 

When the benefit or cost is on the consumer side, there will be two demand curves.

The direction of the triangle that shows the DWL should always point towards the social optimum equilibrium.

You've read 0 of your 0 free revision notes

Get unlimited access

to absolutely everything:

  • Downloadable PDFs
  • Unlimited Revision Notes
  • Topic Questions
  • Past Papers
  • Model Answers
  • Videos (Maths and Science)

Join the 100,000+ Students that ❤️ Save My Exams

the (exam) results speak for themselves:

Did this page help you?

Claire France

Author: Claire France

Claire has taught A Level and GCSE Maths and Economics as well as teaching Economics at a University in the UK. She is an AQA examiner and a successful subject lead. She loves creating informative resources that engage learners and build their passion for the subject.