1
3 marks
Study Figure 4A.

Figure 4A Diagram showing the water cycles
Explain one reason why over-abstraction of groundwater could become a problem for Area A.
Was this exam question helpful?
Exam code: 9GE0
Study Figure 4A.
Figure 4A Diagram showing the water cycles
Explain one reason why over-abstraction of groundwater could become a problem for Area A.
Was this exam question helpful?
Study Figure 4

Figure 4
Changes to precipitation patterns during an El Niño event
Explain one impact of an El Niño event on the hydrological system.
Was this exam question helpful?
Study Figure 4a

Figure 4a
Water budget of Cloverdale, California in 2016
Explain the relationship between precipitation and soil moisture.
Was this exam question helpful?
Study Figure 4.
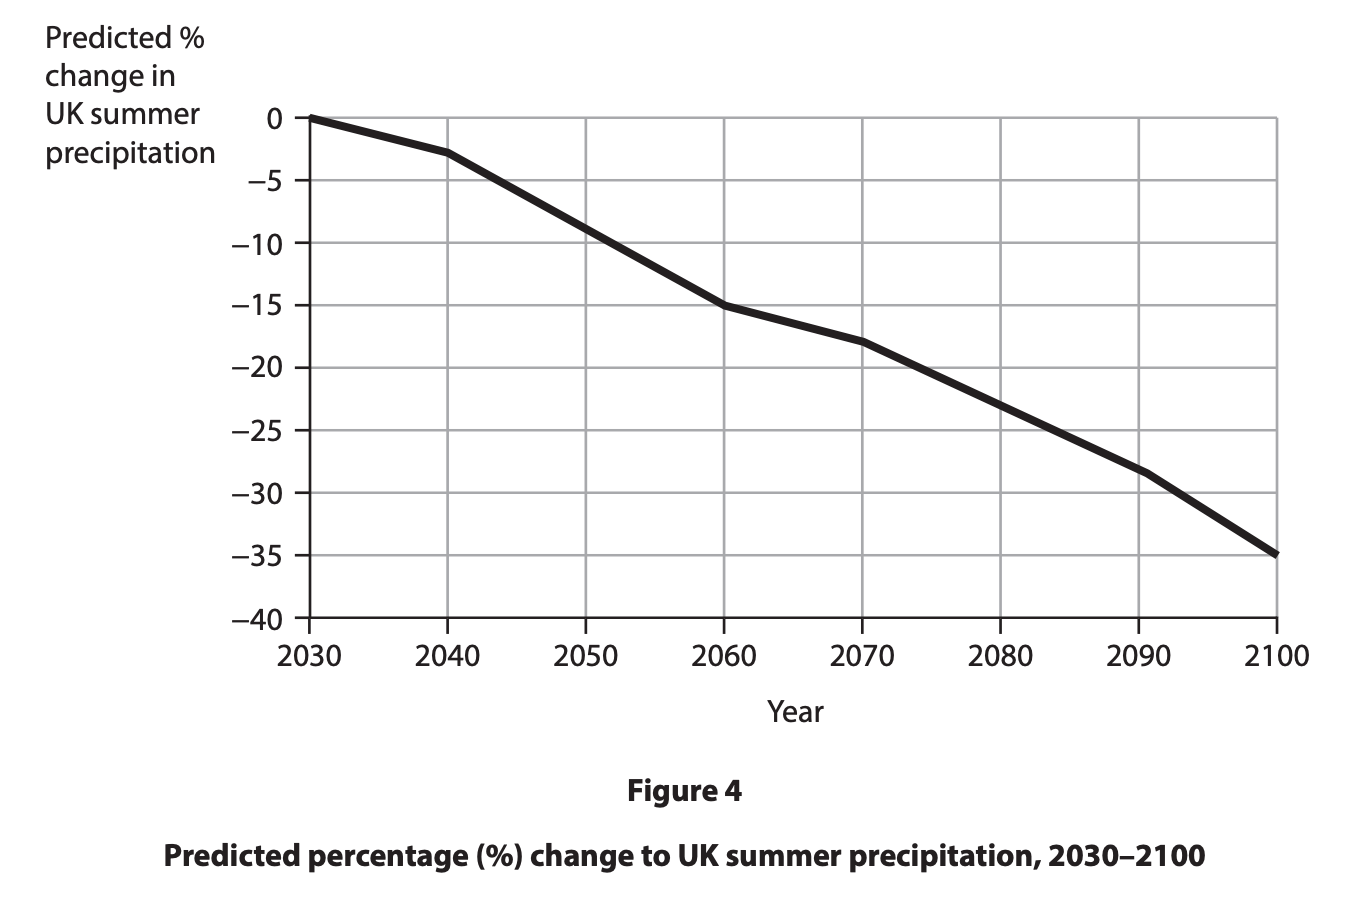
Suggest one possible impact of the changes shown on forest ecosystems.
Was this exam question helpful?
Study Figure 1, which shows rainfall data for two recent UK flood events.
Figure 1: Rainfall in two UK flood events
Event | Rainfall recorded |
|---|---|
Summer 2007 (England & Wales, May–July) | 414 mm – wettest summer since records began (1766) |
February 2020 (England) | 141% of the average February rainfall in under 2 weeks |
Suggest one reason why the rainfall shown led to widespread flooding.
Was this exam question helpful?
Study Figure 1, which shows atmospheric and ocean conditions during an El Niño event.
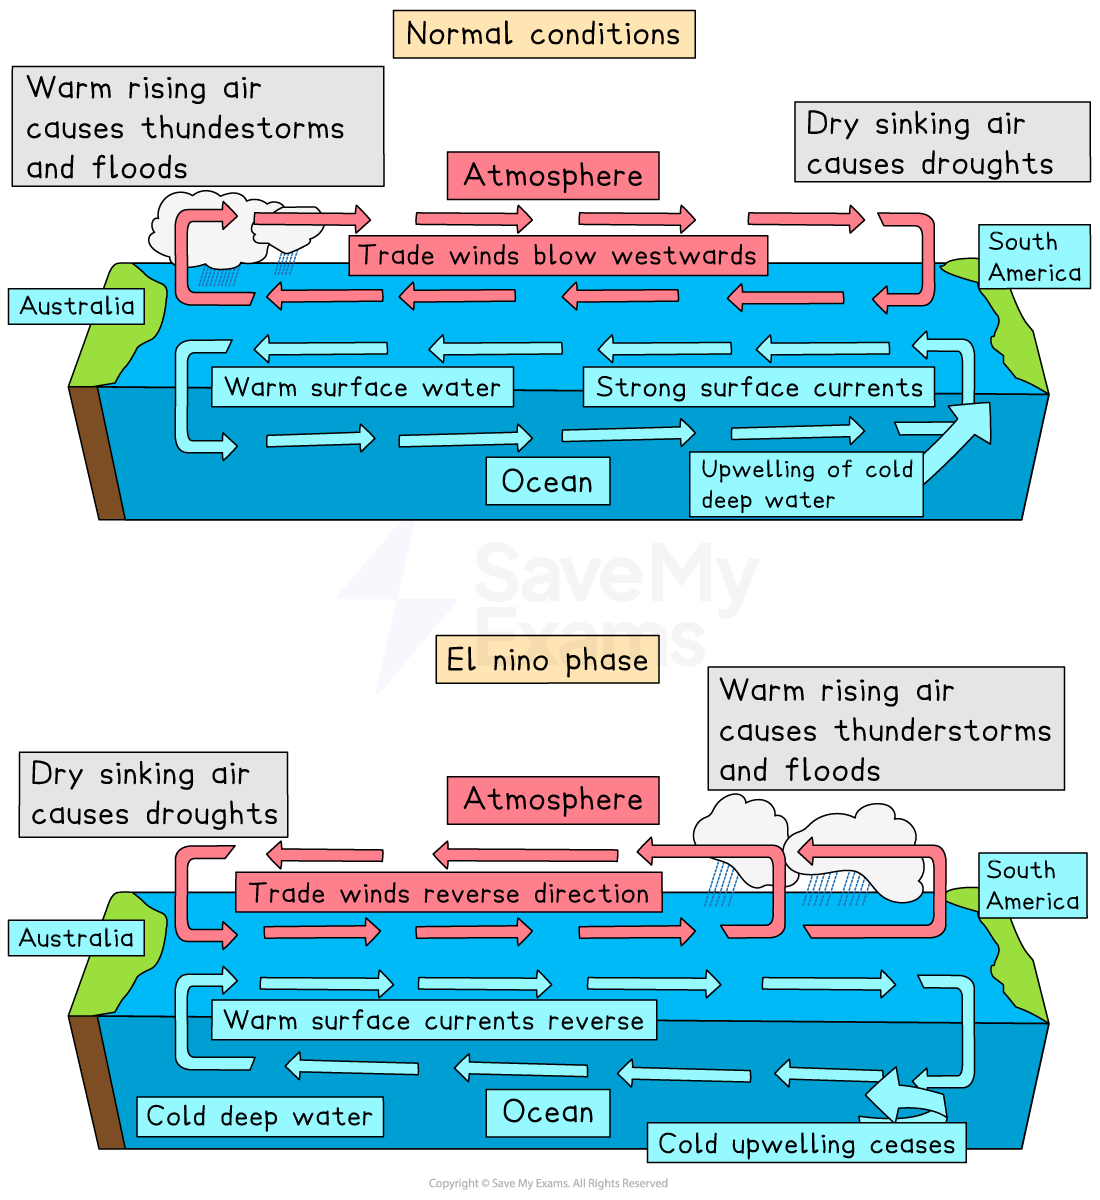
Suggest one reason why El Niño can cause drought in Australia.
Was this exam question helpful?
Study Figure 1, which shows projected changes in precipitation with climate change.
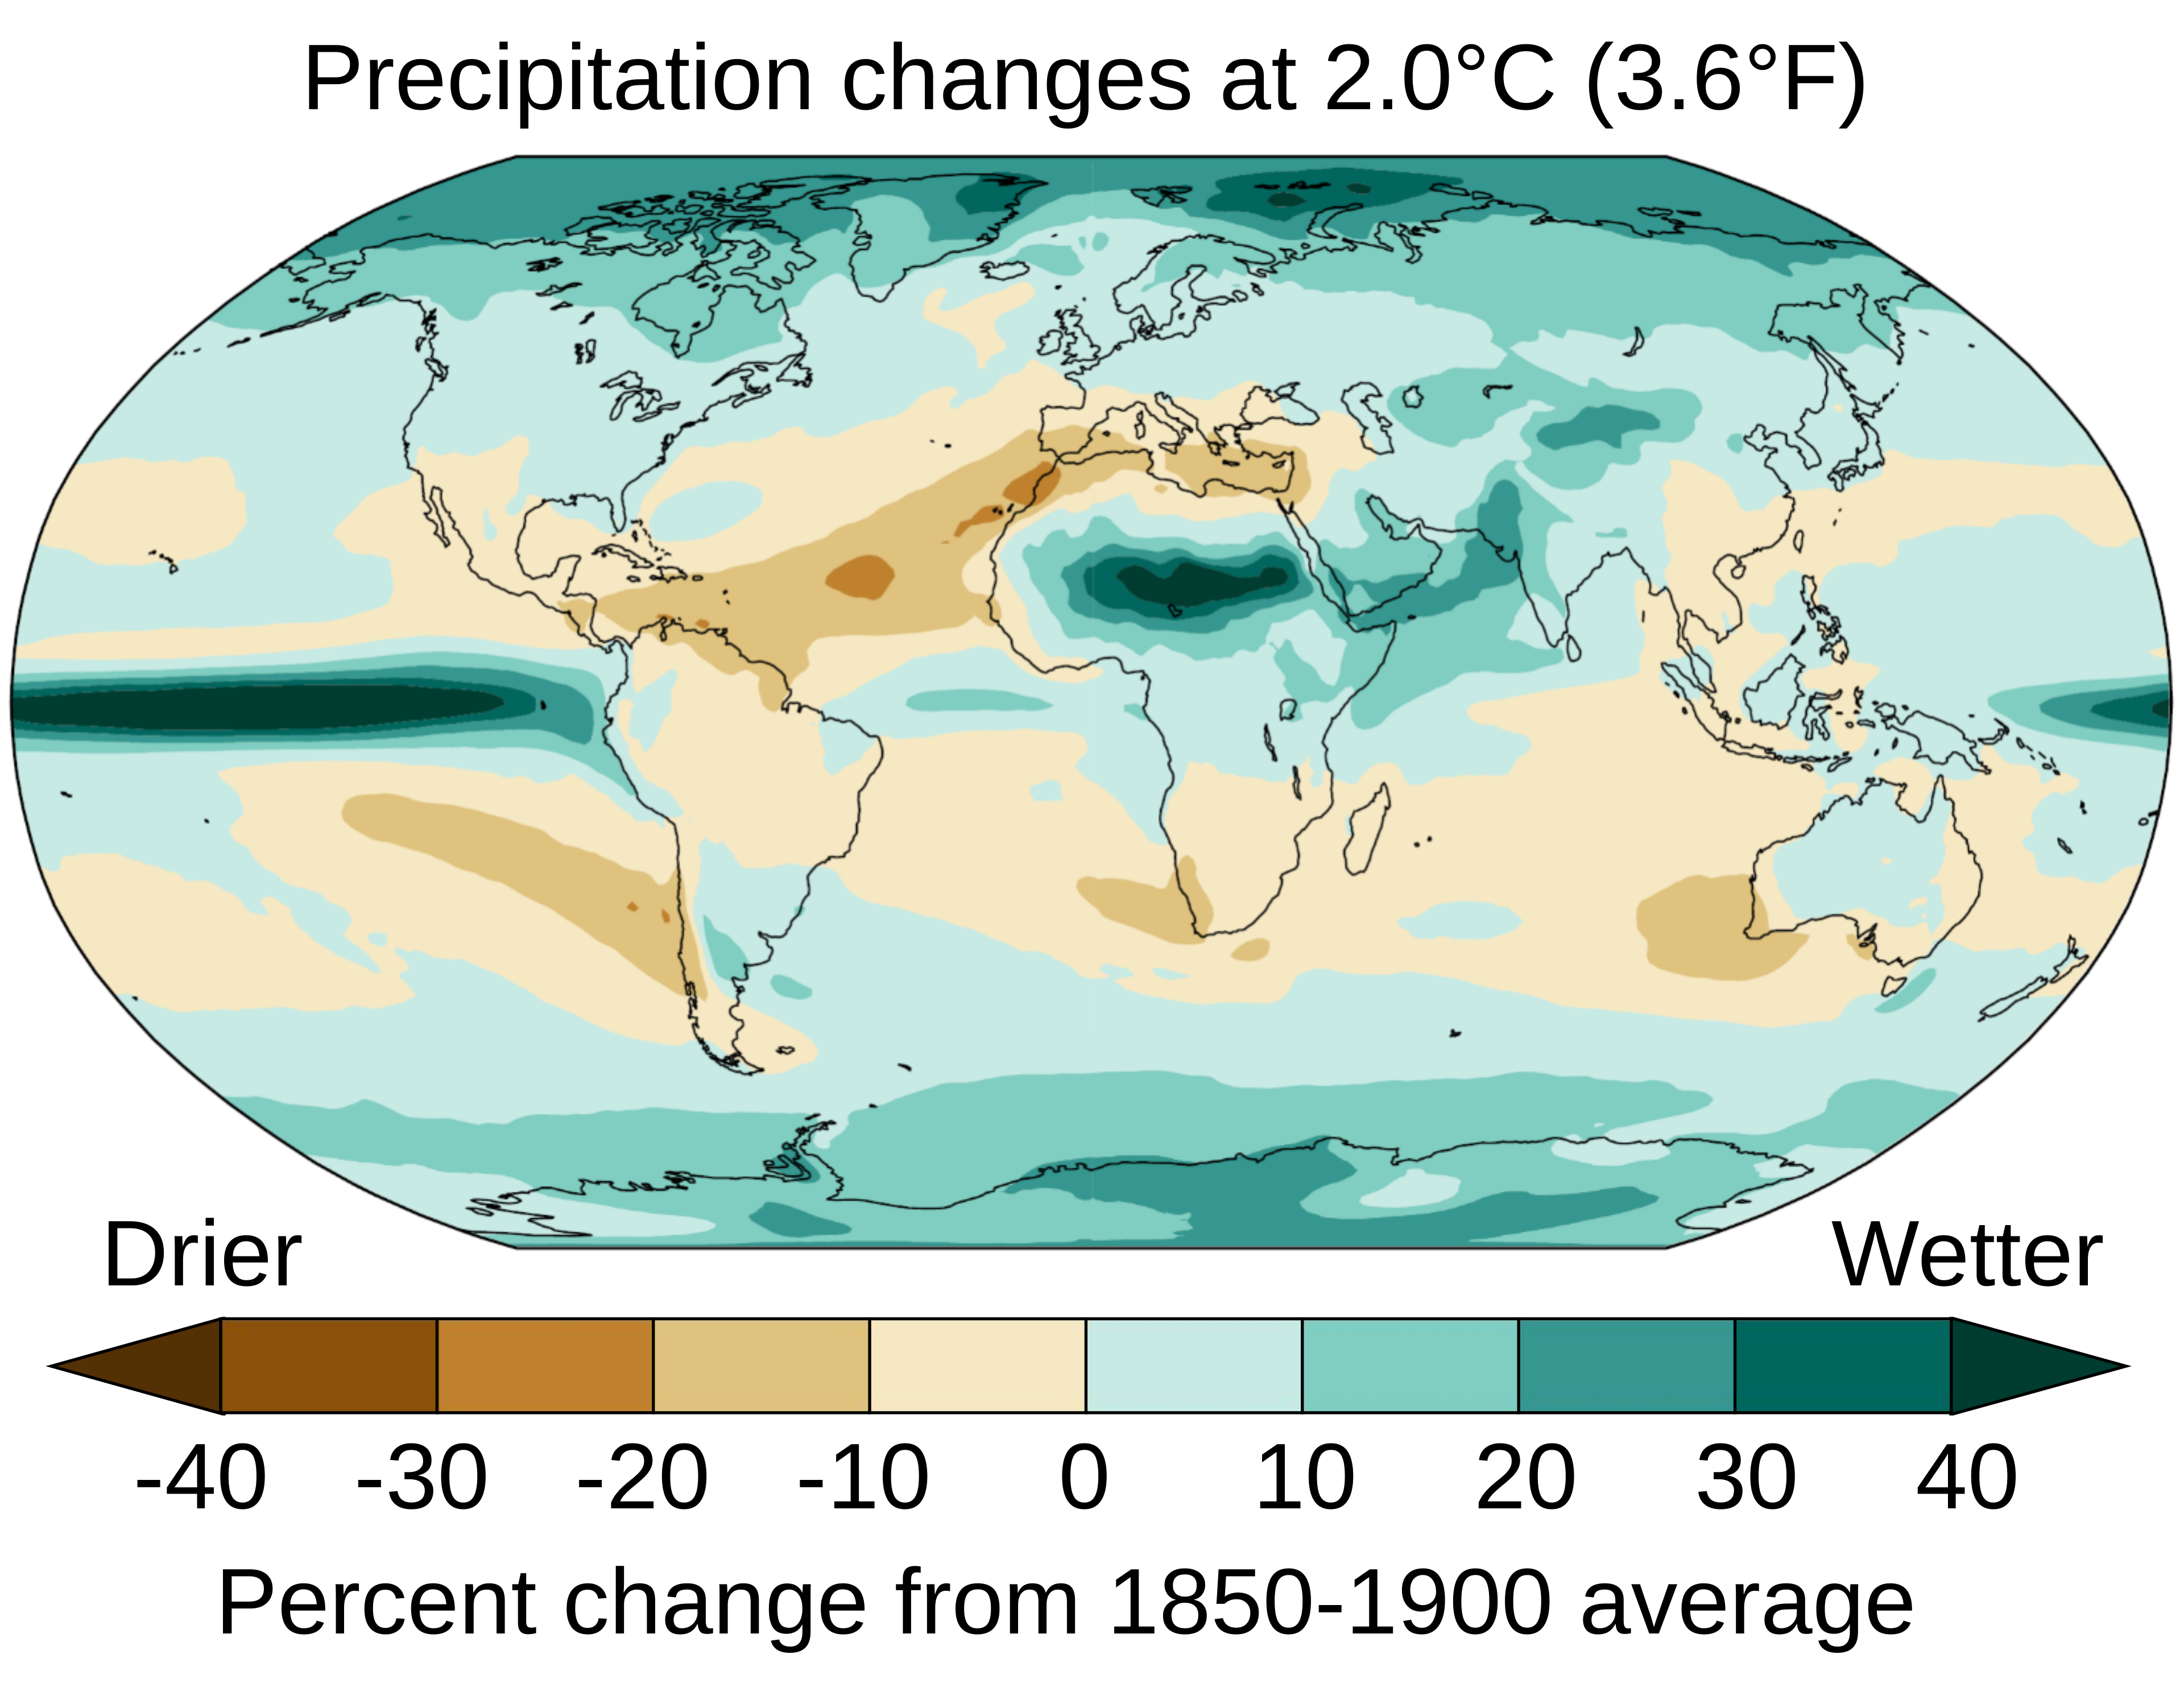
Suggest one reason why areas between 10° and 30° north and south of the Equator may face greater water insecurity in the future.
Was this exam question helpful?
Study Figure 1, which shows information about the Sahel region of Northern Africa.
Figure 1: The Sahel region
Feature | Detail |
|---|---|
Annual precipitation | 250–600 mm (semi-arid) |
Population growth | around 3% per year |
Food production growth | around 2% per year |
Common land practices | overgrazing, deforestation, slash-and-burn, over-cultivation |
Suggest one way human activity increases the risk of drought in the Sahel.
Was this exam question helpful?
Explain why land use changes can increase flood risk.
Was this exam question helpful?
Explain why hard engineering may increase the risk of river flooding in some places.
Was this exam question helpful?
Explain the contribution of human activity to the risk of drought.
Was this exam question helpful?
Explain how meteorological conditions can cause river flooding.
Was this exam question helpful?
Explain how human activity can increase the risk of drought.
Was this exam question helpful?
Explain how human actions within a drainage basin can increase the risk of flooding.
Was this exam question helpful?
Explain how climate change may affect the stores and flows of the hydrological cycle.
Was this exam question helpful?
Evaluate the view that land use changes are the main cause of the increasing risk of river flooding.
Was this exam question helpful?
Study Figure 1, which shows information about the Australian Millennium drought.
Assess the extent to which human activity, rather than physical processes, was responsible for the severity of this drought.
Was this exam question helpful?
Evaluate the view that the impacts of climate change on the hydrological cycle are too uncertain to plan for.
Was this exam question helpful?