13 marks
Study Figure 1, which shows the distribution of the Earth's water.
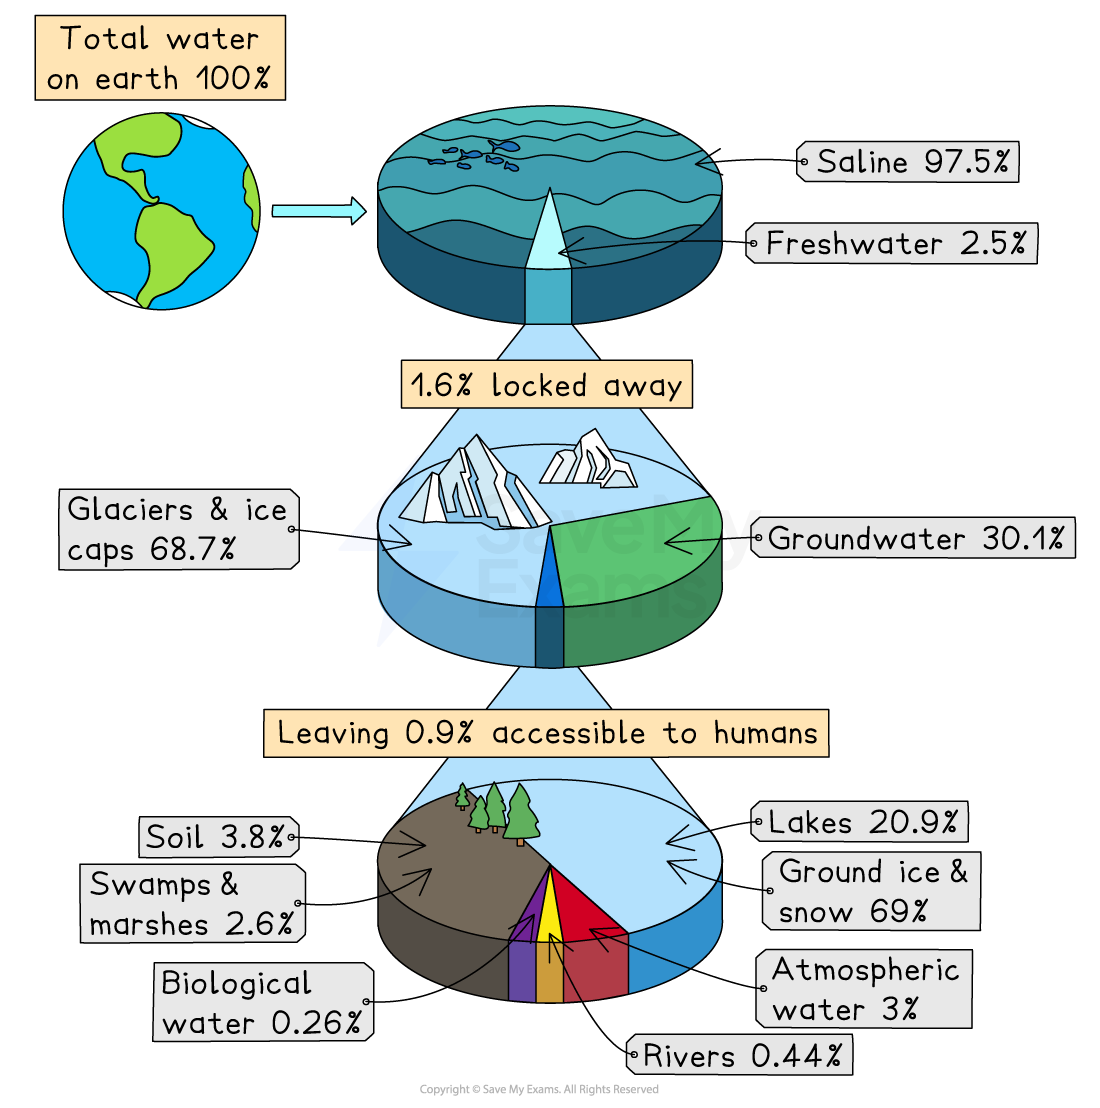
Suggest one reason why only a very small proportion of the world's water is available for human use.
Was this exam question helpful?
Exam code: 9GE0
Study Figure 1, which shows the distribution of the Earth's water.
Suggest one reason why only a very small proportion of the world's water is available for human use.
Was this exam question helpful?
Study Figure 1, a storm hydrograph for a heavily urbanised river catchment.
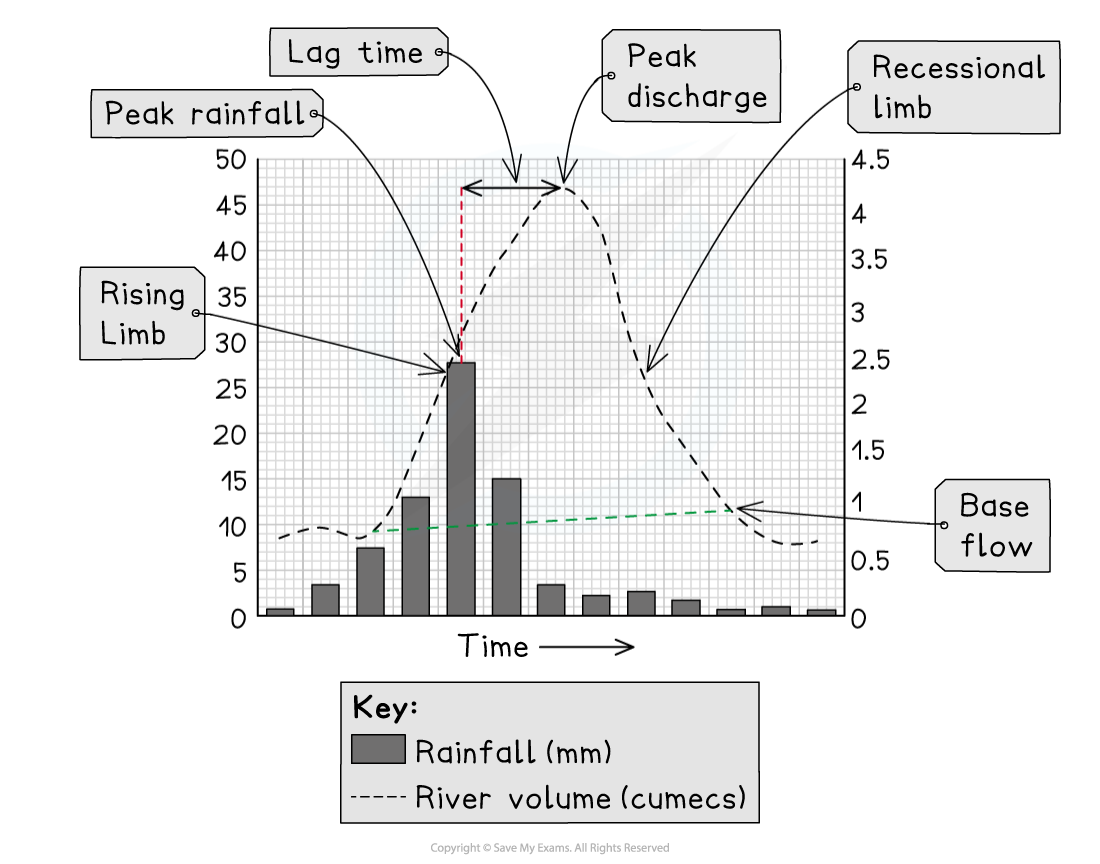
Suggest one reason for the short lag time shown on the hydrograph.
Was this exam question helpful?
Study Figure 1, a soil water budget graph for a location in the UK.
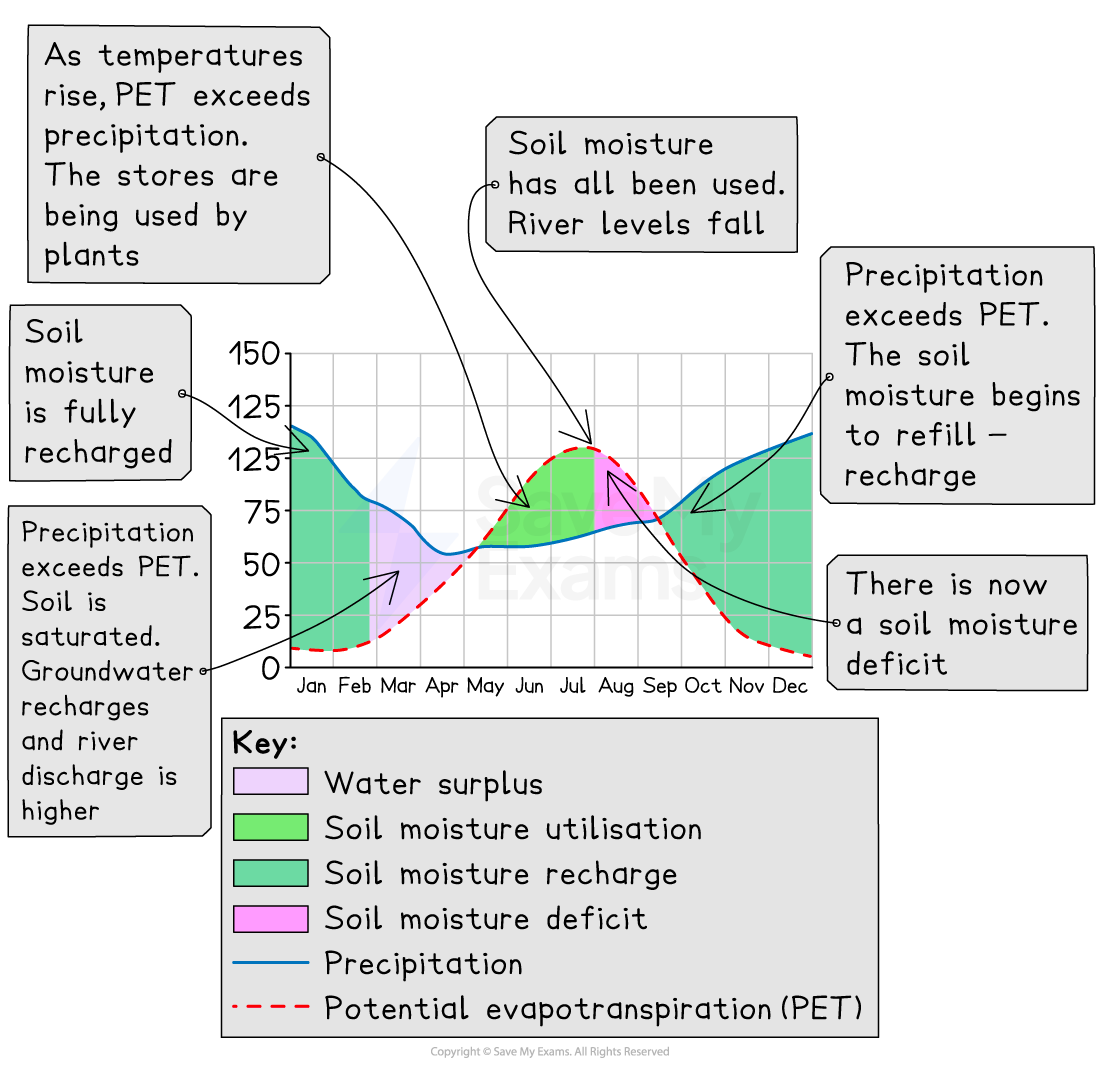
Suggest one reason for the soil moisture deficit shown during the summer months.
Was this exam question helpful?
Study Figure 1, a diagram of a drainage basin as an open system.
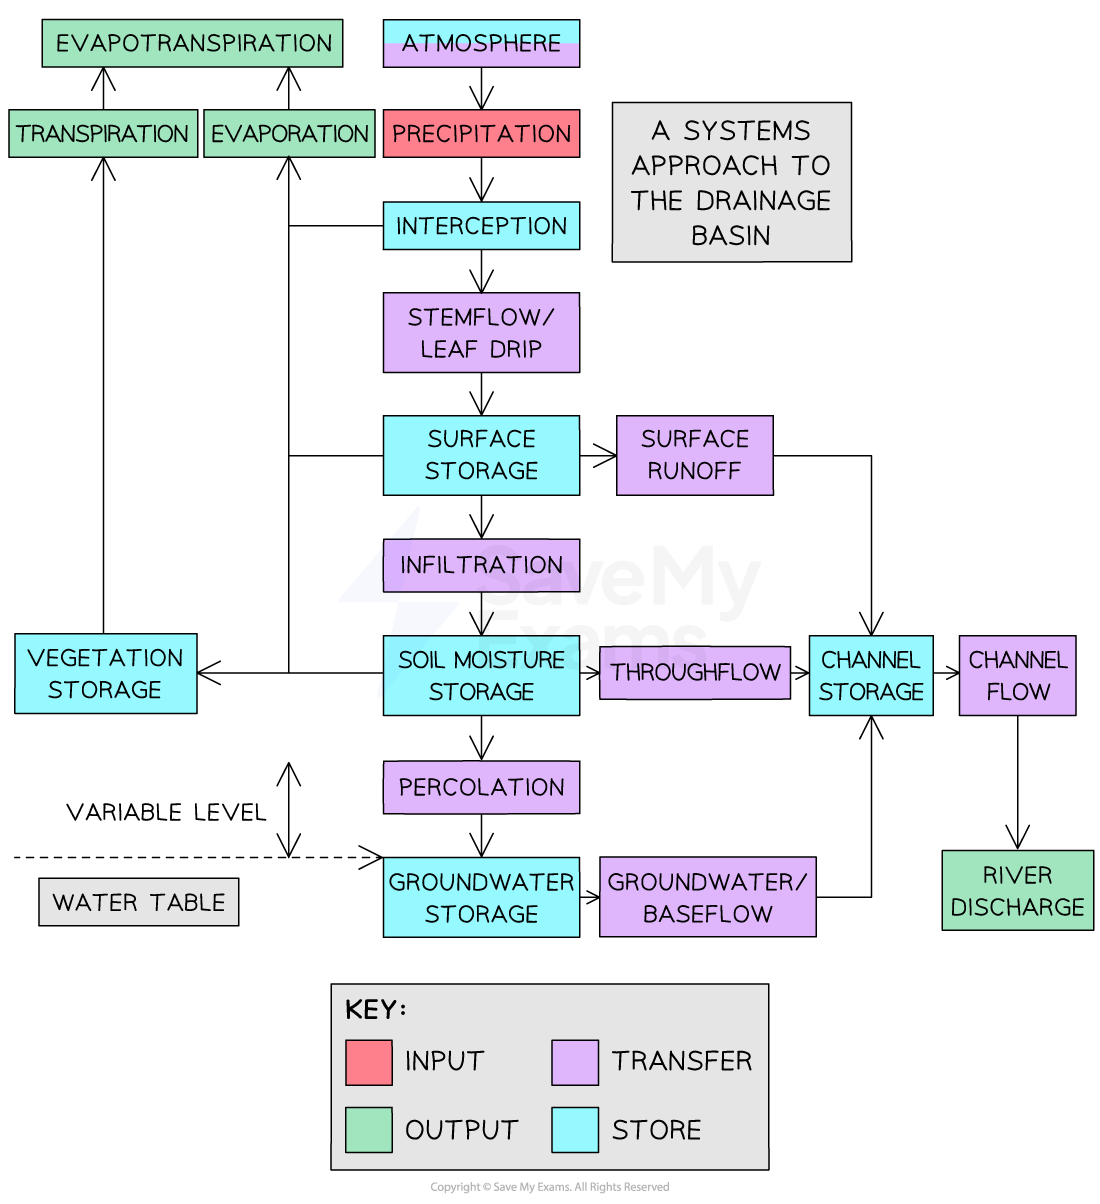
Suggest one way that vegetation affects the movement of water through the drainage basin.
Was this exam question helpful?
Study Figure 1, which shows the storm hydrographs of two neighbouring rivers responding to the same rainfall event.
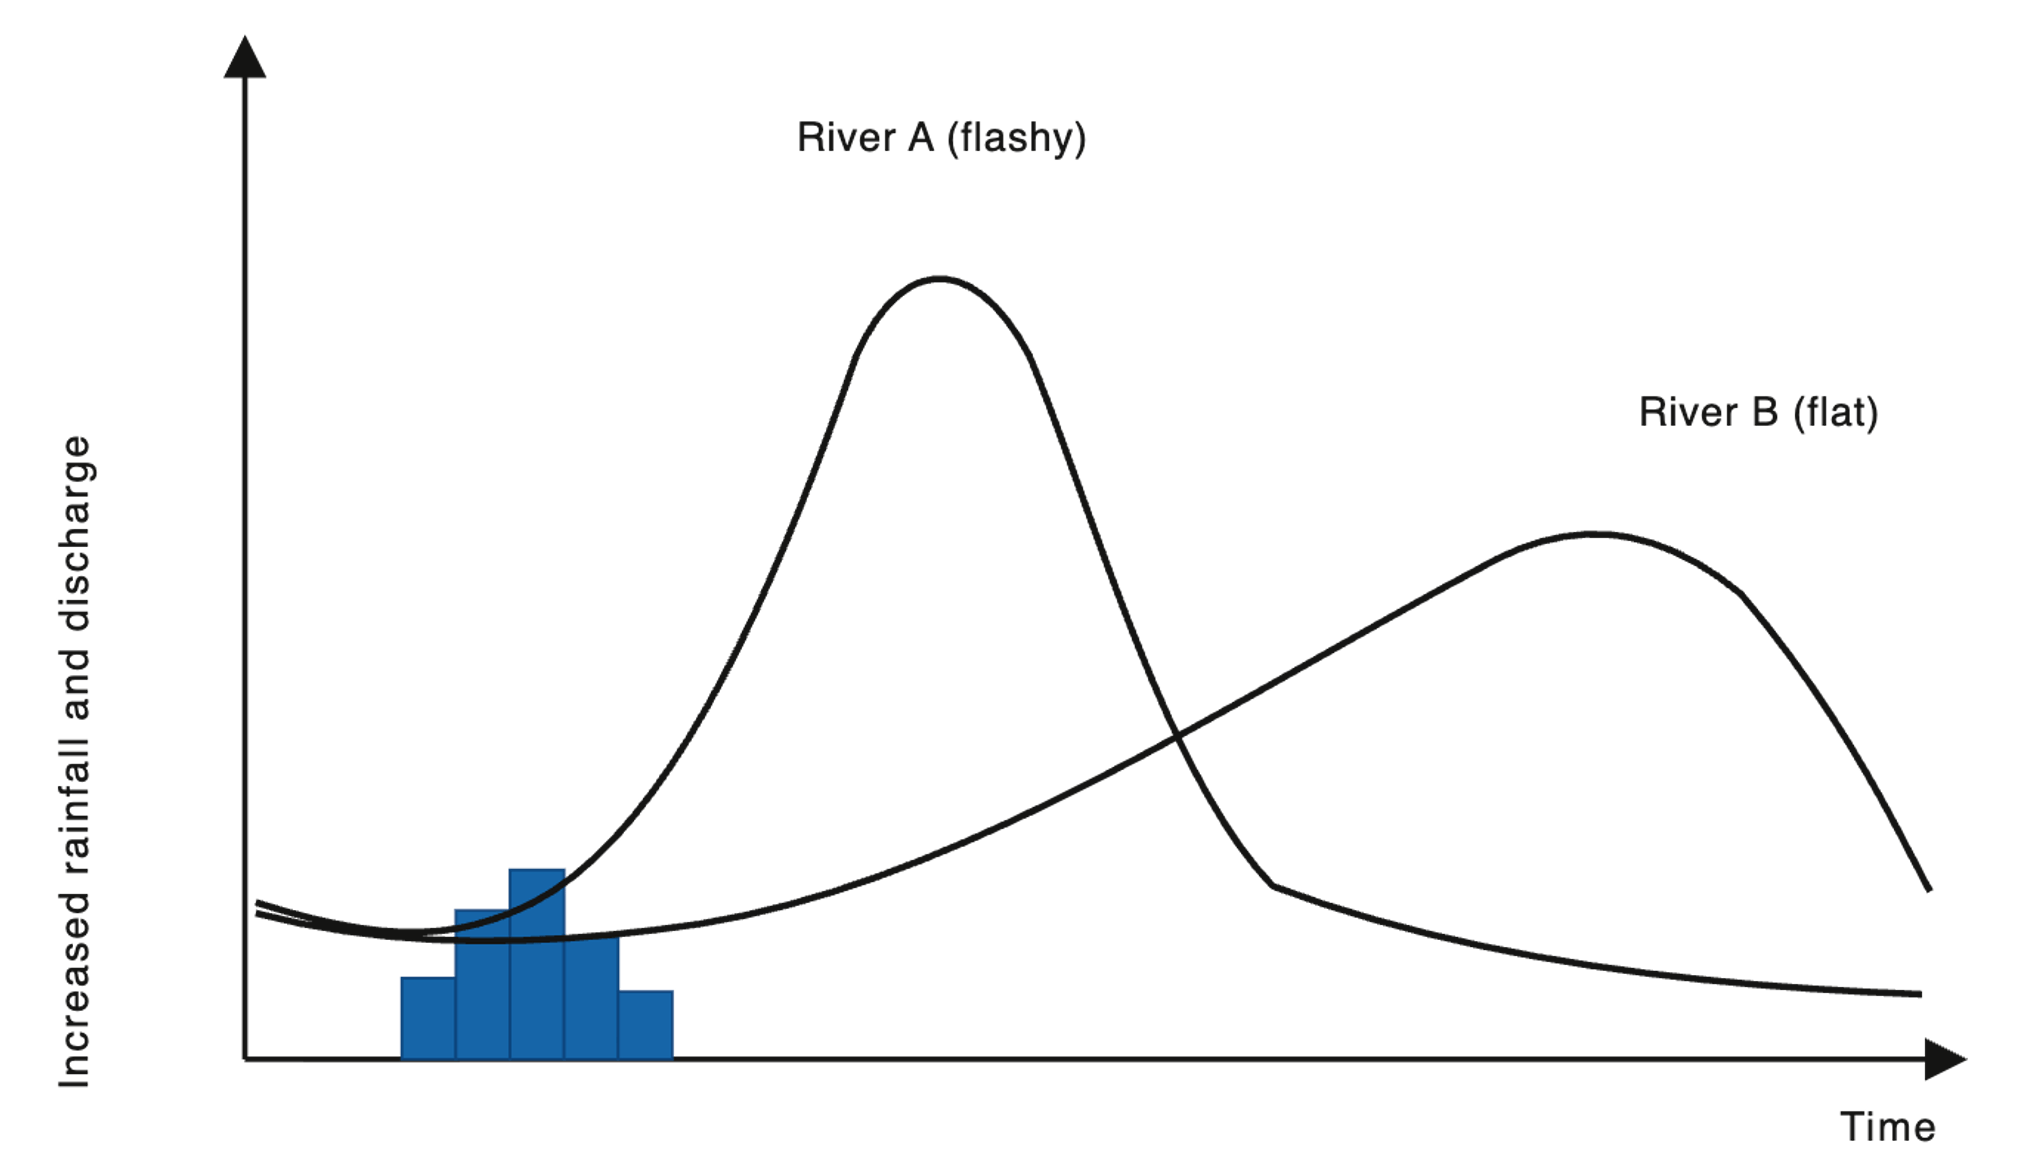
Suggest one reason why River A has a flashier hydrograph than River B.
Was this exam question helpful?
Explain how the physical features of a drainage basin affect the shape of storm hydrographs. You may draw a diagram to help your answer.
Was this exam question helpful?
Explain why river regimes might vary between basins .
Was this exam question helpful?
Explain how the global hydrological cycle operates as a closed system.
Was this exam question helpful?
Explain how water moves through a drainage basin by below-ground flows.
Was this exam question helpful?
Explain how physical factors can influence the water balance of a drainage basin.
Was this exam question helpful?
Explain why the shape of a storm hydrograph can vary between different drainage basins.
Was this exam question helpful?
Explain the role of energy in the operation of the global hydrological cycle.
Was this exam question helpful?
Explain why the regime of a river can vary over the course of a year.
Was this exam question helpful?
Study Figure 4b and 4c, which show two neighbouring upland river catchments and their hydrographs following a local storm event.
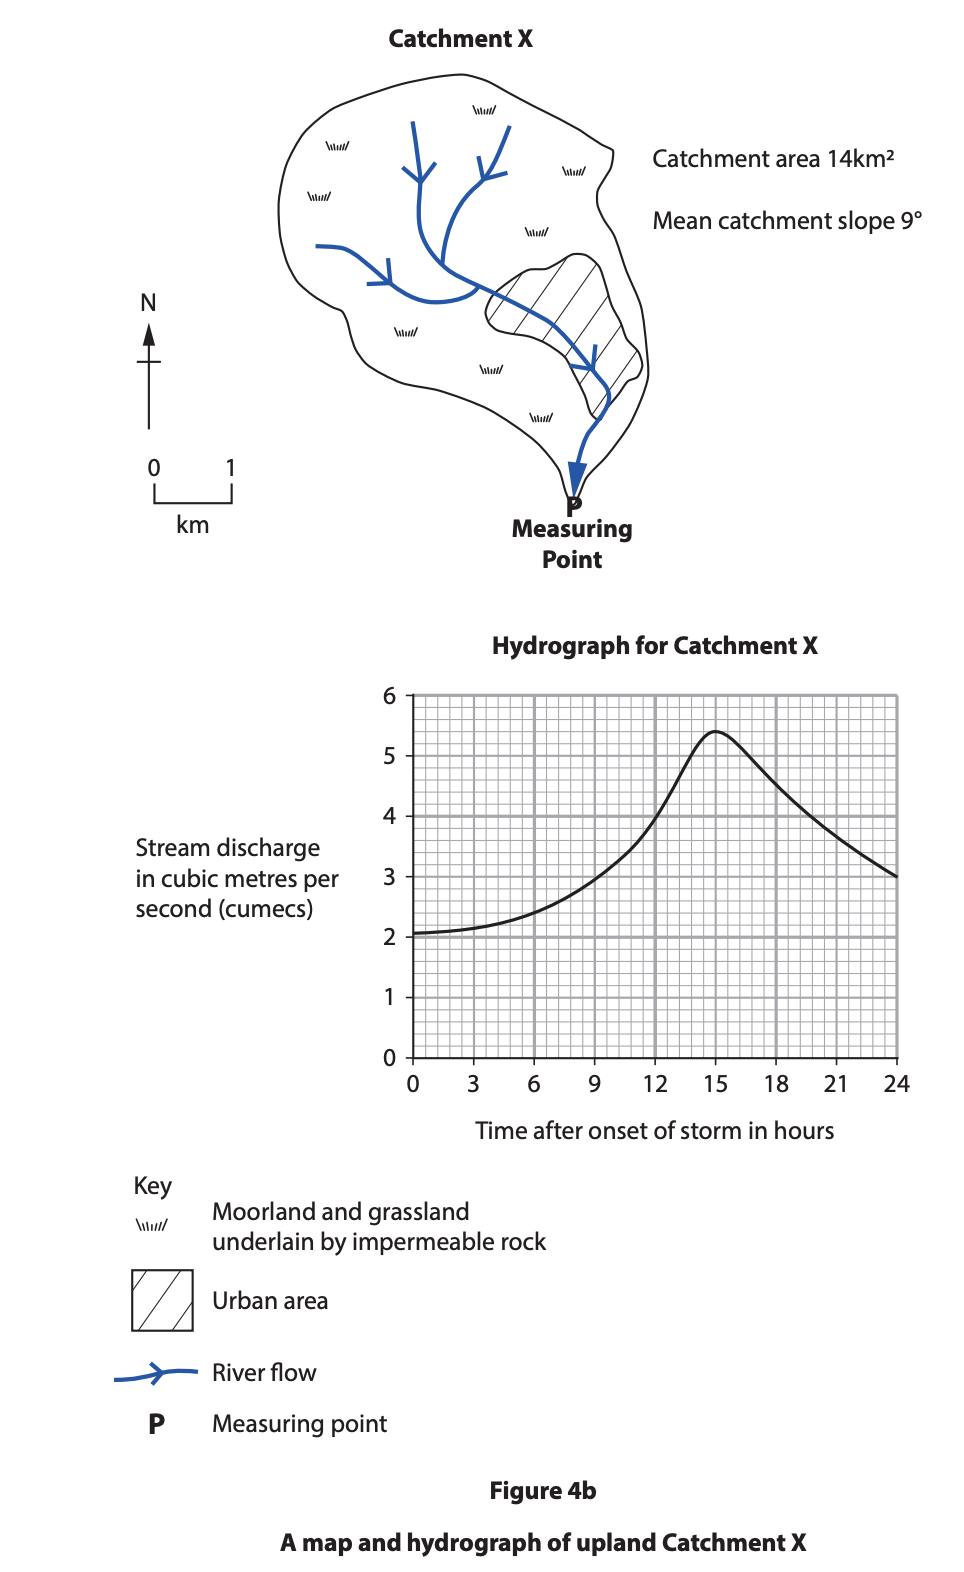
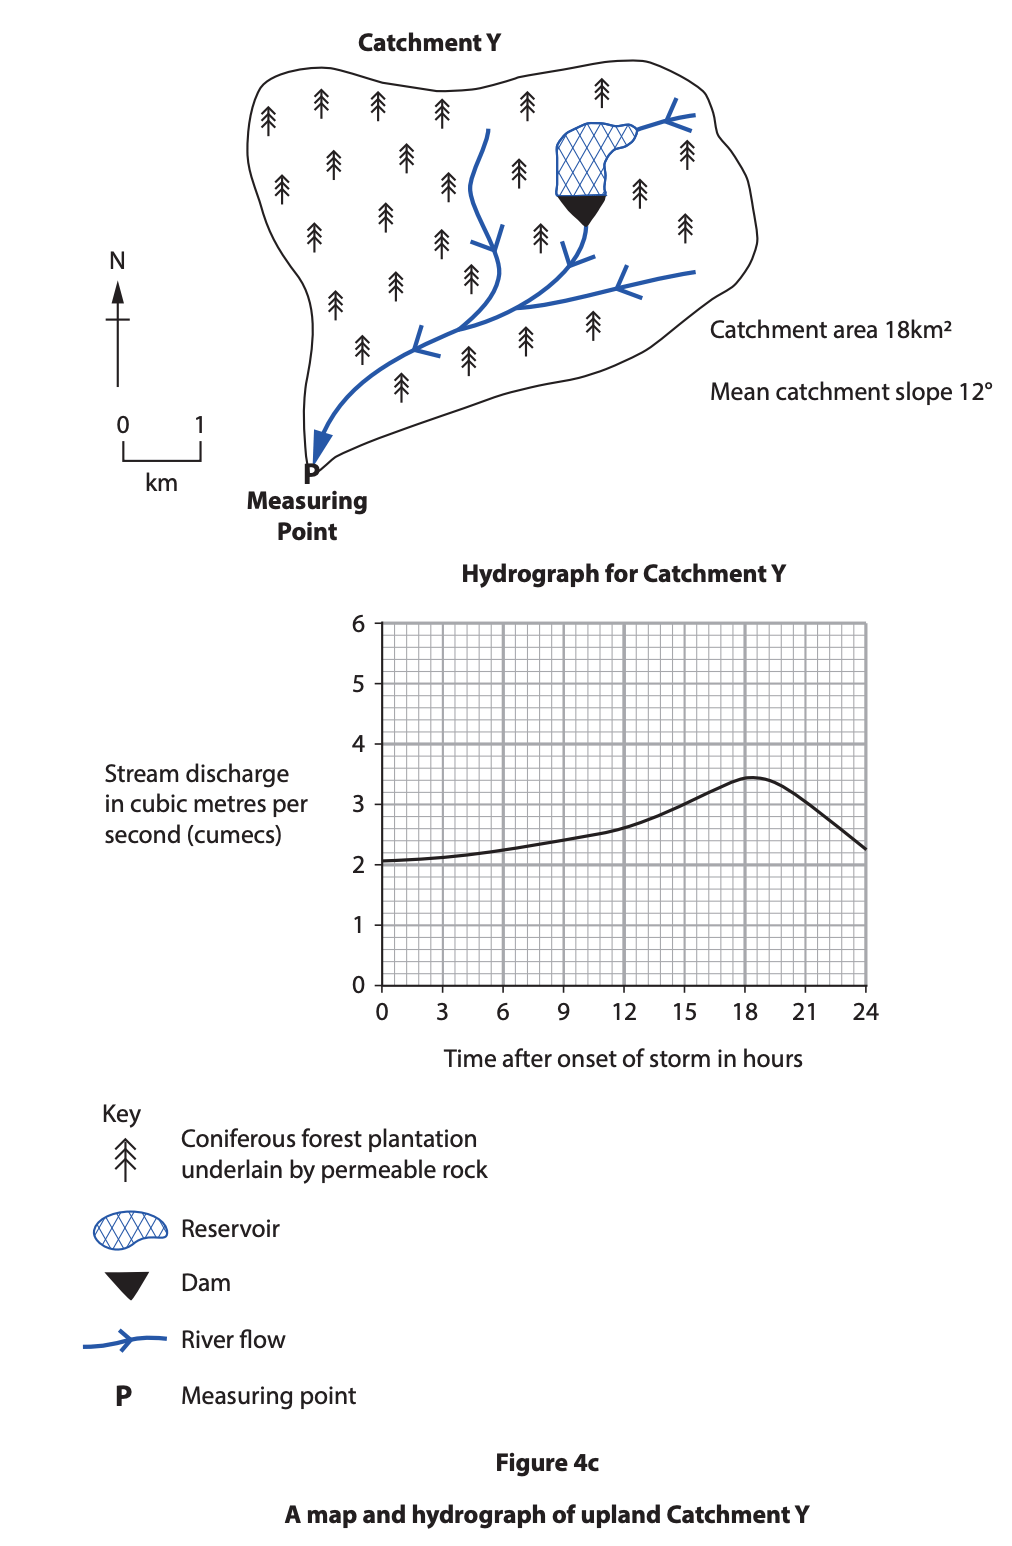
Assess the extent to which land use affects the shape of these storm hydrographs.
Was this exam question helpful?
Study Figure 1, which shows storm hydrographs for two neighbouring catchments of similar size and geology following the same storm.
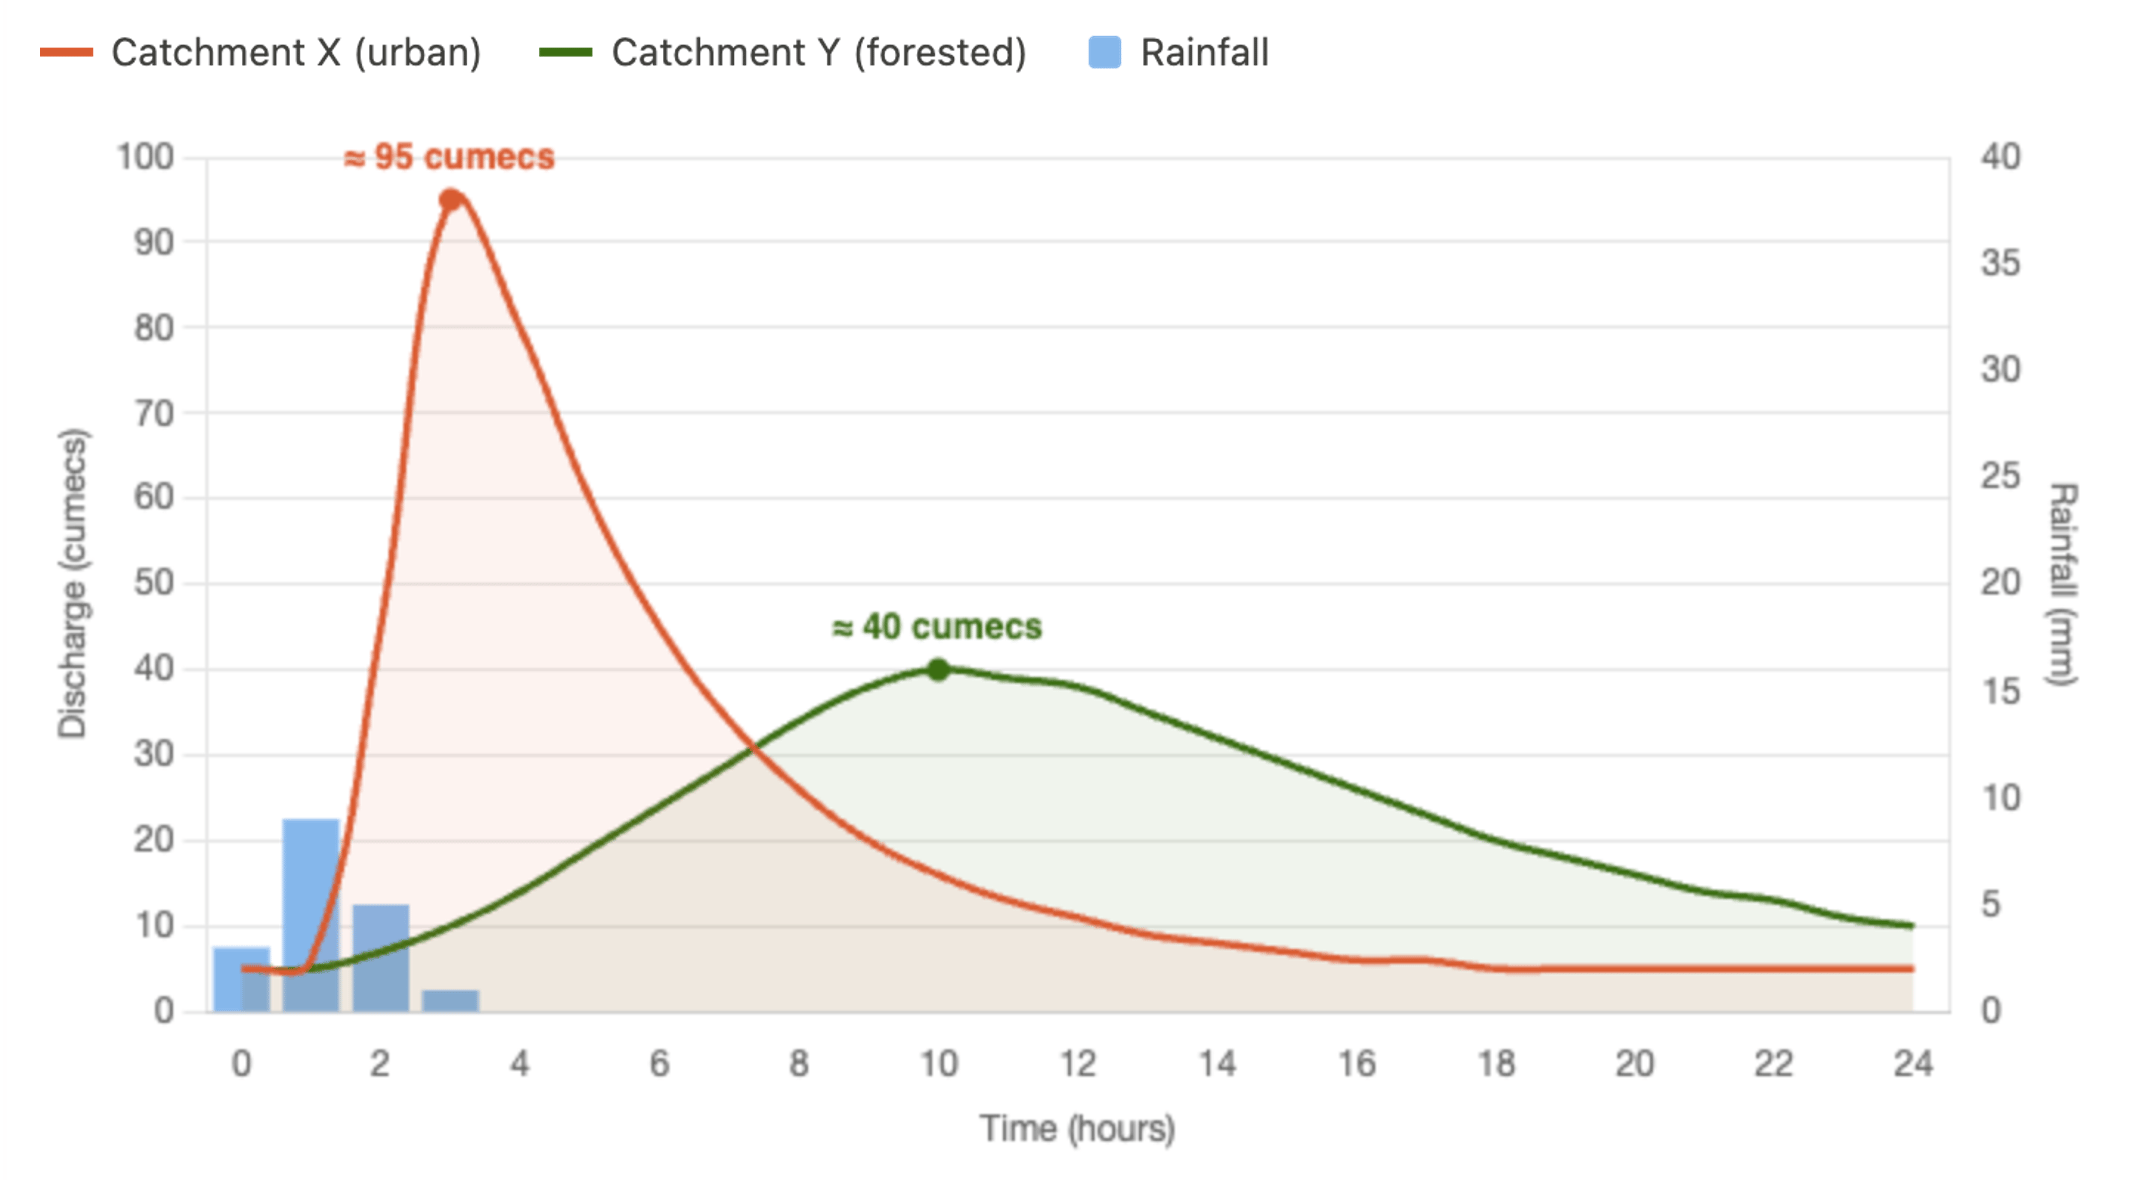
Assess the extent to which land use is responsible for the difference in the hydrographs shown.
Was this exam question helpful?
Evaluate the view that human activity, rather than physical factors, has the greatest influence on the flows within a drainage basin.
Was this exam question helpful?