16 marks
Study Figure 3a

Figure 3a
An estimate of change in sea level over the last 140,000 years
Explain how changes in sea level have produced different coastlines.
(6)
Was this exam question helpful?
Exam code: 9GE0
Study Figure 3a
Figure 3a
An estimate of change in sea level over the last 140,000 years
Explain how changes in sea level have produced different coastlines.
(6)
Was this exam question helpful?
Study Figure 3a

Figure 3a
Current rate of relative land and sea level change in the British Isles in mm per year
Explain the role of isostatic processes in causing changes in relative sea level.
(6)
Was this exam question helpful?
Study Figure 3a.
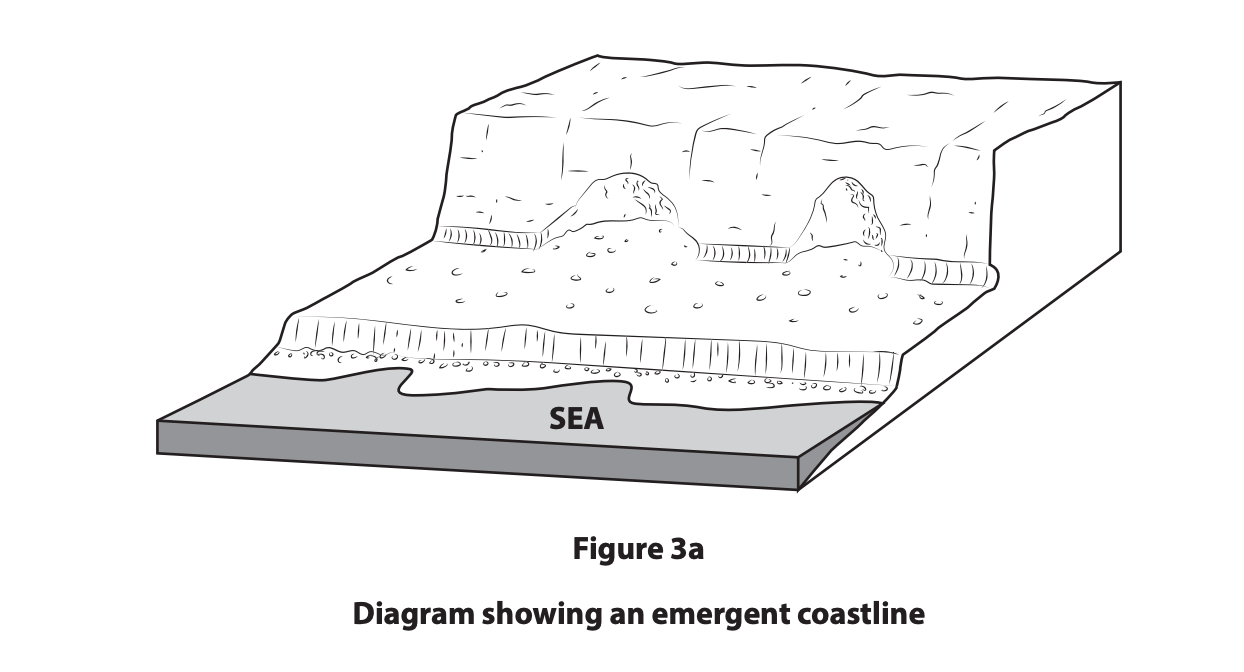
Explain how sea level change contributes to the formation of emergent coastlines.
Was this exam question helpful?
Explain the role of sea level change in the formation of both emergent and submergent coastlines.
Was this exam question helpful?
Study Figure 3b.
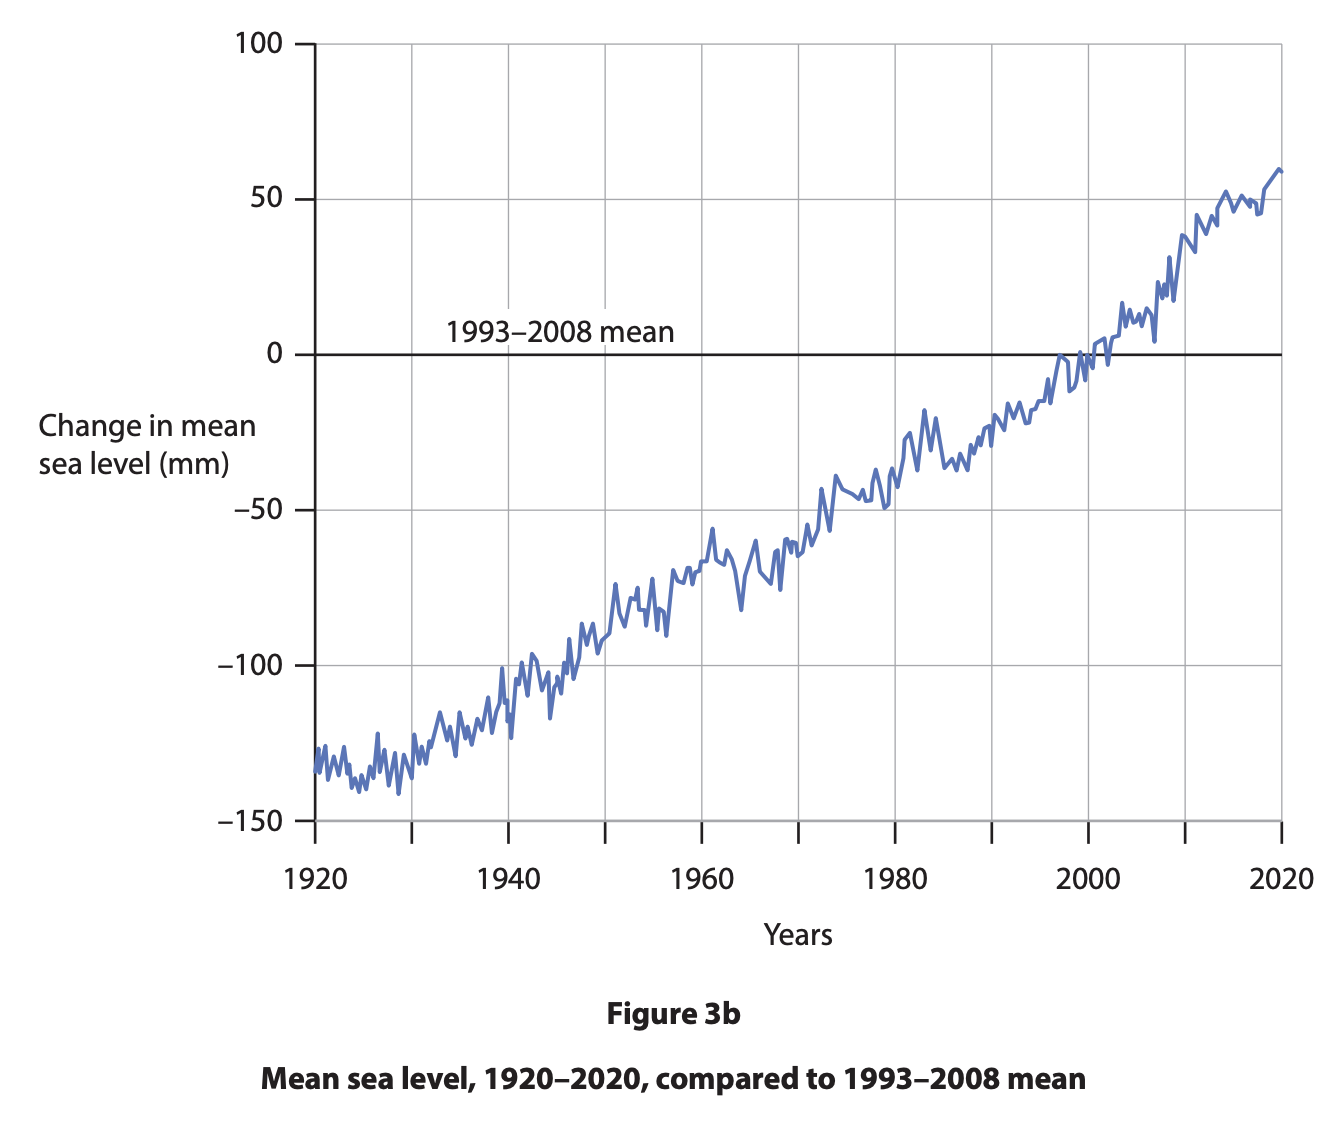
Explain the role of global warming in changing mean sea level since 1920.
Was this exam question helpful?
Study Figure 1.
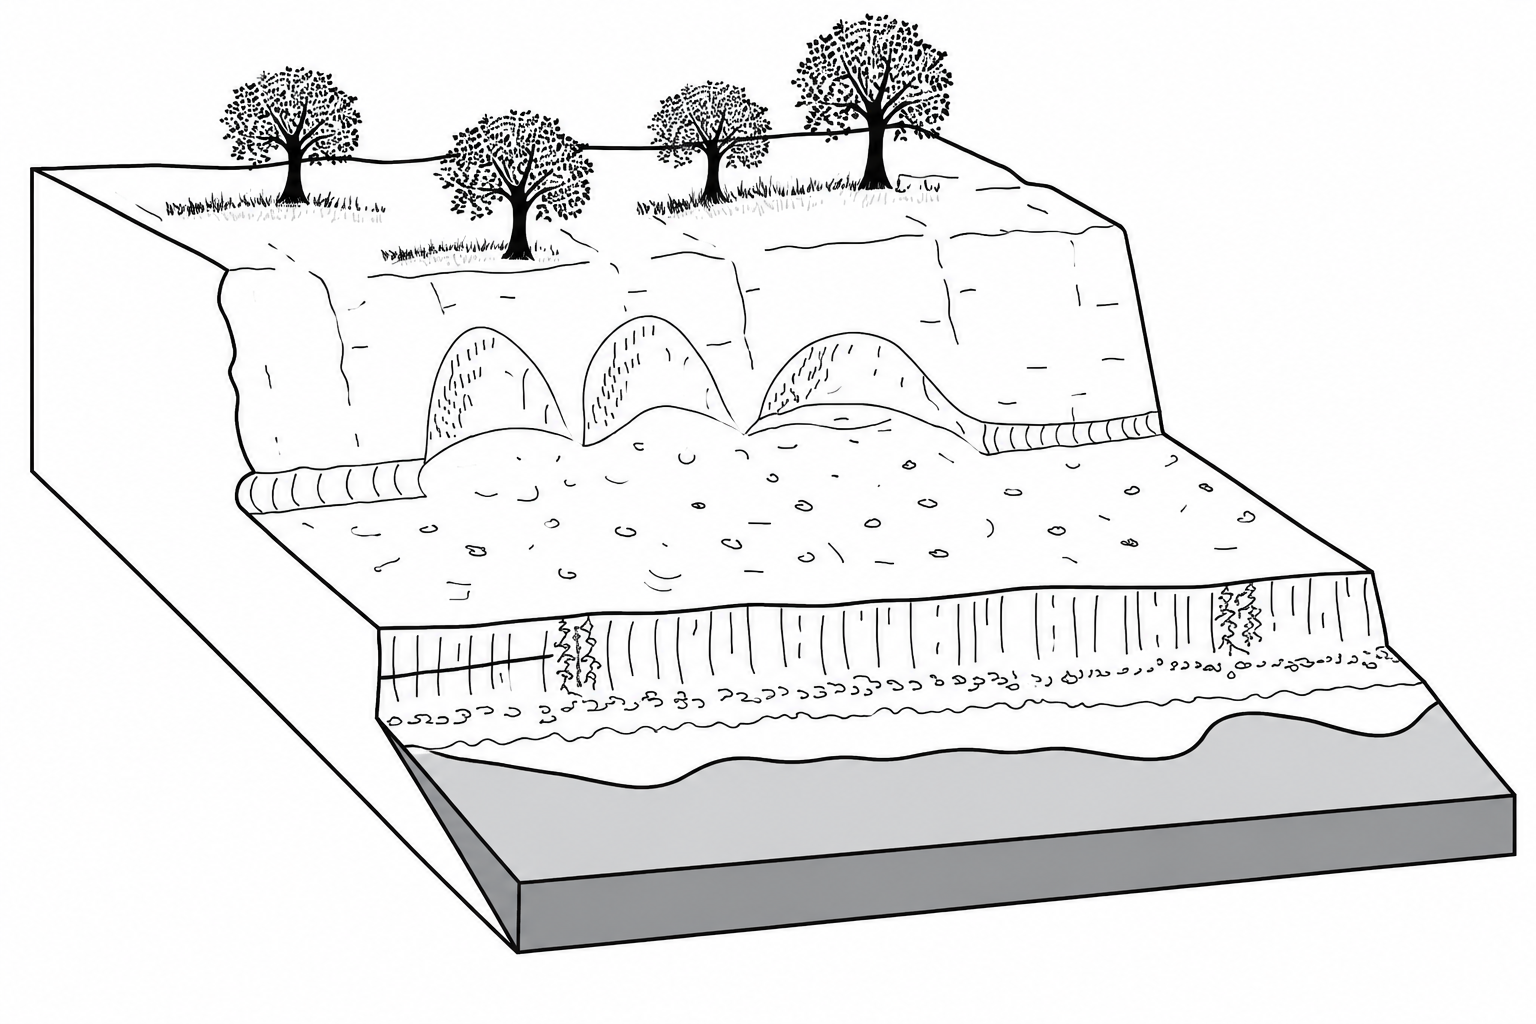
Explain how sea level change has contributed to the formation of the emergent landform shown.
Was this exam question helpful?
Study Figure 1.
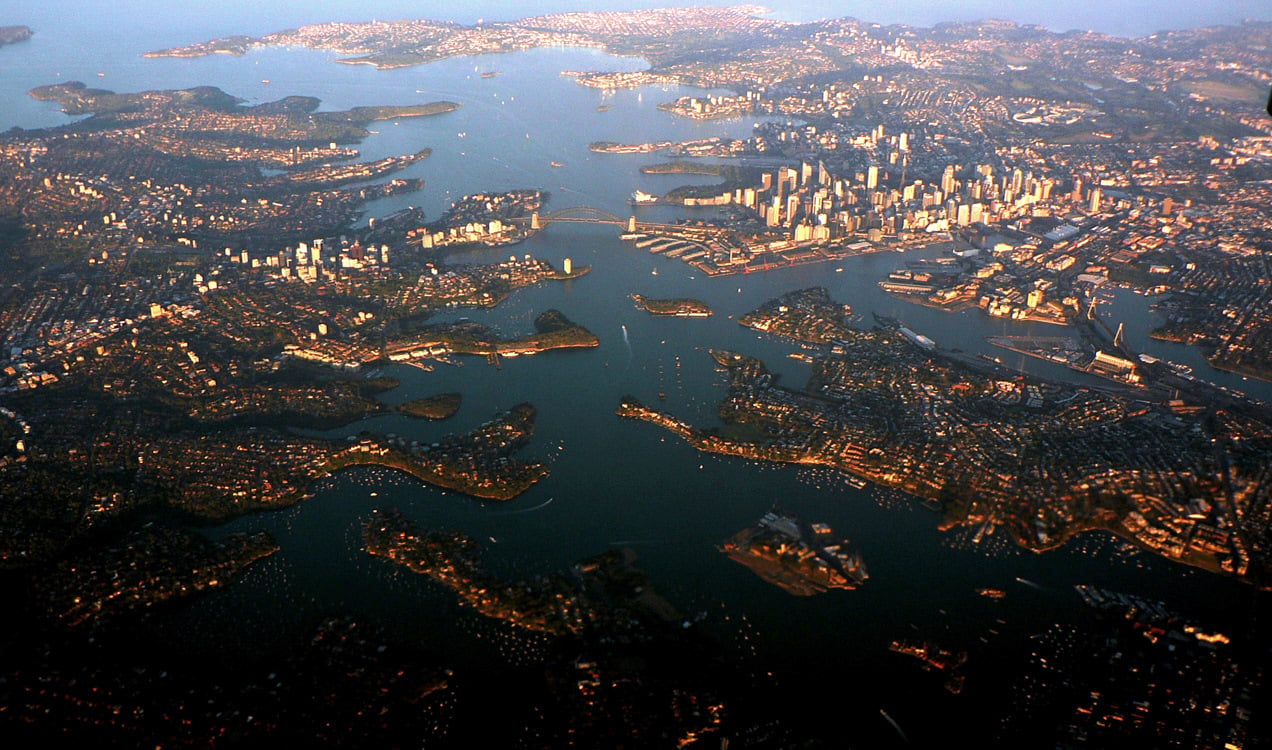
Explain how a rise in sea level produced the submergent coastline shown.
Was this exam question helpful?
Study Figure 1.
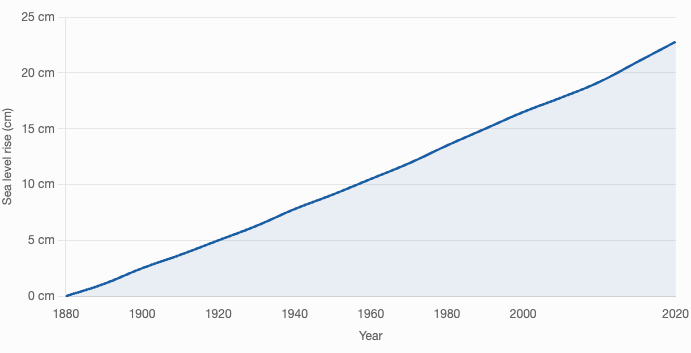
Explain the role of global warming in changing mean sea level since 1900.
Was this exam question helpful?
Study Figure 1.
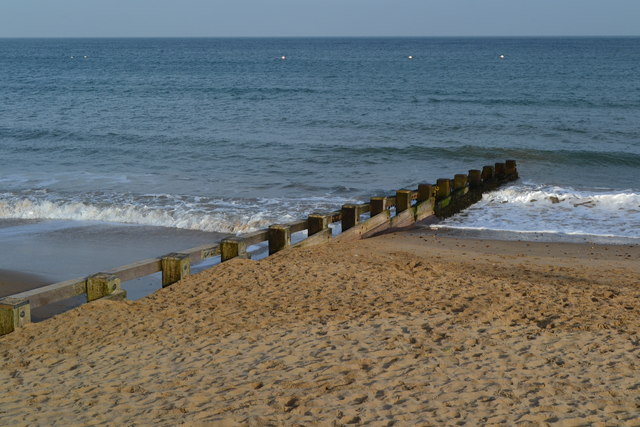
Explain how the human actions shown can increase the rate of coastal recession further along the coast.
Was this exam question helpful?
Study Figure 1.
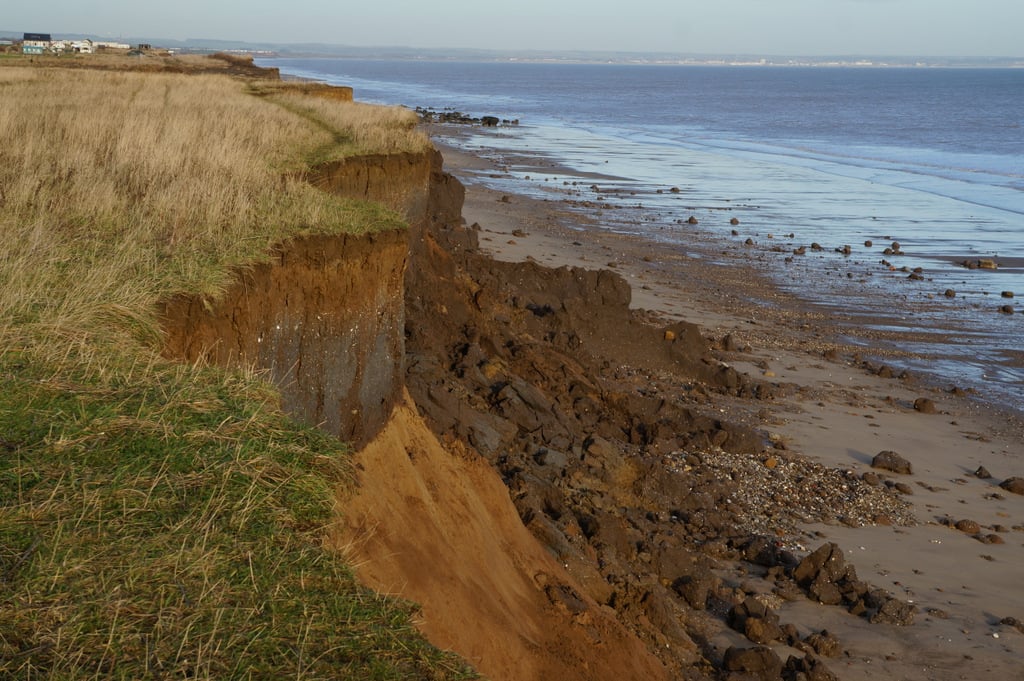
Explain how subaerial processes contribute to the rapid recession of the cliff shown.
Was this exam question helpful?
Evaluate the view that coastal flood risks are increasing mainly because of rising sea levels.
Was this exam question helpful?
Evaluate the contribution that changes in sea level make to the formation of coastal landscapes.
Was this exam question helpful?
Evaluate the view that rising sea level is the most important factor increasing the risk of coastal flooding.
Was this exam question helpful?