1
3 marks
Study Figure 1

Figure 1
Licences issued for oil and gas exploration by ‘fracking’ in 2017
Suggest one reason why economic regeneration is needed in some places more than others.
Was this exam question helpful?
Exam code: 9GE0
Study Figure 1
Figure 1
Licences issued for oil and gas exploration by ‘fracking’ in 2017
Suggest one reason why economic regeneration is needed in some places more than others.
Was this exam question helpful?
Study Figure 2 in the resource booklet (opens in a new tab)

Figure 2
Blog about the regeneration of Hull, through its year as City of Culture 2017
Suggest one way the writer of the blog presents a negative view of this attempt at regeneration.
Was this exam question helpful?
Study Figure 1a.
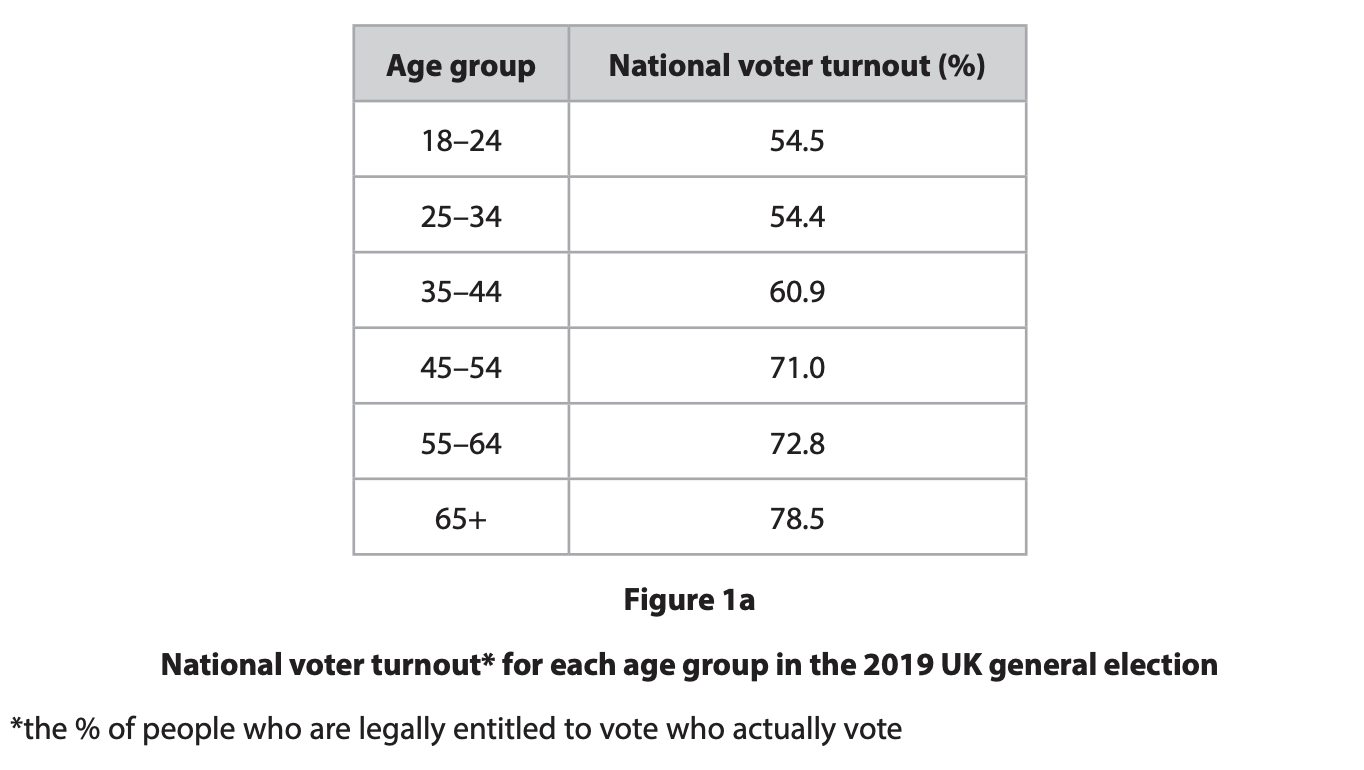
Suggest one reason why some age groups are more likely to vote than others.
Was this exam question helpful?
Study Figure 1.
Suggest one reason why economic regeneration is needed in some places more than others.
Was this exam question helpful?
Study Figure 1.
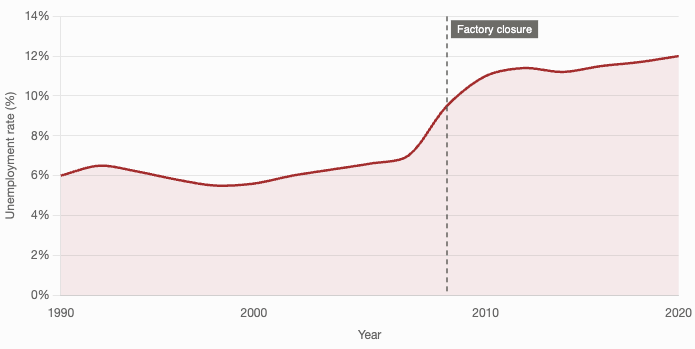
Suggest one reason why unemployment has risen over time in this former industrial area.
Was this exam question helpful?
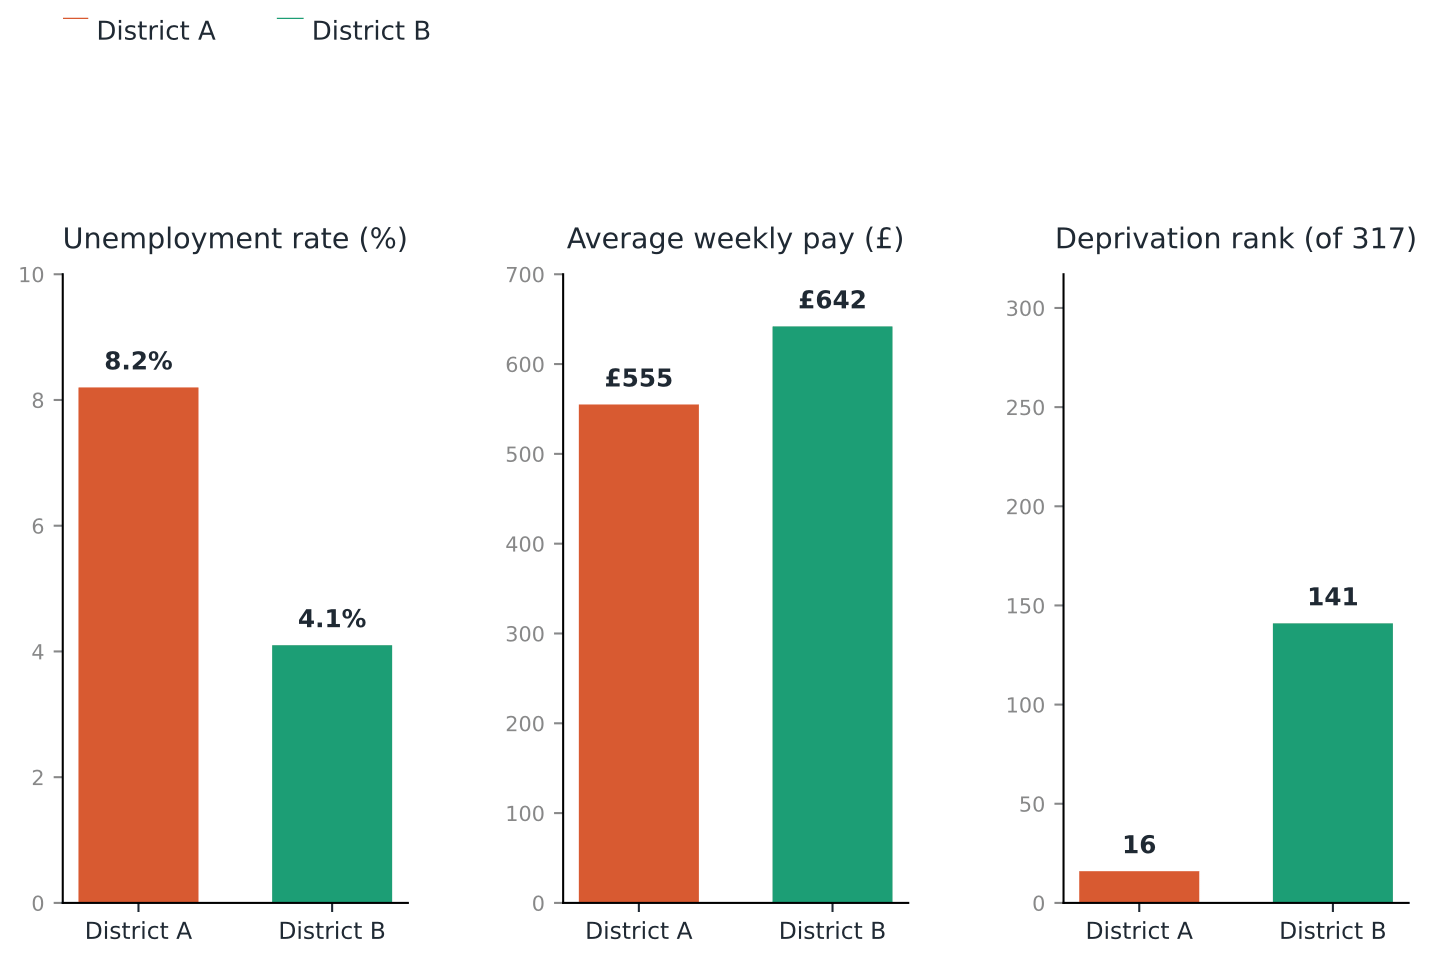
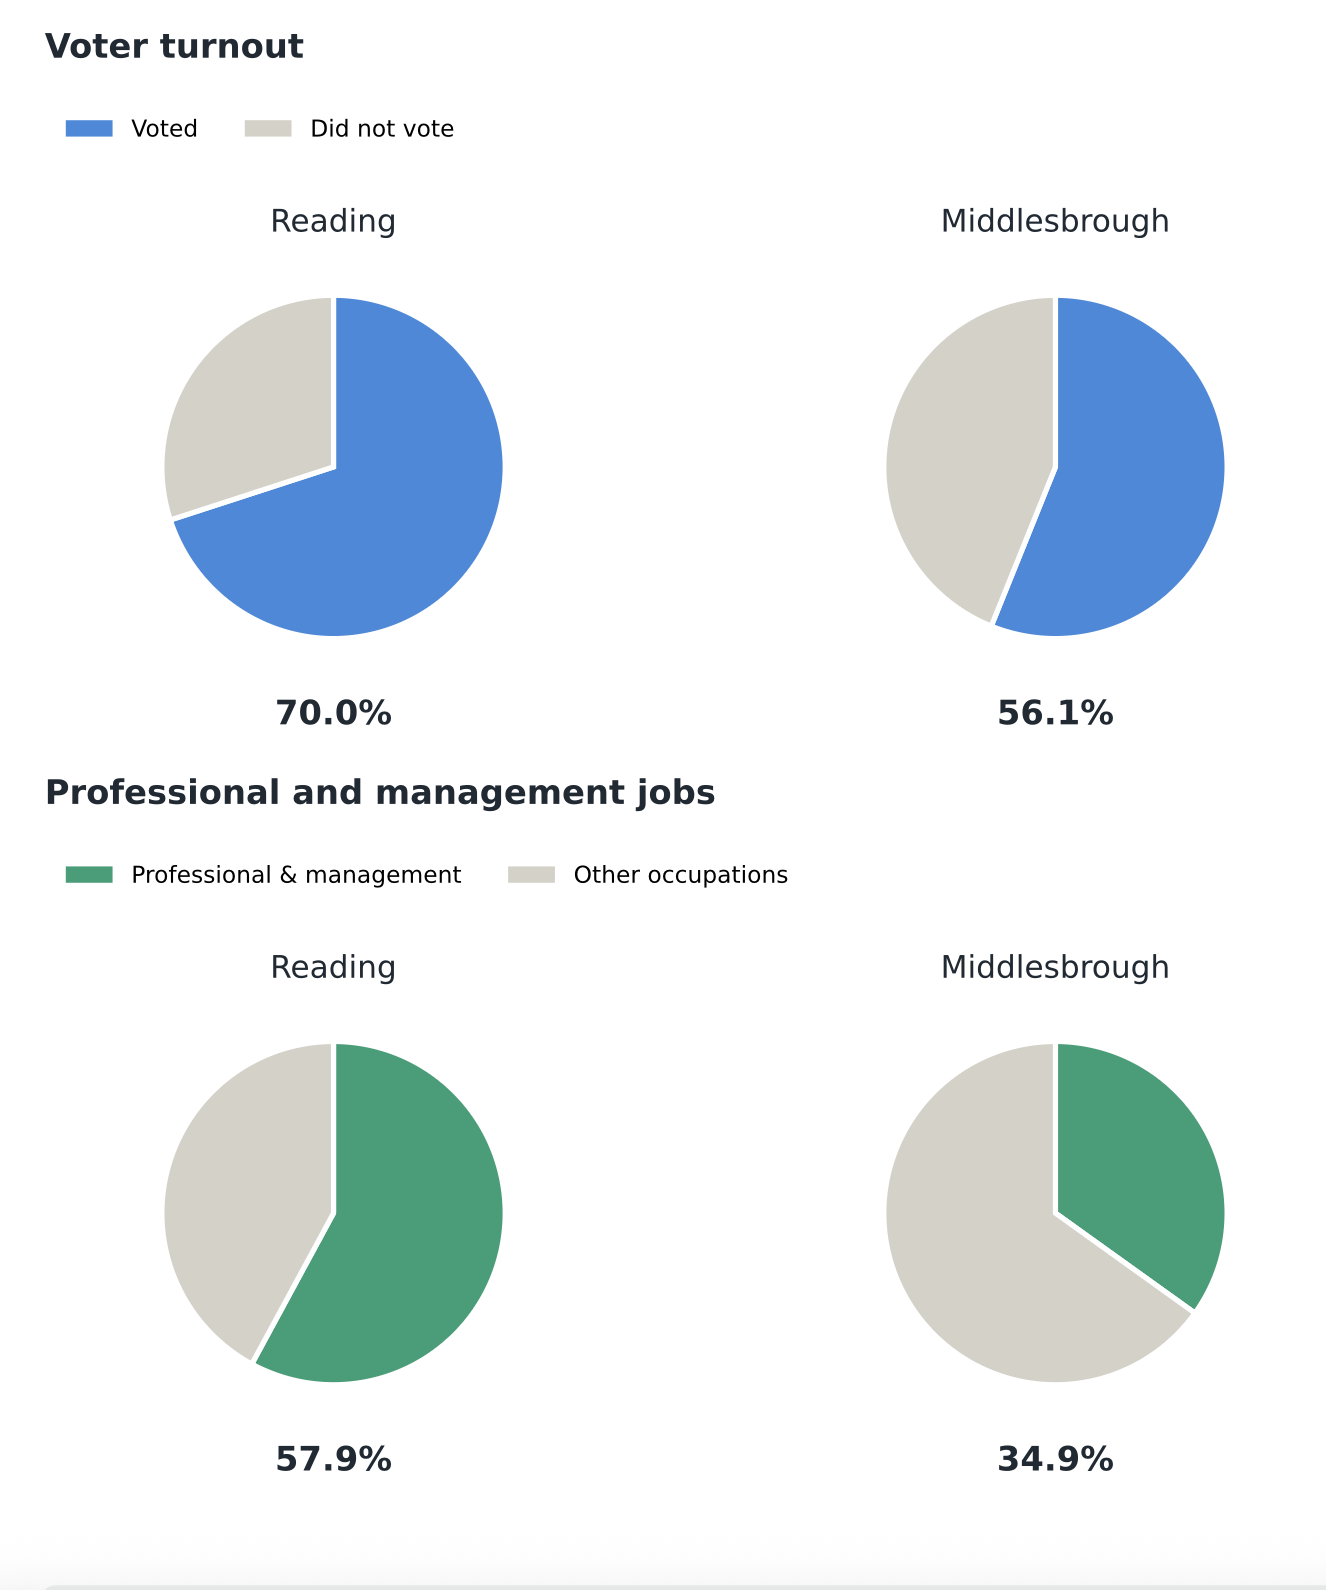
Study Figure 1.
Suggest one reason why election turnout differs between the two places shown.
Was this exam question helpful?
Study Figure 1.
Figure 1: Selected data for Detroit, USA
Measure | Value |
|---|---|
Population change, 1970-2015 | fell from 1.5 million to 680,000 |
Poverty rate (2014) | 38% |
Vacant houses (2015) | about 30,000 |
Abandoned buildings (2015) | about 70,000 |
Suggest one way the data shows that this place is experiencing a spiral of decline.
Was this exam question helpful?
Study Figure 1.
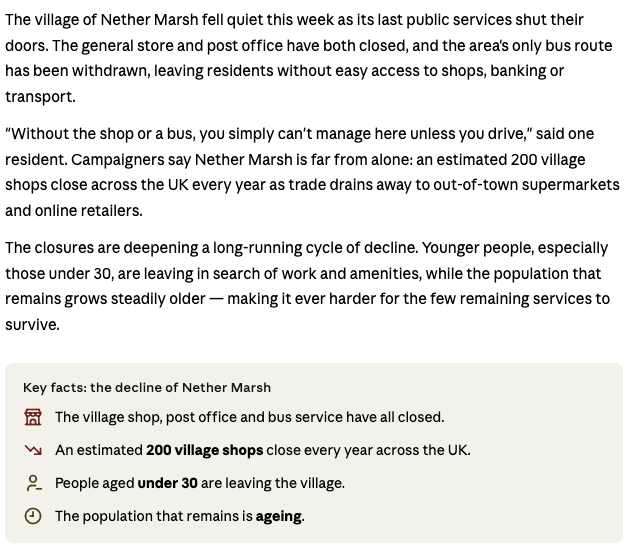
Suggest one reason why some rural areas need regeneration.
Was this exam question helpful?
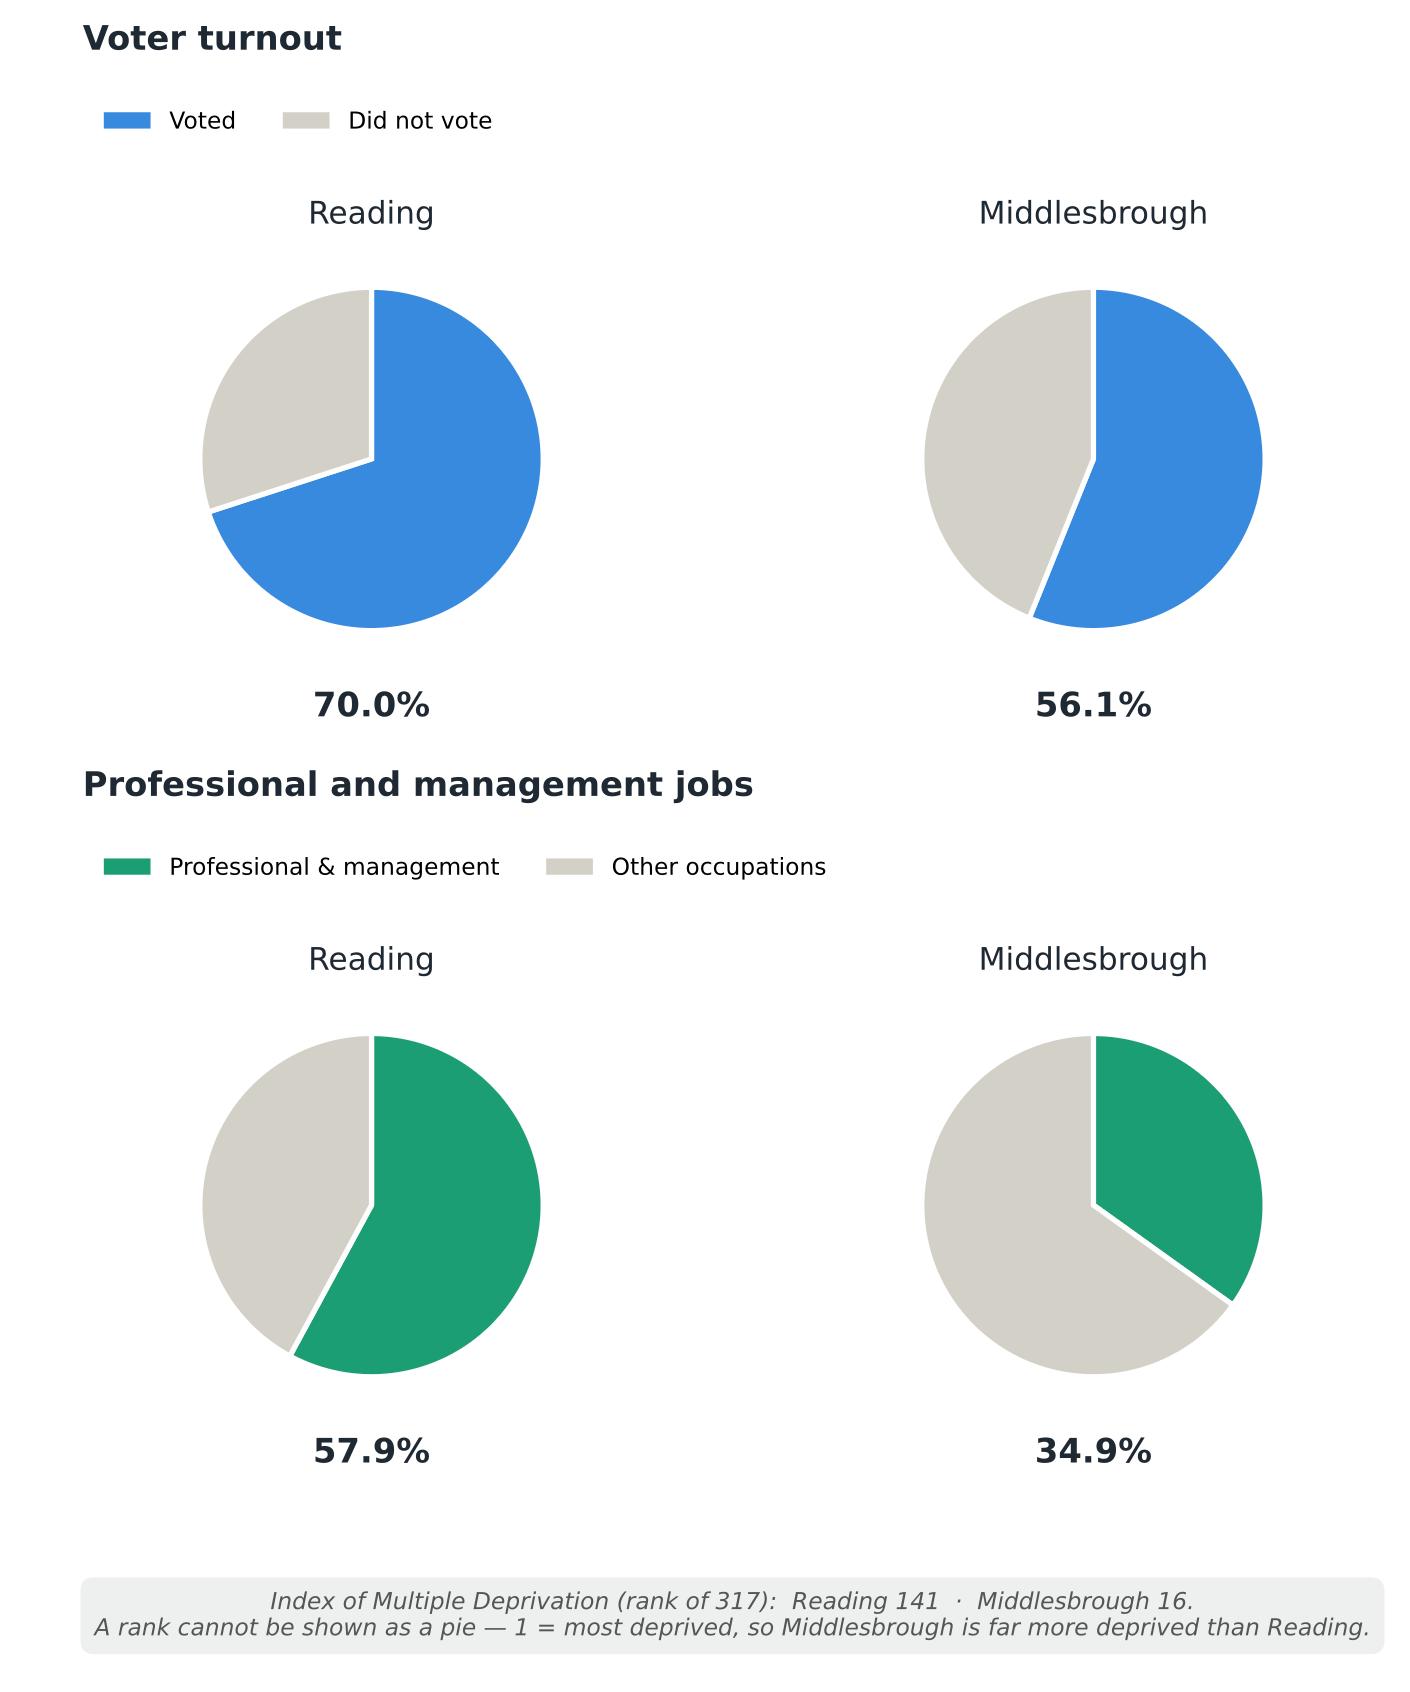
Study Figure 1b.
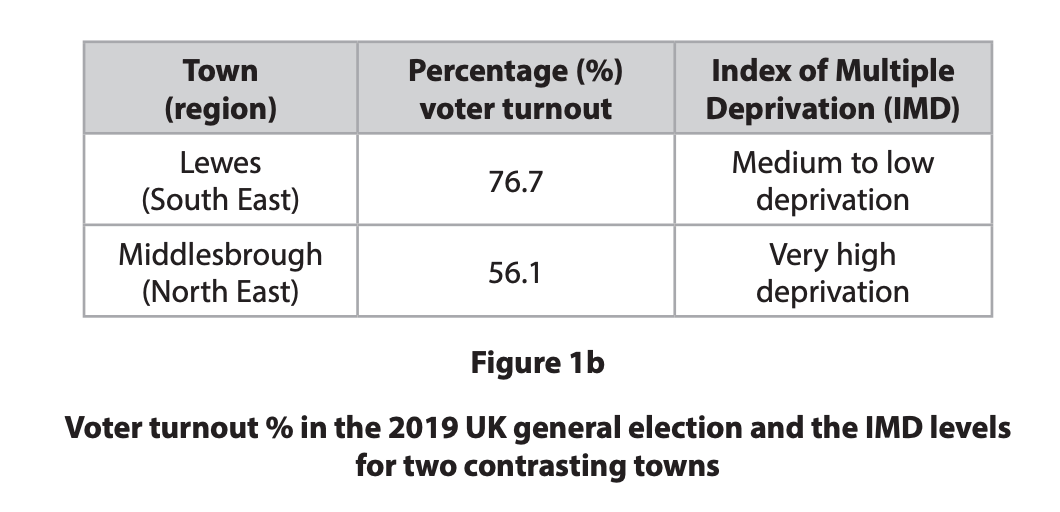
Voter turnout is one measure of political engagement.
Suggest why levels of deprivation may affect political engagement in these towns.
Was this exam question helpful?
With reference to a named example, explain why some places experience a spiral of decline.
Was this exam question helpful?
Study Figure 1.
Figure 1: Inequality within one UK city (Reading)
Measure | Most deprived areas vs least deprived areas |
|---|---|
Male life expectancy | 6.8 years lower |
Female life expectancy | 7.8 years lower |
Reading is also the 3rd most unequal 'city' in the UK by wealth (Gini coefficient, 2017).
Suggest why the need for regeneration may vary within a single city.
Was this exam question helpful?
With reference to a named example, explain why the lived experience of a place varies between different groups of people.
Was this exam question helpful?
Study Figure 1.
Suggest why community engagement is lower in some places than in others.
Was this exam question helpful?
Evaluate the view that economic decline is the main reason why some places need regeneration.
Was this exam question helpful?
Evaluate the difficulties of assessing whether a place needs regeneration.
Was this exam question helpful?
Evaluate the reasons why regeneration is often controversial.
Was this exam question helpful?