Glacial Processes (Edexcel A Level Geography): Exam Questions

Exam code: 9GE0

2 hours13 questions
1
Sme Calculator
6 marks

Study Figure 2a

fig-2a-qp-9geo-01-nov-2021-edexcel-a-level-geo

Figure 2a

Changing mass balance of the glacier (in metres of water equivalent) of the South Cascade Glacier in North America since 1956

Explain how changes in the mass balance of the glacier will affect the hydrological cycle.

(6)

2
Sme Calculator
6 marks

Study Figure 2b

fig-2b-qp-9geo-01-june-2018-edexcel-a-level-geo

Figure 2b

Cross section showing the mass balance of a temperate glacier

Explain the processes that affect the mass balance of temperate glaciers.

3
Sme Calculator
8 marks

Explain how the glacial mass balance concept contributes to an understanding of glacial systems.

4
Sme Calculator
8 marks

Explain the importance of ice temperature in understanding the rate of glacial movement.

(8)

5
6 marks

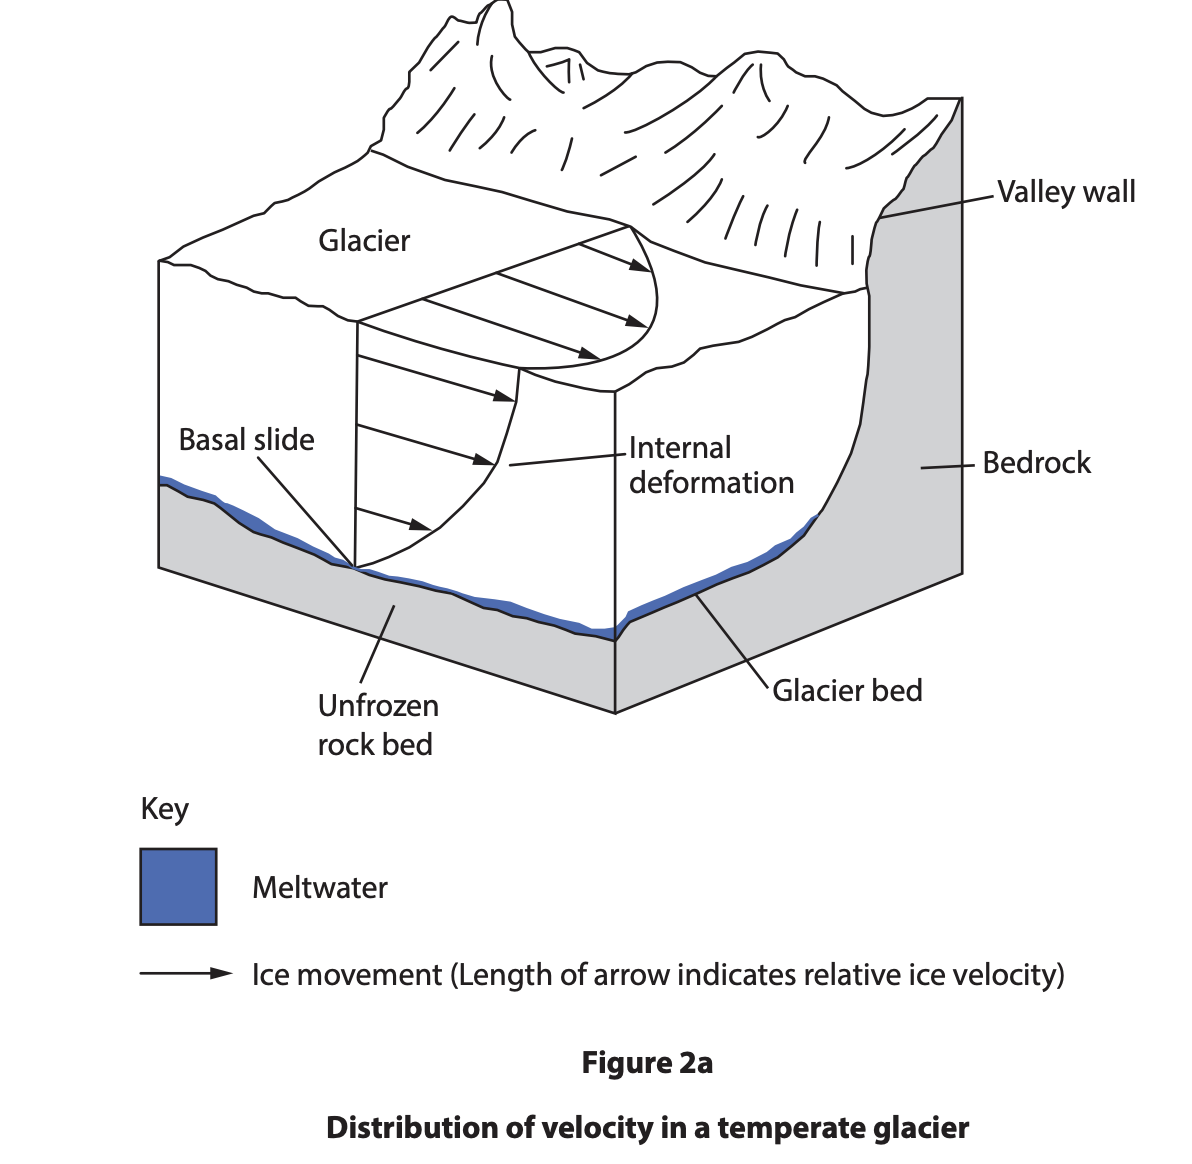
Study Figure 2a.

Diagram of a temperate glacier showing basal sliding, internal deformation, meltwater on an unfrozen rock bed, and velocity arrows within a U-shaped valley

Explain the contribution of meltwater to the movement of temperate glaciers.

6
6 marks

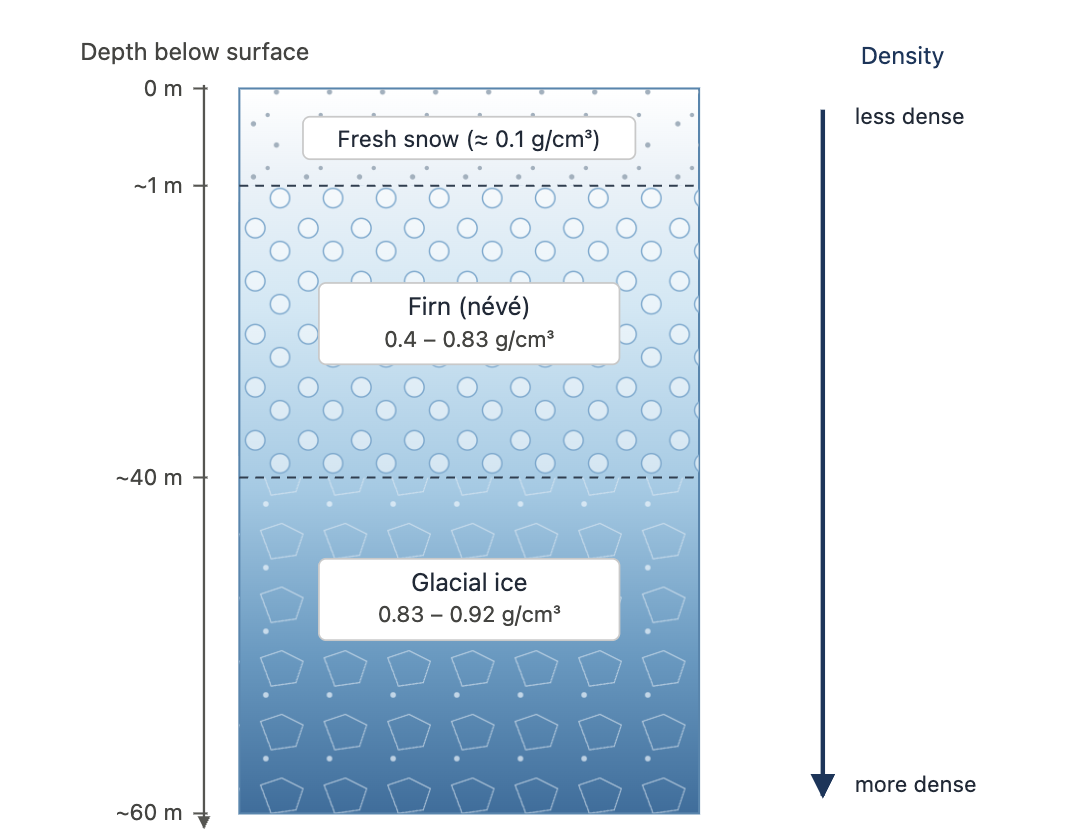
Study Figure 1.

Diagram of snowpack layers with depth and density: fresh snow, firn (névé), and glacial ice from surface to 60 m, showing increasing density with depth
Figure 1 - Glacial ice formation

Explain how the glacial ice shown forms from snow.

7
6 marks

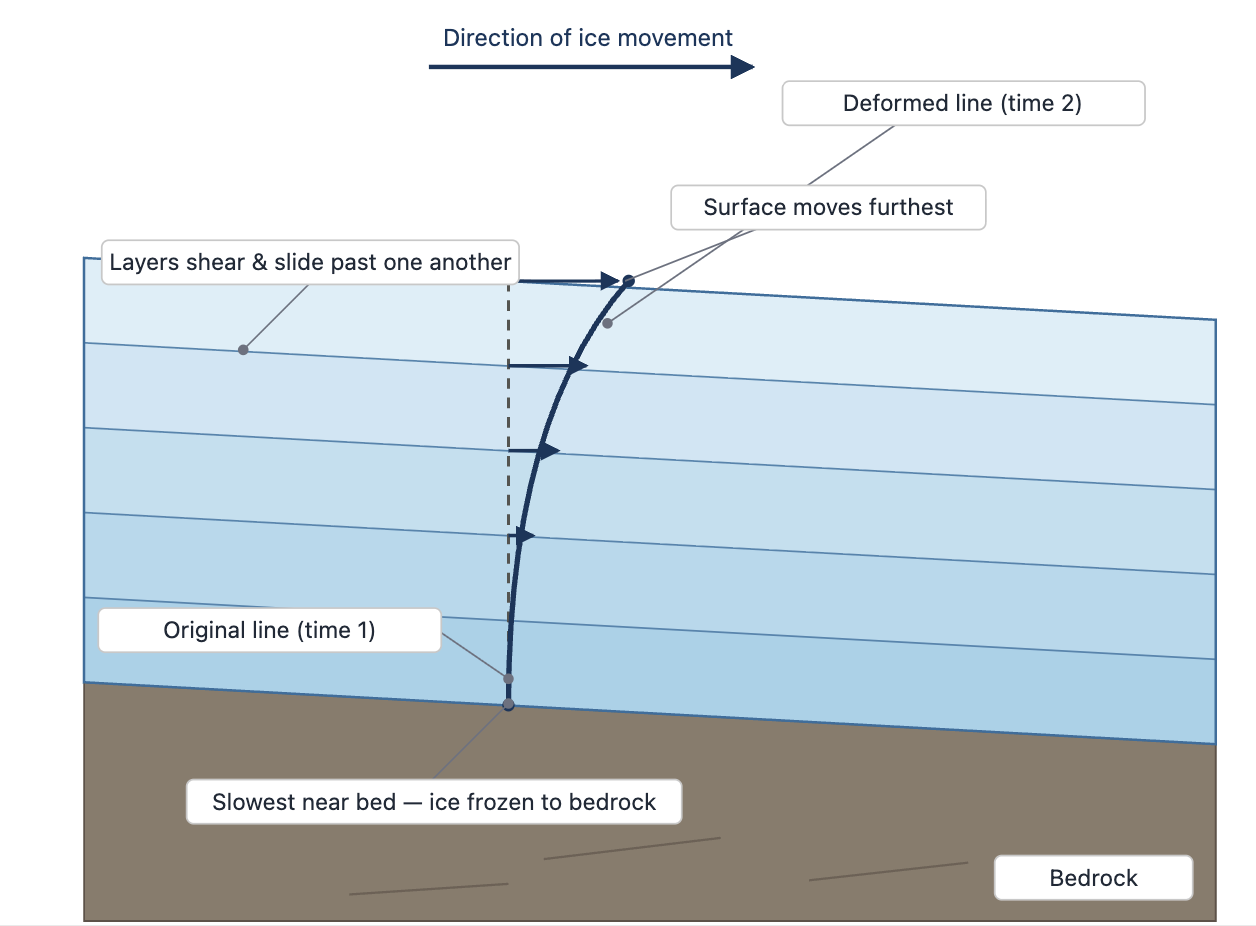
Study Figure 1.

Diagram of glacier cross-section showing ice layers shearing, surface ice moving fastest, base ice frozen to bedrock, and a vertical line bending with flow
Figure 1

Explain how the glacier shown moves downslope.

8
6 marks

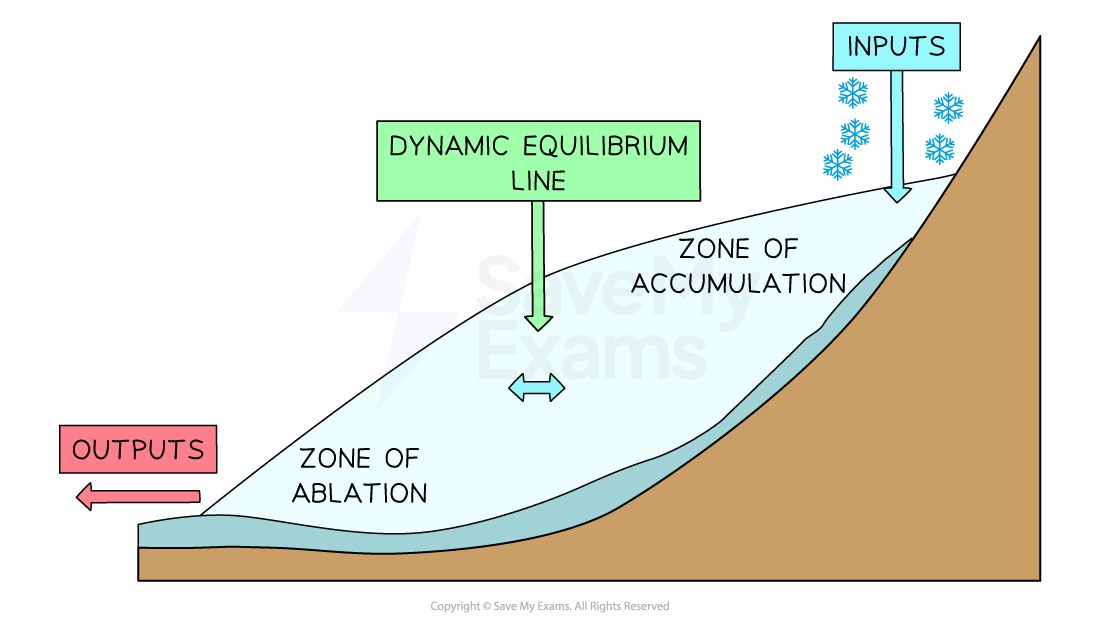
Study Figure 1.

Diagram of a glacier on a slope showing zone of accumulation, zone of ablation, inputs, outputs and the dynamic equilibrium line between them
Figure 1 - Glacial Budget

Explain how the glacial budget shown affects the position of the glacier front.

9
6 marks

Study Figure 1.

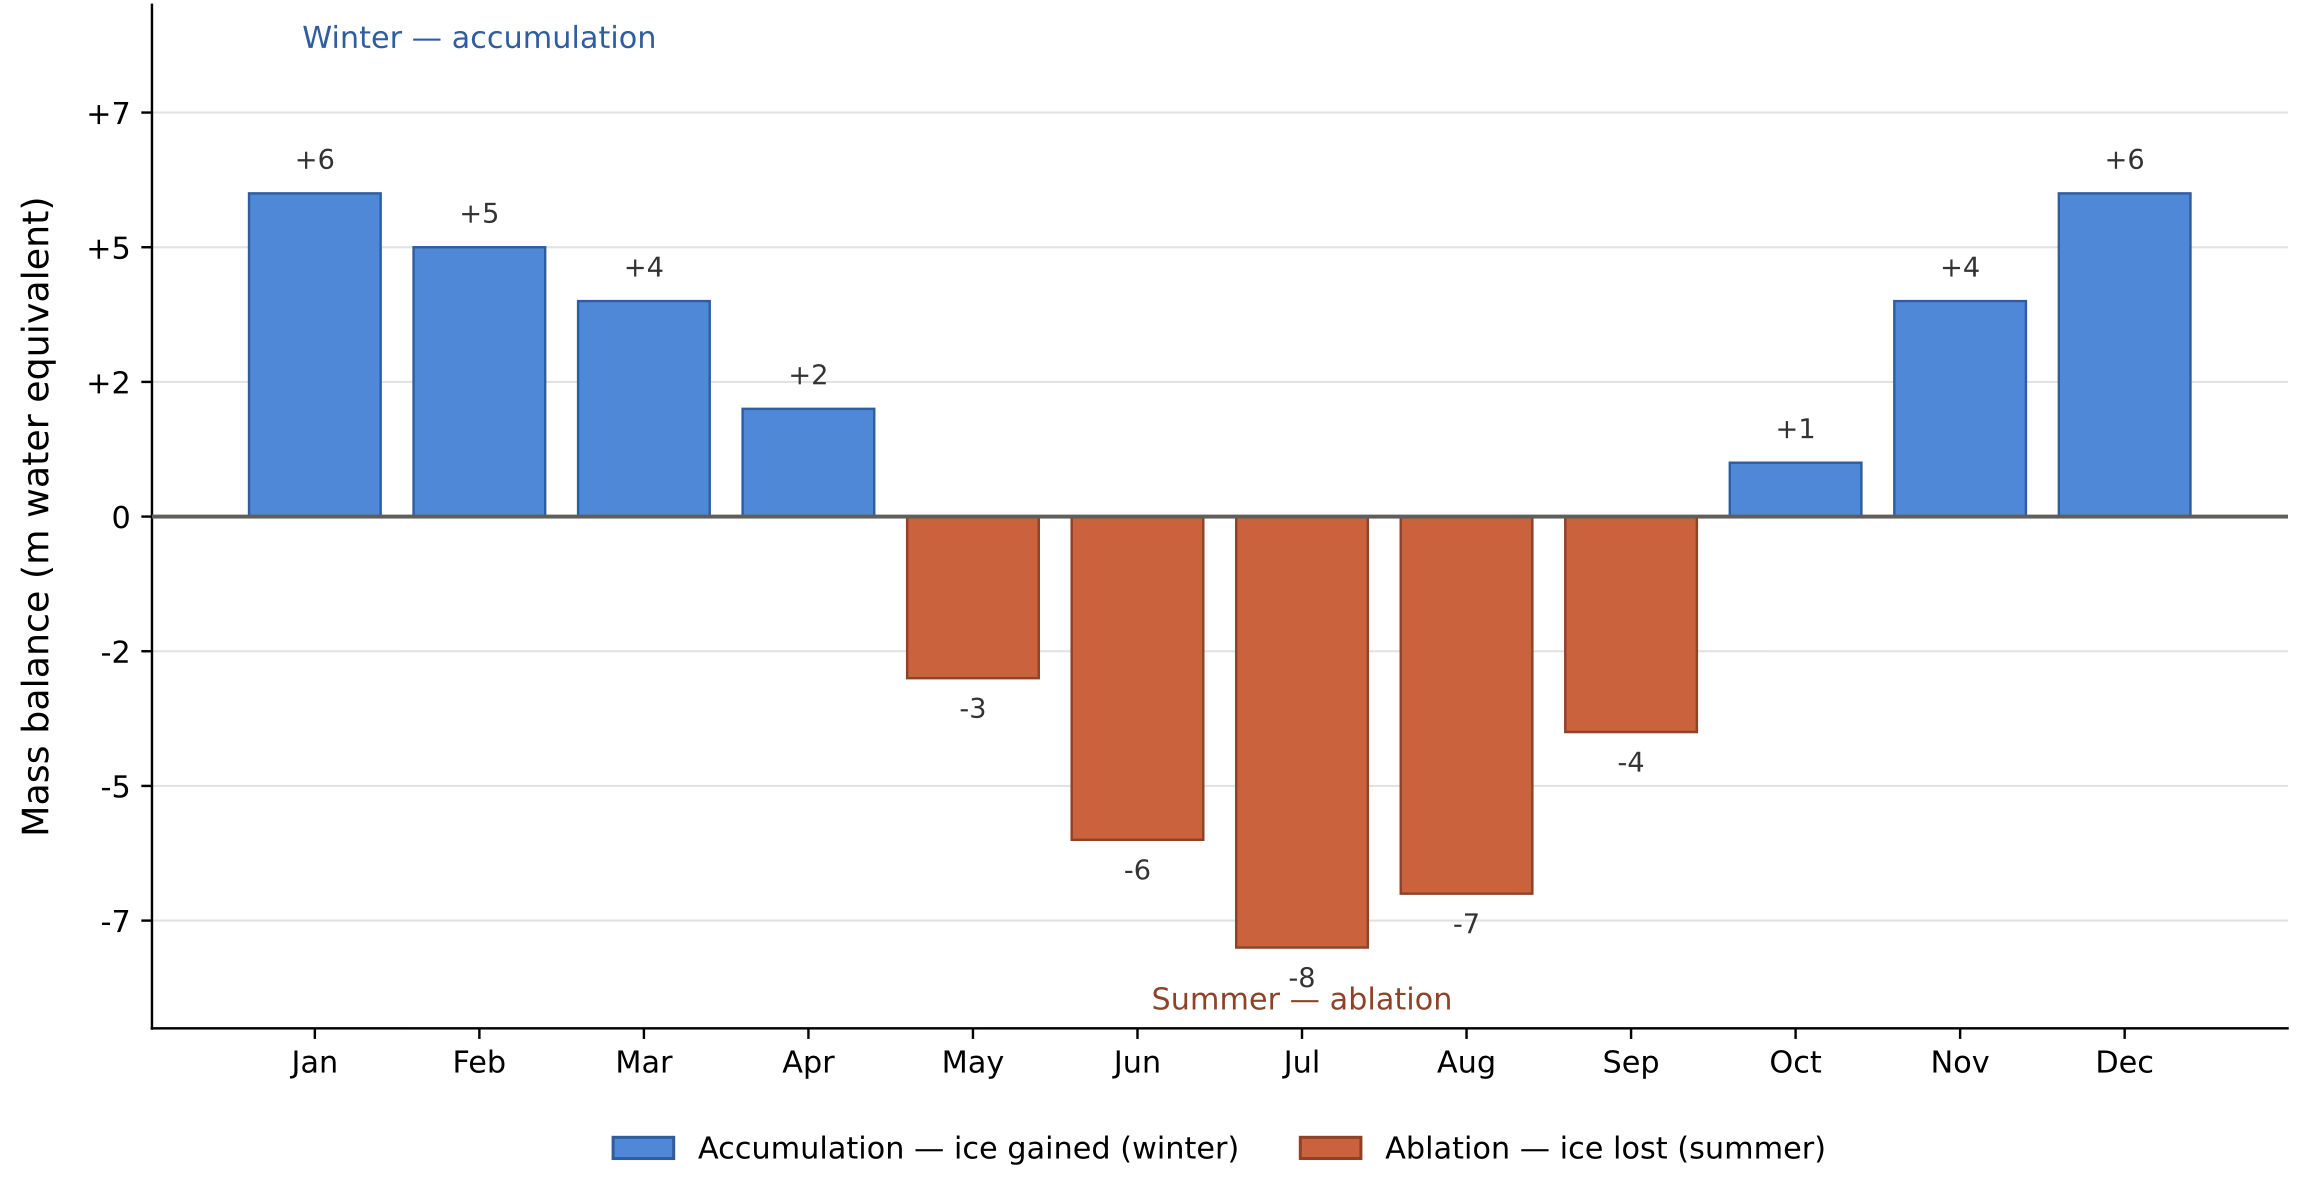
Bar chart of monthly glacier mass balance: winter months show ice gain up to +6 m, summer months show ice loss down to −8 m water equivalent.
Figure 1 - Glacier ablation and accumulation

Explain how the glacier shown can stay the same size over a year.

10
6 marks

Study Figure 1.

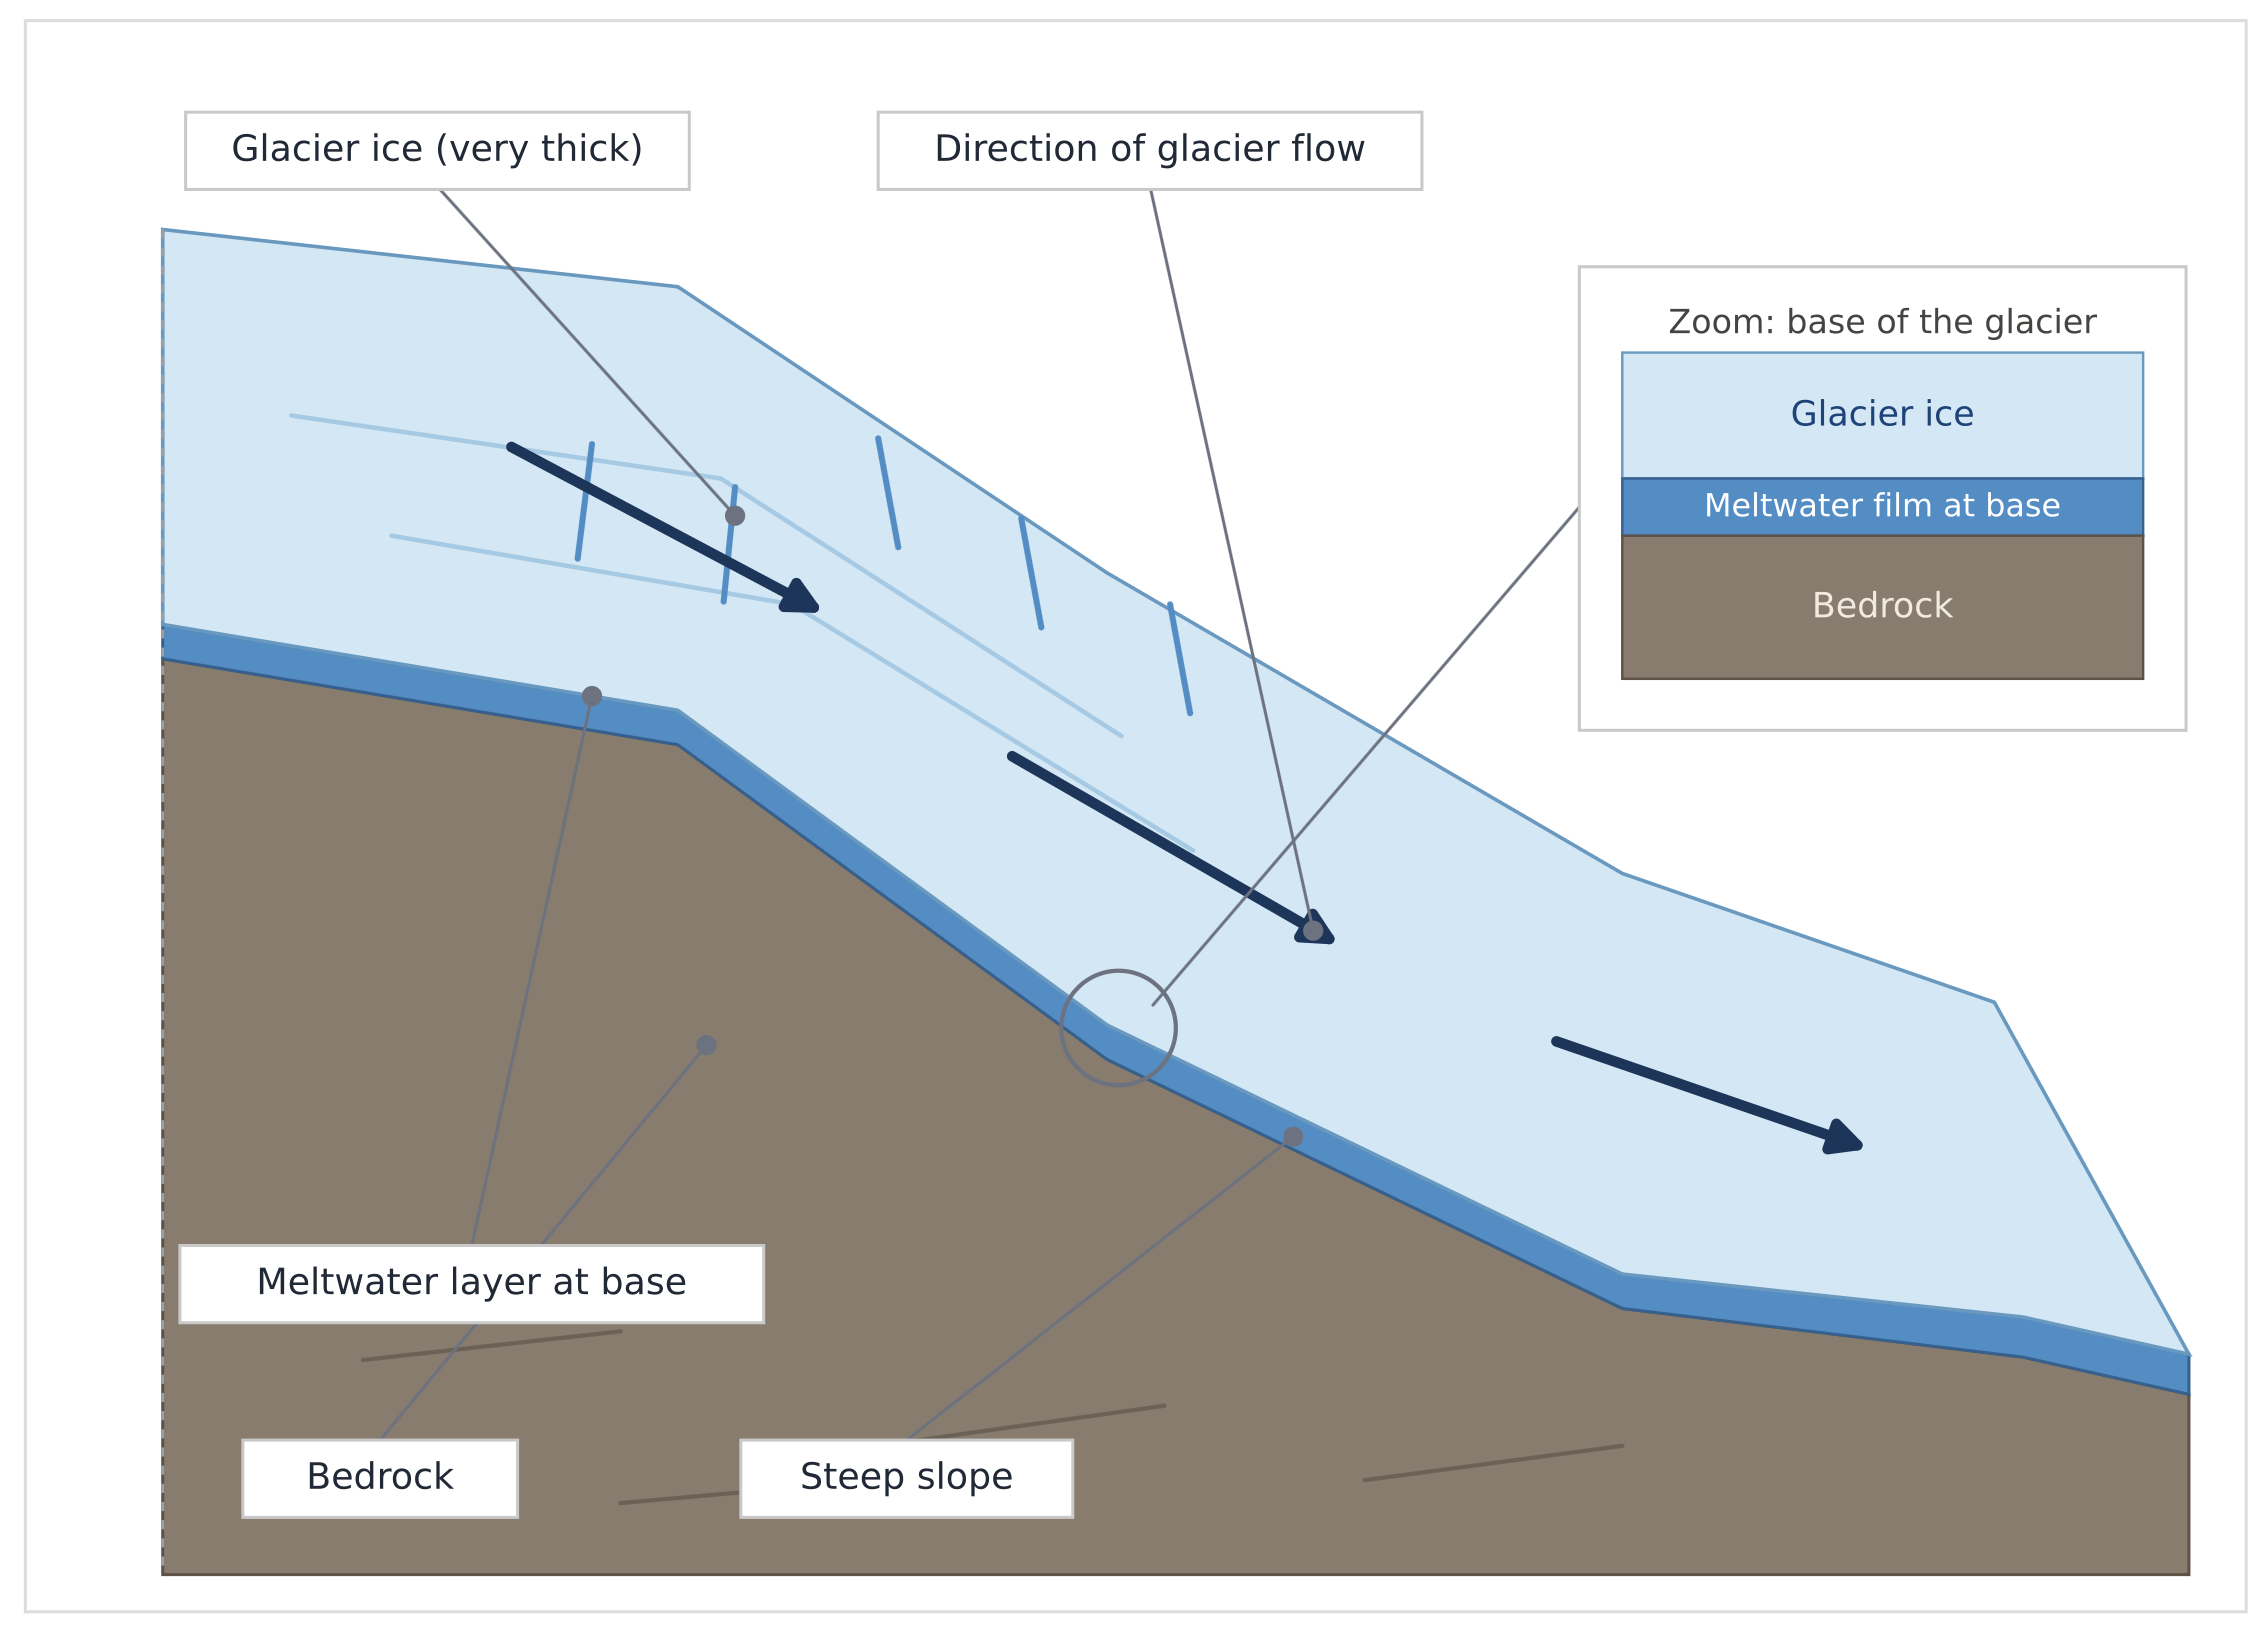
Diagram of thick glacier ice sliding downslope over bedrock, showing meltwater film at the glacier base and arrows indicating direction of glacier flow
Figure 1 - Cross-section of a glacier flowing down a steep slope

Explain how the features shown affect the rate at which the glacier moves.

1
Sme Calculator
20 marks

Evaluate the view that the rate of glacier movement is mainly determined by variations in the mass balance of a glacier.

2
20 marks

Evaluate the view that basal temperature is the most important factor controlling the rate at which a glacier moves.

3
20 marks

Evaluate the view that mass balance is the most important factor determining whether a glacier advances or retreats.