1
3 marks
Study Figure 1.
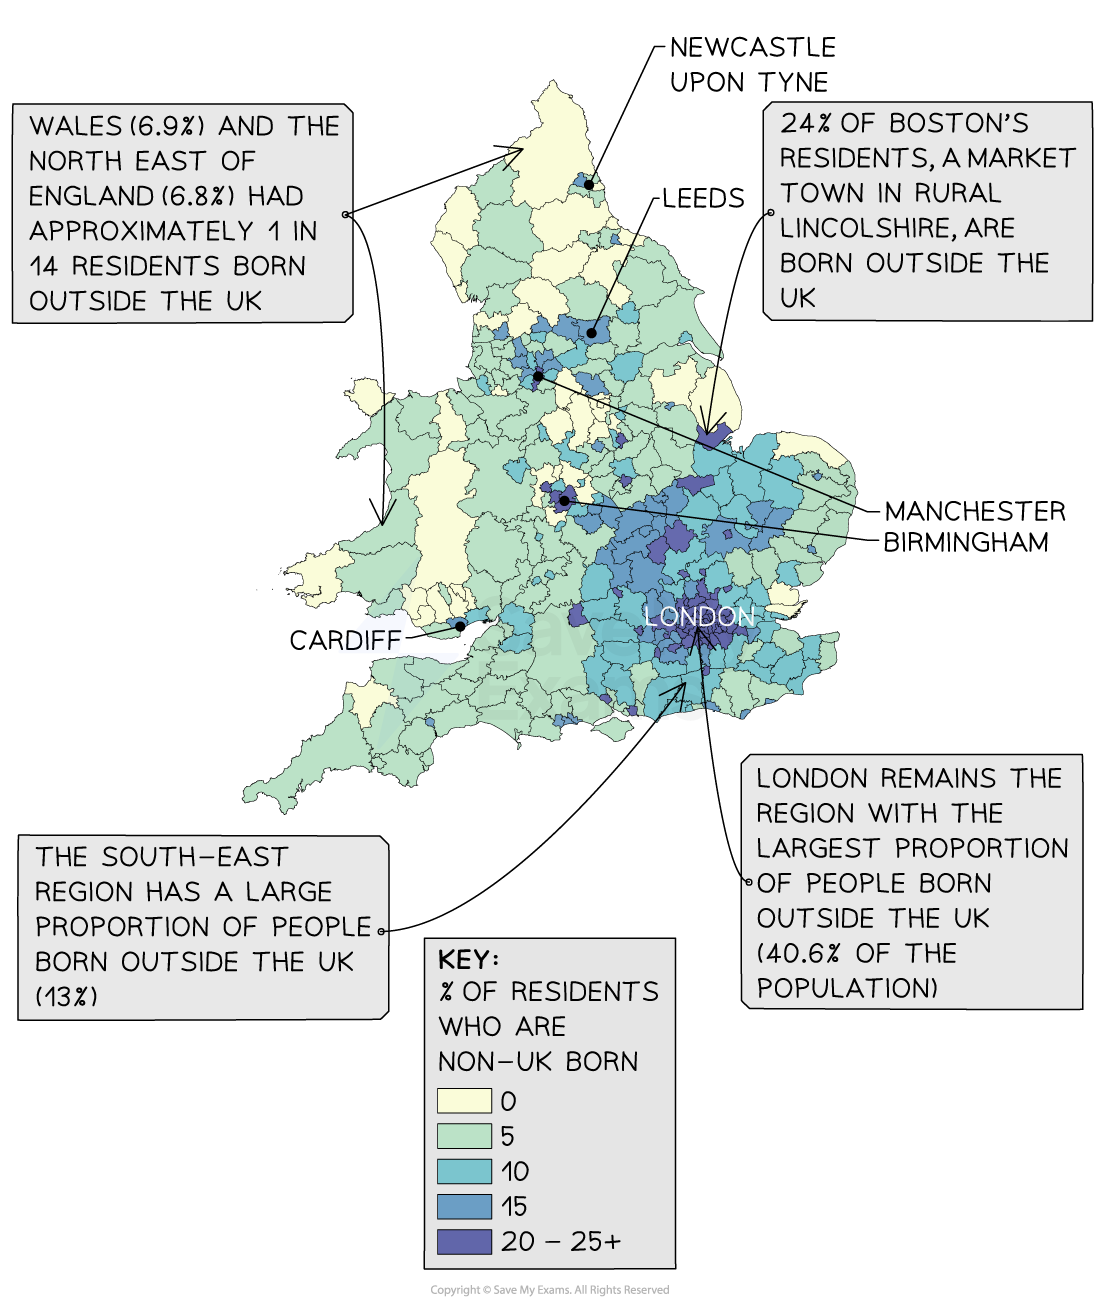
Suggest one reason why the distribution of international migrants varies across the UK.
Was this exam question helpful?
Exam code: 9GE0
Study Figure 1.
Suggest one reason why the distribution of international migrants varies across the UK.
Was this exam question helpful?
Study Figure 1.
Figure 1: Two towns
Town | Migrant population | Tension |
|---|---|---|
Boston, Lincolnshire | 31% from the EU; lowest integration of any UK town (2016) | high |
Southall, West London | 92.5% non-white; long multi-faith history | low |
Suggest one reason why tensions between long-term residents and migrants are higher in some areas than in others.
Was this exam question helpful?
Study Figure 1.
Suggest one reason why international migrants cluster in certain parts of cities.
Was this exam question helpful?
Study Figure 1.
Figure 1: UK net migration
Feature | Detail |
|---|---|
UK net migration (2022) | 745,000 |
Main origin | non-EU nationals, e.g. India |
Share of UK population growth from migration | about 60% |
Suggest one reason why net migration to the UK has increased.
Was this exam question helpful?
Study Figure 1.
Figure 1: Boston, Lincolnshire
Feature | Detail |
|---|---|
Population born outside the UK | 24% (mostly Eastern European) |
Eastern European share, 2004 | 0% |
Main jobs | agricultural 'picking, packing and plucking' work |
Suggest one reason why a rural area such as Boston has attracted international migrants.
Was this exam question helpful?
Study Figure 3

Figure 3
Distribution of international migrants and asylum seekers
Explain why there are tensions between long-term residents and international migrants in some areas but not others.
Was this exam question helpful?
Explain how the built environment in urban areas usually reflects the ethnicity of their residents.
Was this exam question helpful?
Study Figure 1.
Figure 1: Two contrasting places
Place | Migrant population | Integration |
|---|---|---|
Boston, Lincolnshire | 31% from the EU | lowest integration of any UK town (2016); 75% voted to leave the EU |
Southall, West London | 92.5% non-white | long multi-faith history; viewed as harmonious |
Suggest why there are tensions between long-term residents and international migrants in some areas but not in others.
Was this exam question helpful?
With reference to a named example, explain how cultural diversity has changed the built environment of an urban area.
Was this exam question helpful?
Explain the factors that may result in ethnically segregated communities.
Was this exam question helpful?
Study Figure 1.
Figure 1: Impacts of increased cultural diversity in the UK
Benefits | Challenges |
|---|---|
fills labour shortages; pays taxes; enriches music, food and business (e.g. Deliveroo) | pressure on housing, healthcare and schools; some feel UK culture is 'diluted'; tension and occasional riots |
Suggest why increased cultural diversity can bring both benefits and challenges to a community.
Was this exam question helpful?
With reference to a named example, explain why changes to the built environment can create tension within a community.
Was this exam question helpful?
Evaluate the reasons why changes in land use in diverse places are often controversial.
Was this exam question helpful?
For your local place and your contrasting place, evaluate the view that international migration has an important impact on their population characteristics.
Was this exam question helpful?
Evaluate the view that increased cultural diversity creates more challenges than opportunities for communities.
Was this exam question helpful?