Increasing Energy Demand (Edexcel A Level Geography): Exam Questions

Exam code: 9GE0

2 hours17 questions
1
Sme Calculator
3 marks

Study Figure 4a

fig-4a-qp-9geo-01-nov-2021-edexcel-a-level-geo

Figure 4a

Actual and forecast changes in oil production in Canada from 2010 to 2030

Unconventional oil reserves include tar sands, oil shale and deep water oil.

Explain one possible consequence of the changes in unconventional oil production.

2
Sme Calculator
3 marks

Study Figure 4a

fig-4a-qp-9geo-01-june-2019-edexcel-a-level-geo

Figure 4a

Biofuel production in Brazil, the world's second largest producer, 2000–2016

Explain one impact of the changes in biofuel production in Brazil on the carbon cycle.

3
3 marks

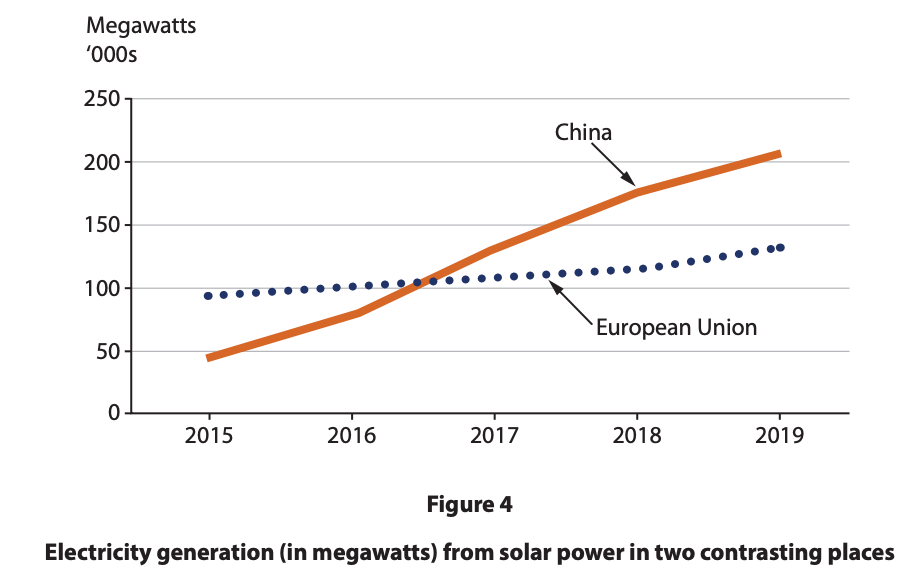
Study Figure 4.

Line graph of solar electricity generation 2015–2019 showing China rising steeply from about 40k to 210k MW, EU rising gently from about 95k to 130k MW

Suggest one reason for the differences in the growth of electricity generated from solar power.

4
3 marks

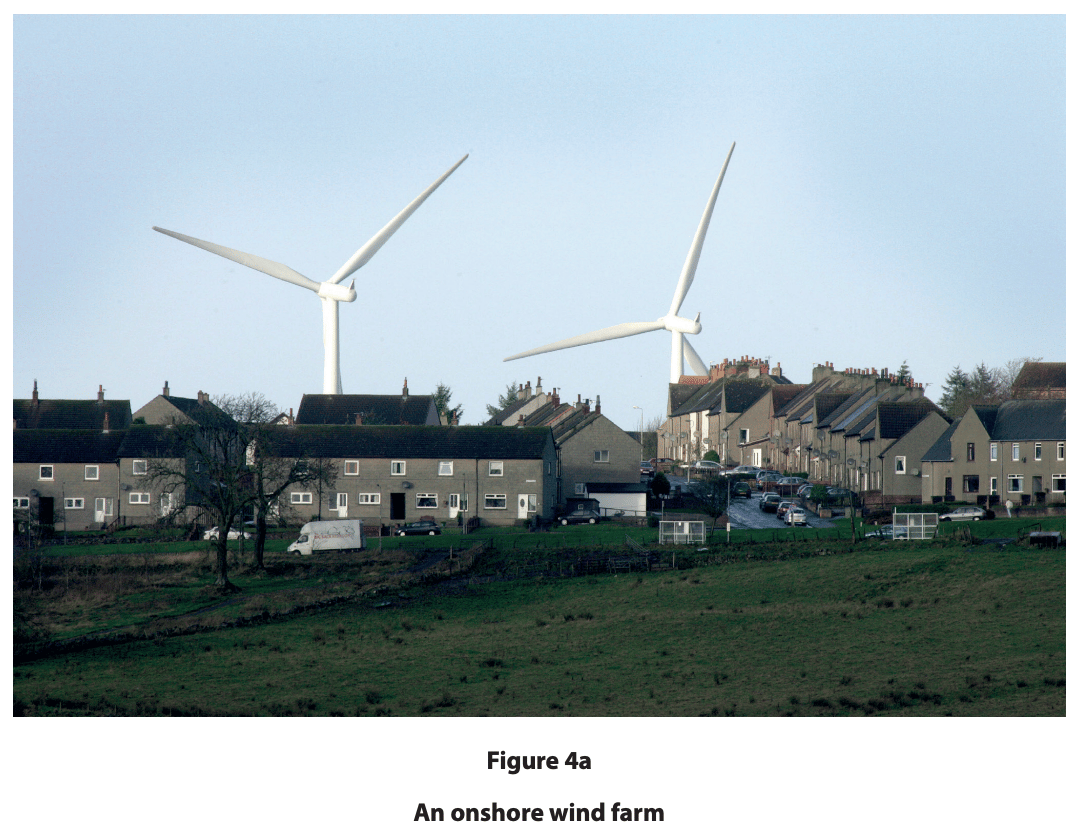
Study Figure 4a.

Two large white wind turbines rise behind a row of village houses, overlooking parked cars, trees and grassy fields under a pale sky.

Explain one possible impact on local communities of the development of onshore wind farms.

5
3 marks

Study Figure 1, which compares energy use in the USA and France.

Figure 1: Energy use in the USA and France

Indicator

USA

France

Total energy consumption

2,224 mtoe

243 mtoe

Population

334 million

65.6 million

Climate

extremes of heat and cold

more temperate

Suggest one reason why total energy consumption is much higher in the USA than in France.

6
3 marks

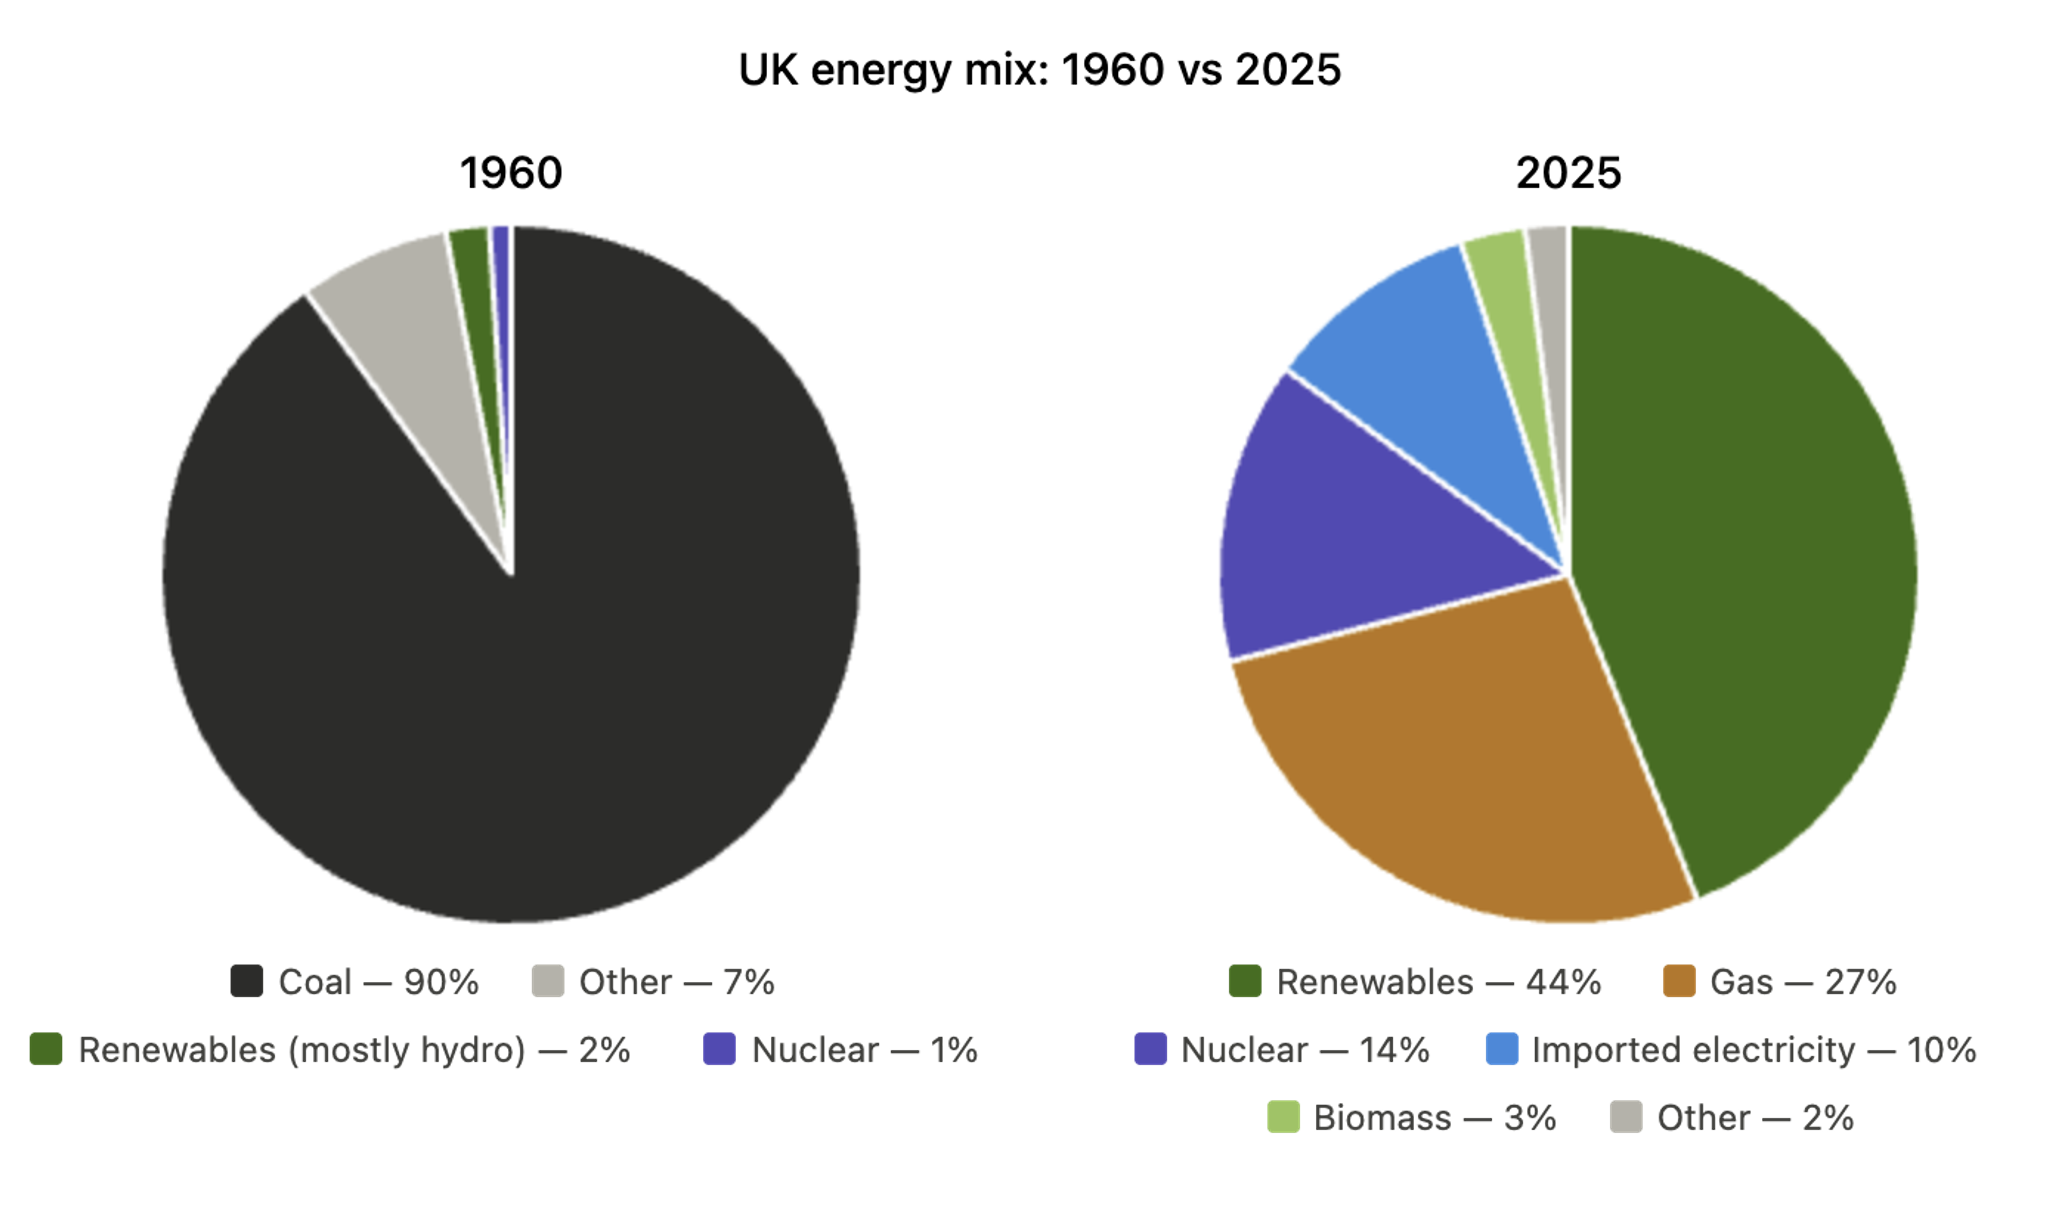
Study Figure 1, which shows changes in the UK's electricity mix.

Two pie charts comparing UK energy mix: 1960 dominated by coal, 2025 dominated by renewables with major shares for gas, nuclear and imports.
Figure 1 - Comparison of the UK Energy mix 1960 vs 2025

Suggest one reason for the fall in the use of coal shown.

1
Sme Calculator
6 marks

Explain why the level of economic development affects the energy mix of countries.

2
6 marks

Explain why the energy mix of countries varies.

3
6 marks

Explain how energy pathways help to resolve mismatches between energy supply and demand.

4
6 marks

Explain how physical factors affect a country's ability to use renewable energy.

5
8 marks

Explain why some countries are more energy secure than others.

6
8 marks

Explain the role of different players in meeting the global demand for energy.

7
8 marks

Explain why some countries are increasingly turning to unconventional fossil fuels to meet energy demand.

1
Sme Calculator
12 marks

Assess the importance of renewable energy in reducing the risks of further planetary warming.

2
Sme Calculator
20 marks

Evaluate the extent to which today's increasing demand for energy is the most important factor modifying the carbon cycle.

3
12 marks

Assess how successful different countries have been in achieving energy security.

4
20 marks

Evaluate the view that renewable energy is the best way to meet the world's growing demand for energy.