1

2 marks
Study Figure 6 below.

Figure 6
Top four countries of birth for migrants living in Australia, 2016
Draw a divided bar chart, using the key and the data in Figure 6.

Was this exam question helpful?
Exam code: 9GE0
Study Figure 6 below.
Figure 6
Top four countries of birth for migrants living in Australia, 2016
Draw a divided bar chart, using the key and the data in Figure 6.
Was this exam question helpful?
Study Figure C below.
Country | Malawi | Nigeria | India | Egypt | Iran | Czech Republic | France | United States | Norway |
|---|---|---|---|---|---|---|---|---|---|
Human Development Index | 0.43 | 0.50 | 0.58 | 0.68 | 0.75 | 0.85 | 0.88 | 0.91 | 0.94 |
% of foreign-born residents | 1.3% | 0.7% | 0.4% | 0.4% | 3.5% | 4.0% | 11.5% | 14.3% | 11.8% |
Figure C: Table showing the Human Development Index and the percentage of foreign-born residents in selected countries
Using the data from Figure C, plot the data for Egypt, Iran and the Czech Republic on Figure D.

Figure D: Graph showing the Human Development Index and the percentage of foreign-born residents in selected countries
Was this exam question helpful?
The total number of migrants living in Australia was 6.19 million. The total number of migrants from the UK, New Zealand, China and India was 2.8 million.
Calculate the percentage of migrants who came from these four countries. Give your answer to one decimal place. You must show your working.
Was this exam question helpful?
Figure D below shows the Human Development Index (HDI) scores and the percentage of foreign-born residents for selected countries, with the data points plotted.
Figure D: Graph showing the Human Development Index and the percentage of foreign-born residents in selected countries
Draw a regression (best-fit) line on Figure D to show the relationship.
Was this exam question helpful?
Study Figure 4, which shows the results of a Spearman's rank correlation test of the relationship between the percentage of the population that are foreign born and a cultural diversity score, for 12 selected countries.
Figure 4 — The percentage (%) foreign-born population and cultural diversity scores for selected countries, 2020. Cultural diversity score is measured by the number of different first languages spoken (1 = multiple first languages, 0 = a single home language).
Country | % foreign born | Rank | Cultural diversity score | Rank | d | d² |
|---|---|---|---|---|---|---|
United Arab Emirates | 88.1 | 1 | 0.62 | 2 | −1 | 1 |
Singapore | 43.1 | 2 | 0.39 | 6 | −4 | 16 |
Switzerland | 28.8 | 3 | 0.50 | 5 | −2 | 4 |
Iceland | 19.2 | 4 | 0.07 | 9 | −5 | |
United States | 15.3 | 5 | 0.56 | 3 | 2 | 4 |
United Kingdom | 13.8 | 6 | 0.53 | 4 | 2 | 4 |
France | 13.1 | 7 | 0.38 | 7 | 0 | 0 |
Russia | 7.9 | 8 | 0.24 | 8 | 0 | 0 |
South Africa | 4.8 | 9 | 0.86 | 1 | 8 | 64 |
Colombia | 3.7 | 10 | 0.02 | 11 | −1 | 1 |
Japan | 2.2 | 11 | 0.01 | 12 | −1 | 1 |
Brazil | 0.5 | 12 | 0.05 | 10 | 2 | 4 |
Using the data in Figure 4, calculate the value of d² for Iceland.
Was this exam question helpful?
Country | % foreign born | Rank | Cultural diversity score | Rank | d | d² |
|---|---|---|---|---|---|---|
United Arab Emirates | 88.1 | 1 | 0.62 | 2 | −1 | 1 |
Singapore | 43.1 | 2 | 0.39 | 6 | −4 | 16 |
Switzerland | 28.8 | 3 | 0.50 | 5 | −2 | 4 |
Iceland | 19.2 | 4 | 0.07 | 9 | −5 | |
United States | 15.3 | 5 | 0.56 | 3 | 2 | 4 |
United Kingdom | 13.8 | 6 | 0.53 | 4 | 2 | 4 |
France | 13.1 | 7 | 0.38 | 7 | 0 | 0 |
Russia | 7.9 | 8 | 0.24 | 8 | 0 | 0 |
South Africa | 4.8 | 9 | 0.86 | 1 | 8 | 64 |
Colombia | 3.7 | 10 | 0.02 | 11 | −1 | 1 |
Japan | 2.2 | 11 | 0.01 | 12 | −1 | 1 |
Brazil | 0.5 | 12 | 0.05 | 10 | 2 | 4 |
Using the data in Figure 4, calculate Σd² (the sum of the d² values).
Was this exam question helpful?
The formula for Spearman's rank correlation coefficient is rs = 1 − (6Σd²) ÷ (n³ − n), where n = 12.
Country | % foreign born | Rank | Cultural diversity score | Rank | d | d² |
|---|---|---|---|---|---|---|
United Arab Emirates | 88.1 | 1 | 0.62 | 2 | −1 | 1 |
Singapore | 43.1 | 2 | 0.39 | 6 | −4 | 16 |
Switzerland | 28.8 | 3 | 0.50 | 5 | −2 | 4 |
Iceland | 19.2 | 4 | 0.07 | 9 | −5 | |
United States | 15.3 | 5 | 0.56 | 3 | 2 | 4 |
United Kingdom | 13.8 | 6 | 0.53 | 4 | 2 | 4 |
France | 13.1 | 7 | 0.38 | 7 | 0 | 0 |
Russia | 7.9 | 8 | 0.24 | 8 | 0 | 0 |
South Africa | 4.8 | 9 | 0.86 | 1 | 8 | 64 |
Colombia | 3.7 | 10 | 0.02 | 11 | −1 | 1 |
Japan | 2.2 | 11 | 0.01 | 12 | −1 | 1 |
Brazil | 0.5 | 12 | 0.05 | 10 | 2 | 4 |
Using the data in Figure 4, calculate the value of rs. Give your answer to two decimal places. You must show your working.
Was this exam question helpful?
Explain why the rate of assimilation of migrants varies between countries.
Was this exam question helpful?
Study Figure 4 below.
Figure 4 — Percentage of population living overseas and GDP per capita for a selection of countries, 2021.
Country | % of population living overseas | GDP per capita (US$) |
|---|---|---|
United States | 0.5 | 69,287 |
Switzerland | 7.4 | 77,324 |
Norway | 3.5 | 79,201 |
Ireland | 17.5 | 106,455 |
Netherlands | 4.9 | 63,766 |
Mexico | 12.2 | 20,036 |
Japan | 0.6 | 43,940 |
Turkey | 4.4 | 30,372 |
Calculate the mean percentage of population living overseas for the countries shown in Figure 4. Give your answer to one decimal place. You must show your working.
Was this exam question helpful?
Figure 4 — Percentage of population living overseas and GDP per capita for a selection of countries, 2021.
Country | % of population living overseas | GDP per capita (US$) |
|---|---|---|
United States | 0.5 | 69,287 |
Switzerland | 7.4 | 77,324 |
Norway | 3.5 | 79,201 |
Ireland | 17.5 | 106,455 |
Netherlands | 4.9 | 63,766 |
Mexico | 12.2 | 20,036 |
Japan | 0.6 | 43,940 |
Turkey | 4.4 | 30,372 |
Calculate the range in GDP per capita for the countries shown. You must show your working.
Was this exam question helpful?
Study Figure 6

Figure 6
Foreign-born population (international migrants) by destination country, 2018
Suggest reasons for the differences in the numbers of foreign-born population (international migrants) in the countries shown.
Was this exam question helpful?
Explain why the movement of labour is unrestricted within many countries.
Was this exam question helpful?
Study Figure 6 below.
Figure 6
Top four countries of birth for migrants living in Australia, 2016
Suggest reasons why the UK, New Zealand, China and India are the main source countries for migrants to Australia.
Was this exam question helpful?
Study Figure C below.
Country | Malawi | Nigeria | India | Egypt | Iran | Czech Republic | France | United States | Norway |
|---|---|---|---|---|---|---|---|---|---|
Human Development Index | 0.43 | 0.50 | 0.58 | 0.68 | 0.75 | 0.85 | 0.88 | 0.91 | 0.94 |
% of foreign-born residents | 1.3% | 0.7% | 0.4% | 0.4% | 3.5% | 4.0% | 11.5% | 14.3% | 11.8% |
Figure C: Table showing the Human Development Index and the percentage of foreign-born residents in selected countries
Suggest reasons for the relationship between Human Development Index scores and the percentage of foreign-born residents.
Was this exam question helpful?
Figure 4 — The percentage (%) foreign-born population and cultural diversity scores for selected countries, 2020. Cultural diversity score is measured by the number of different first languages spoken (1 = multiple first languages, 0 = a single home language).
Country | % foreign born | Rank | Cultural diversity score | Rank | d | d² |
|---|---|---|---|---|---|---|
United Arab Emirates | 88.1 | 1 | 0.62 | 2 | −1 | 1 |
Singapore | 43.1 | 2 | 0.39 | 6 | −4 | 16 |
Switzerland | 28.8 | 3 | 0.50 | 5 | −2 | 4 |
Iceland | 19.2 | 4 | 0.07 | 9 | −5 | |
United States | 15.3 | 5 | 0.56 | 3 | 2 | 4 |
United Kingdom | 13.8 | 6 | 0.53 | 4 | 2 | 4 |
France | 13.1 | 7 | 0.38 | 7 | 0 | 0 |
Russia | 7.9 | 8 | 0.24 | 8 | 0 | 0 |
South Africa | 4.8 | 9 | 0.86 | 1 | 8 | 64 |
Colombia | 3.7 | 10 | 0.02 | 11 | −1 | 1 |
Japan | 2.2 | 11 | 0.01 | 12 | −1 | 1 |
Brazil | 0.5 | 12 | 0.05 | 10 | 2 | 4 |
Suggest reasons for the relationship between the percentage of foreign-born population and cultural diversity score.
Was this exam question helpful?
Explain why political and economic events change the patterns of international migration.
Was this exam question helpful?
Study Figure 5.
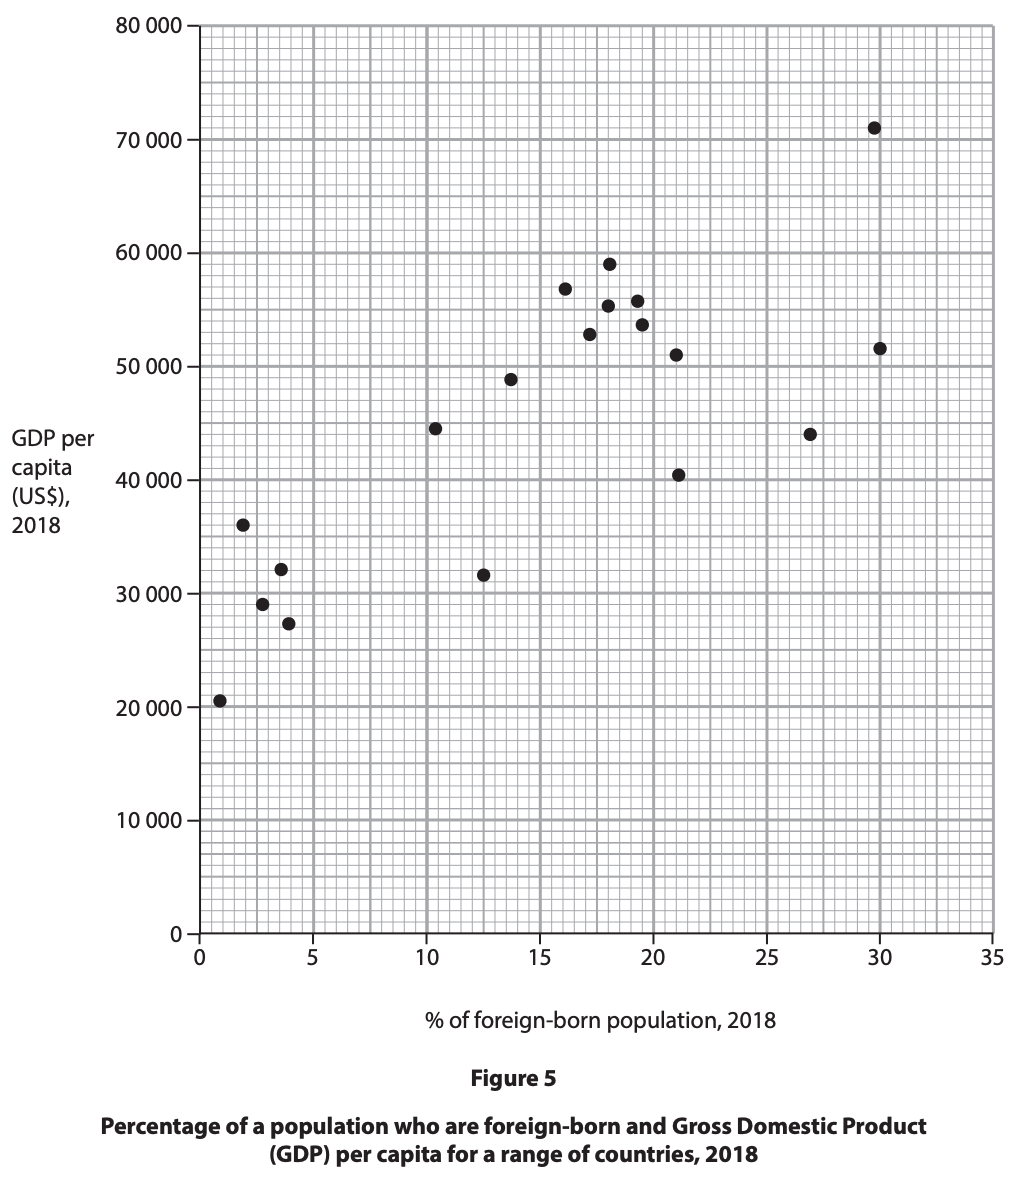
Suggest reasons for the relationship shown between the percentage of a country's population who are foreign-born and their GDP per capita.
Was this exam question helpful?
Study Figure 4.
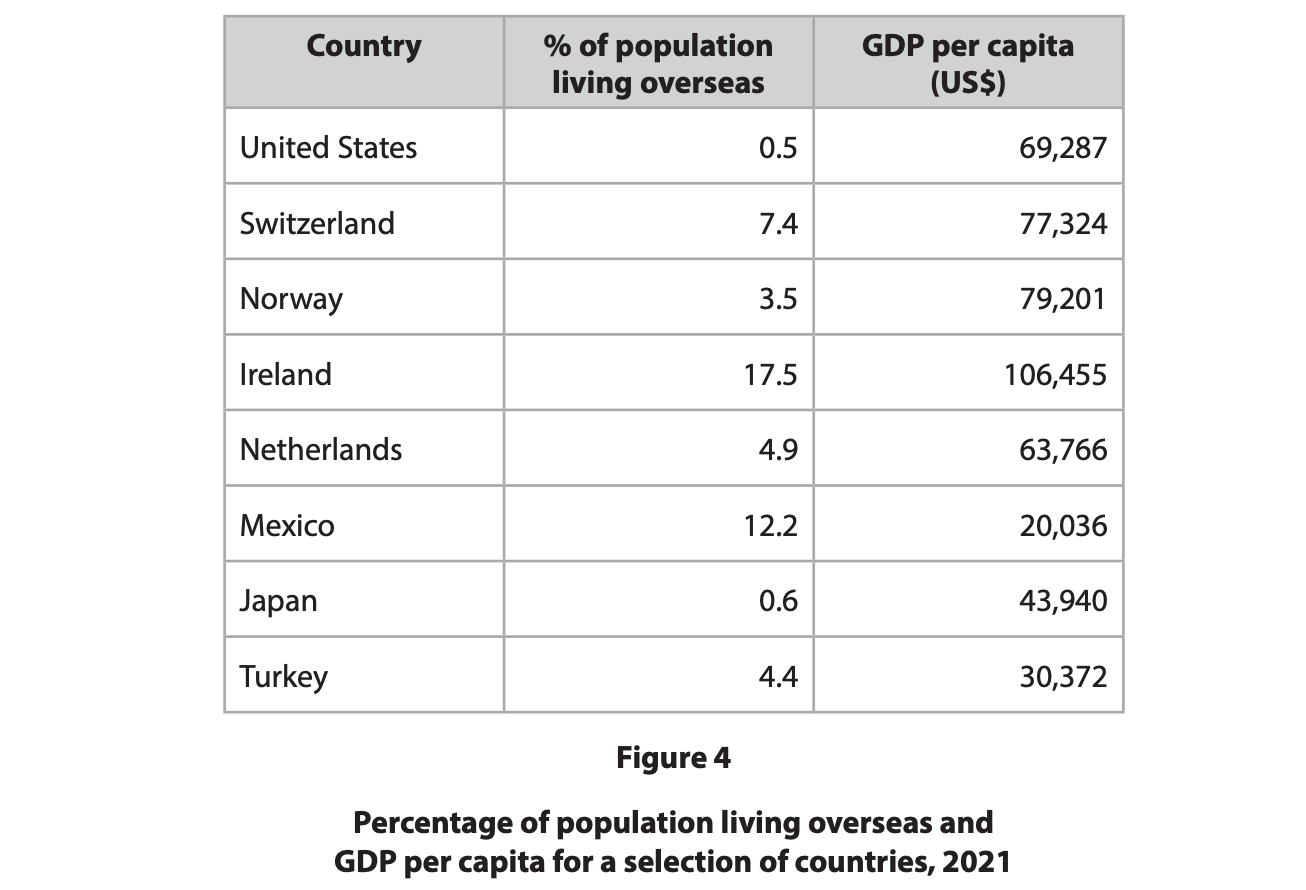
Suggest why the percentage of the population living overseas varies for these countries.
Was this exam question helpful?
Evaluate the view that increased globalisation inevitably results in international migration.
Was this exam question helpful?
Evaluate the view that increased globalisation inevitably results in international migration.
Was this exam question helpful?
Evaluate the view that international migration brings more benefits than costs to receiving countries.
Was this exam question helpful?
Evaluate the view that economic factors are the most important cause of international migration.
Was this exam question helpful?
Evaluate the view that the free movement of labour benefits some groups far more than others.
Was this exam question helpful?