1
3 marks
Study Figure 2a.
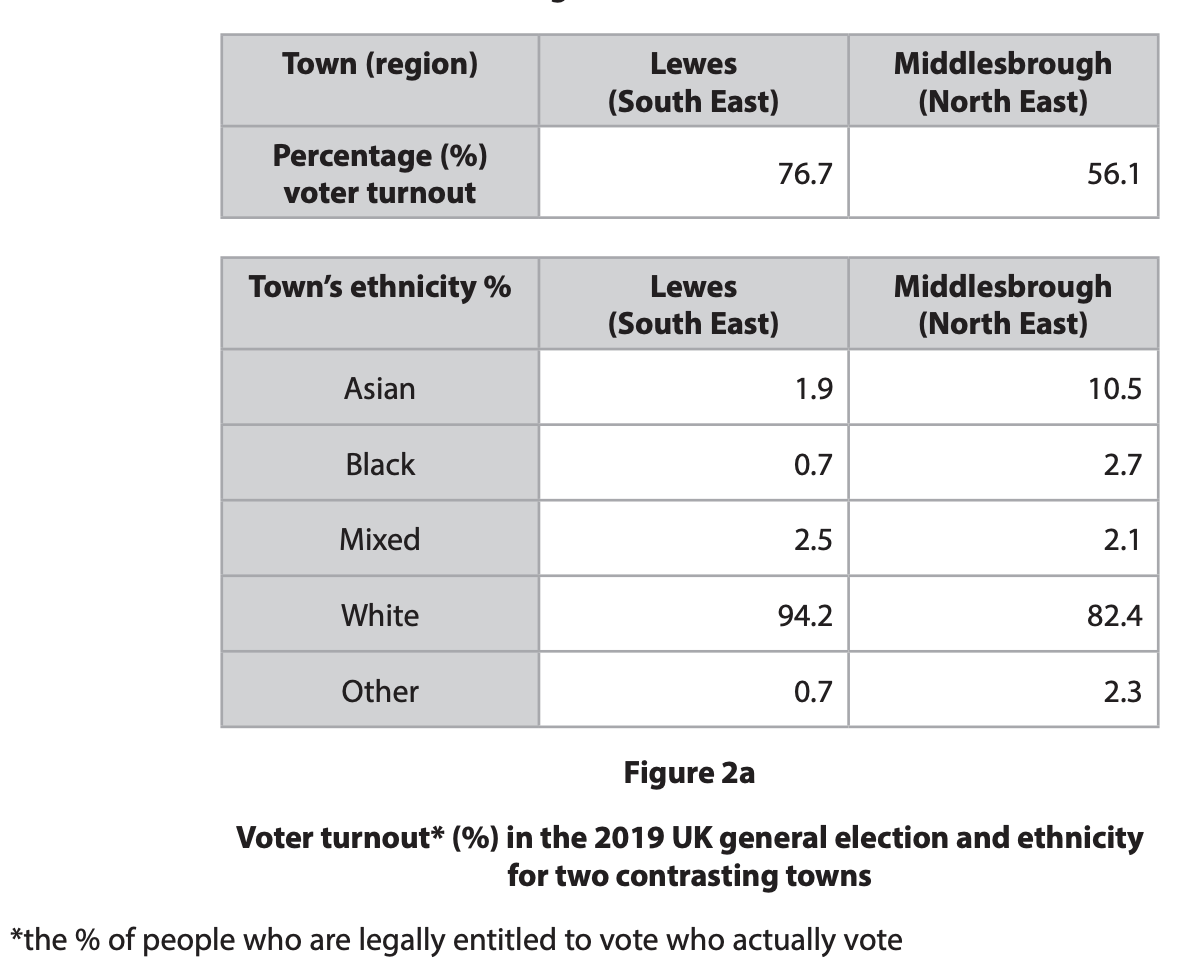
Suggest one reason why ethnic diversity may affect the percentage of people who vote.
Was this exam question helpful?
Exam code: 9GE0
Study Figure 2a.
Suggest one reason why ethnic diversity may affect the percentage of people who vote.
Was this exam question helpful?
Study Figure 1, which shows working-age unemployment rates by ethnicity for selected UK regions in 2016.
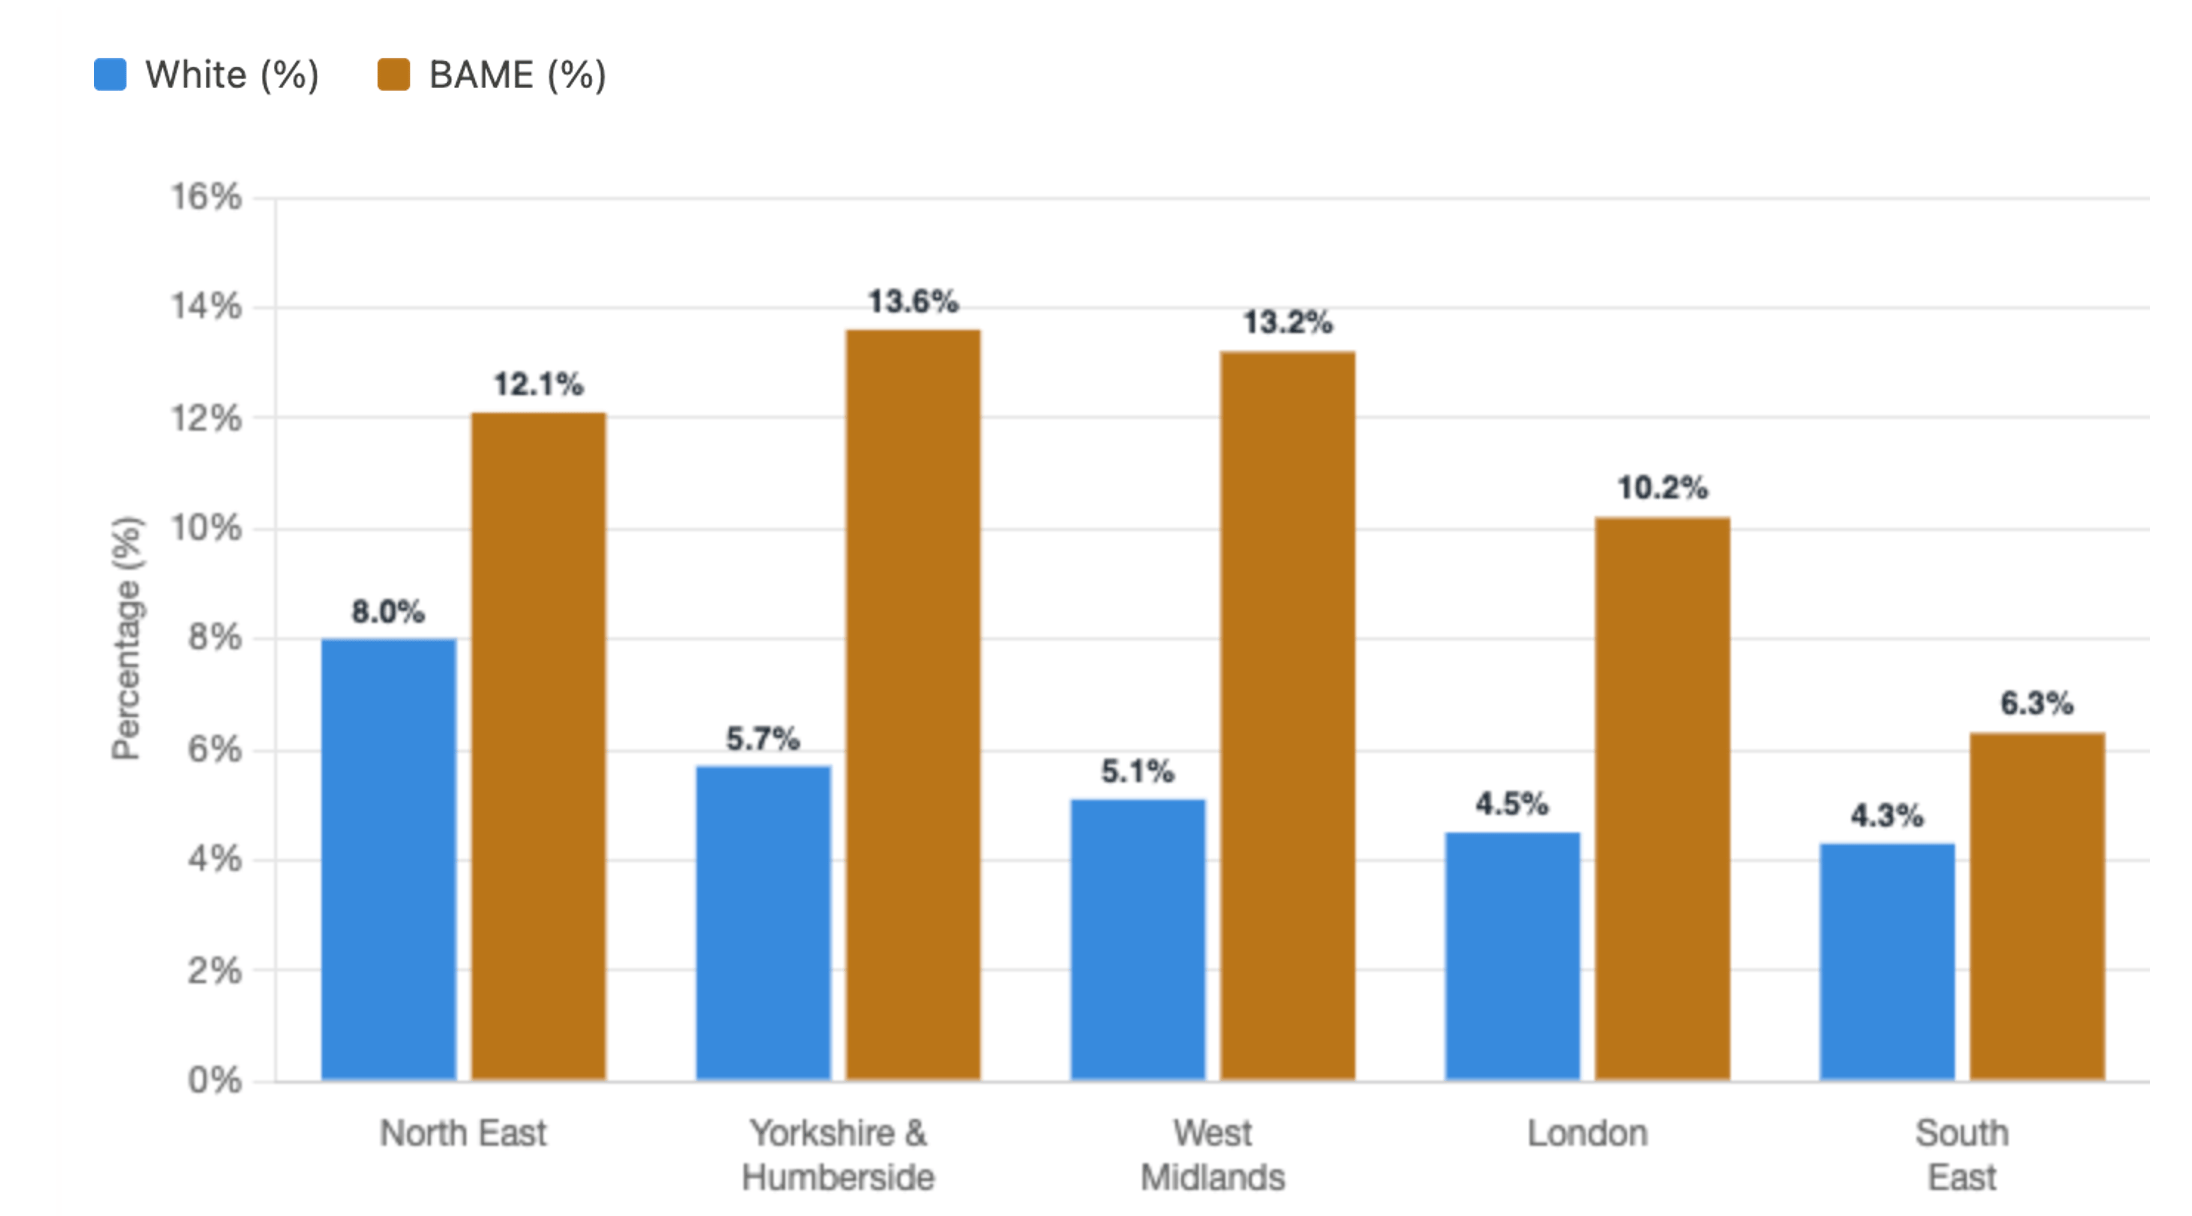
Suggest one reason why unemployment rates differ between White and Black and Minority Ethnic (BAME) groups.
Was this exam question helpful?
Study Figure 1, which shows social indicator rankings for two neighbouring wards in Liverpool (1 = most deprived of 64 wards).
Figure 1: Social indicators for Speke and Garston, Liverpool
Indicator (rank of 64 wards, 1 = most deprived) | Speke | Garston |
|---|---|---|
Overall ranking | 10 | 39 |
Life expectancy | 19 | 35 |
Crime – domestic violence | 10 | 39 |
Index of Multiple Deprivation | 11 | 32 |
Suggest one way these data could be used to assess social progress in an urban area.
Was this exam question helpful?
Study Figure 1, which shows reported race hate crimes for two contrasting places.
Figure 1: Reported race hate crimes
Data | Liverpool | Shetland |
|---|---|---|
Population identifying as non-White (%) | 16 | 3 |
Reported hate crimes (race) per 100,000 people | 231 | 4 |
Suggest one reason why the rate of reported hate crime varies between Liverpool and Shetland.
Was this exam question helpful?
Study Figure 1, which shows changes in average per capita income for two cities between 2011 and 2021.
Figure 1: Average per capita income in two cities
2011 income | 2021 income | Absolute change | Relative change | |
|---|---|---|---|---|
City A | £49,250 | £56,902 | +£7,652 | +15.5% |
City B | £29,980 | £37,114 | +£7,134 | +23.8% |
Suggest one reason why relative change can give a different impression of progress from absolute change.
Was this exam question helpful?
Study Figure 1, which shows the partner organisations involved in managing a rural area.
Figure 1: Selected partners in the Lake District National Park Partnership
Sector | Example partners |
|---|---|
Public | Environment Agency, Lake District National Park Authority |
Private | Cumbria Tourism |
Community / voluntary | National Trust, Cumbria Wildlife Trust |
Industry | National Farmers Union |
Suggest one way that involving a wide range of stakeholders helps to manage change in a rural living space.
Was this exam question helpful?
Study Figure 1, which shows the most common forms of diversification on UK farms.
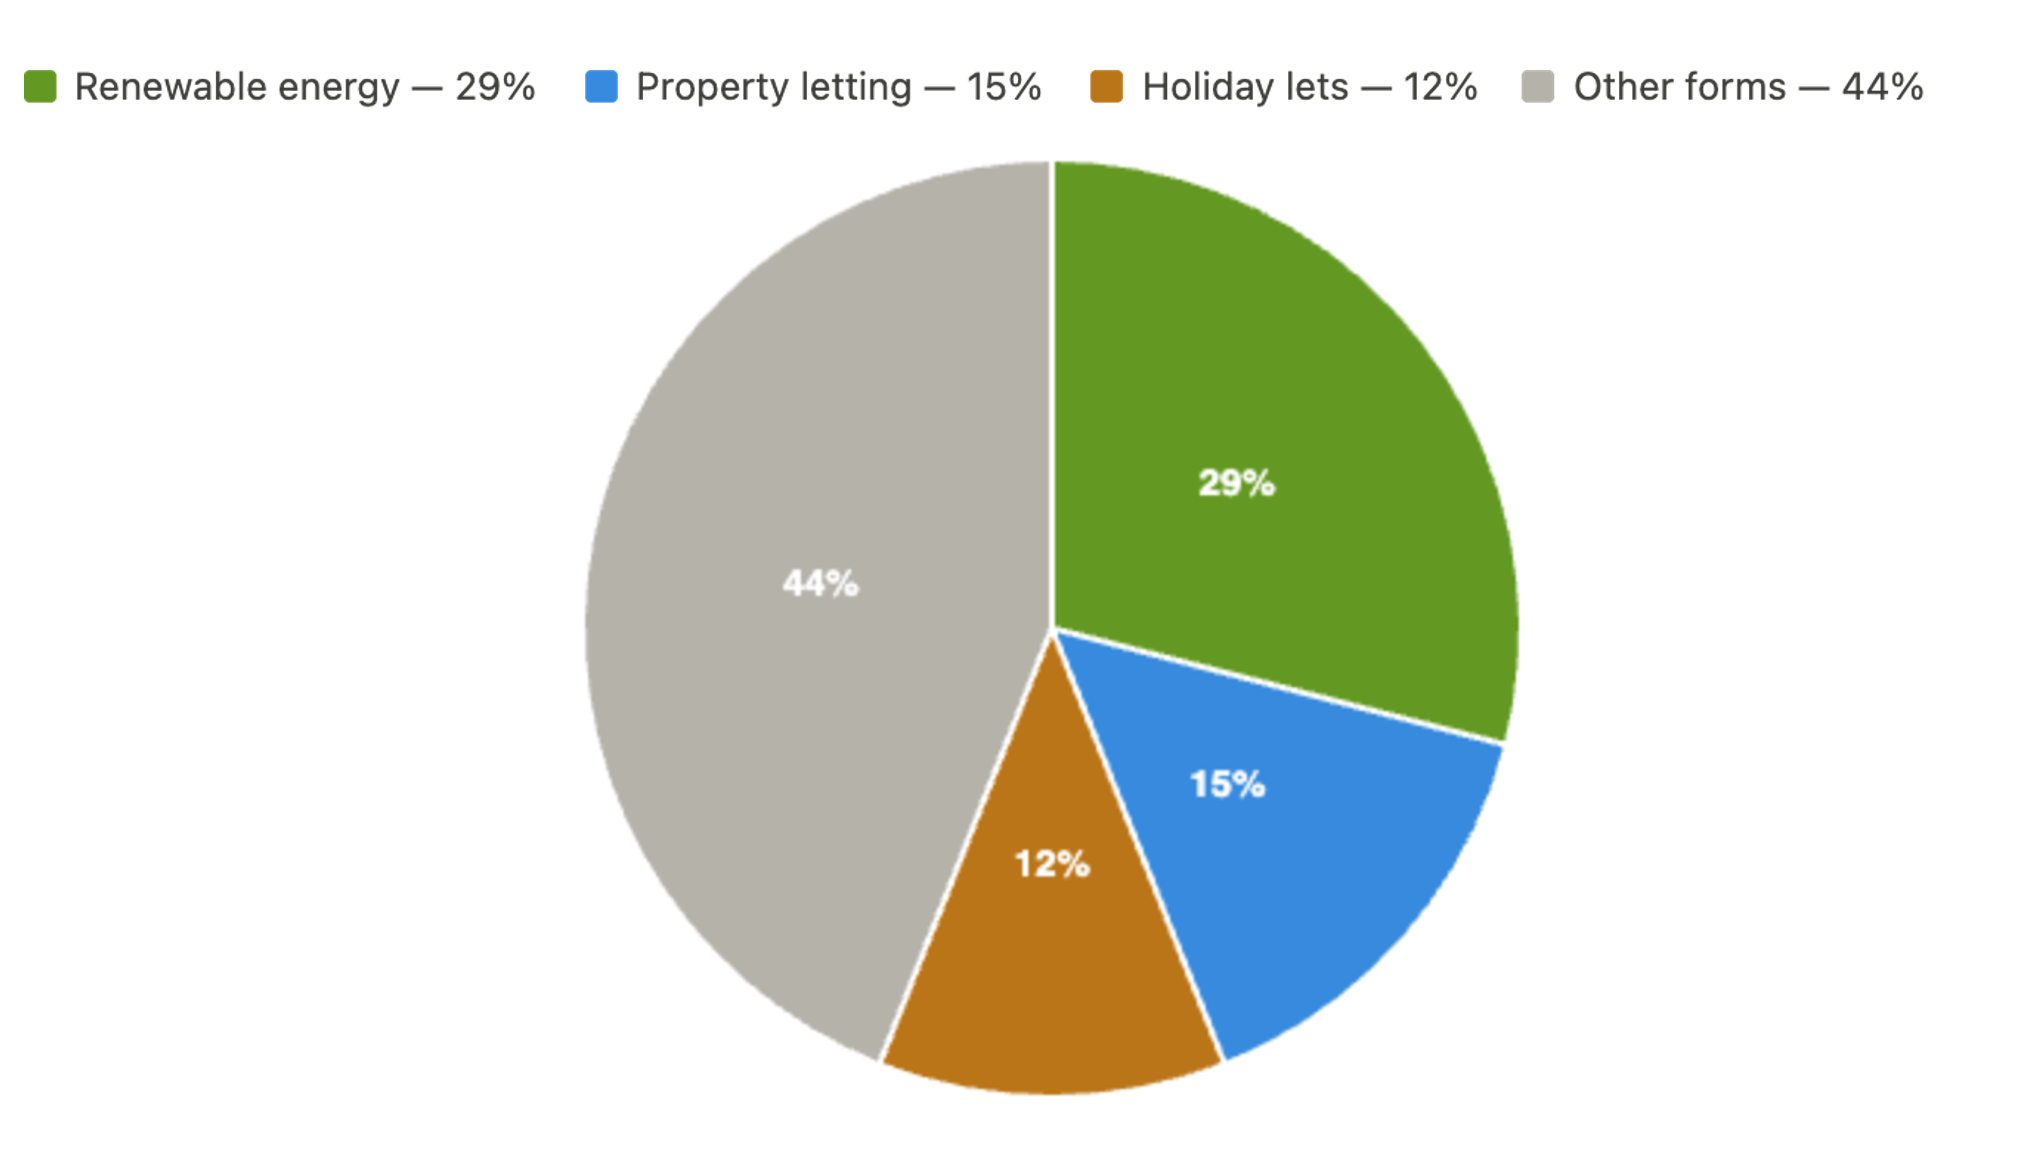
Suggest one reason why farm diversification helps to manage demographic change in rural areas.
Was this exam question helpful?
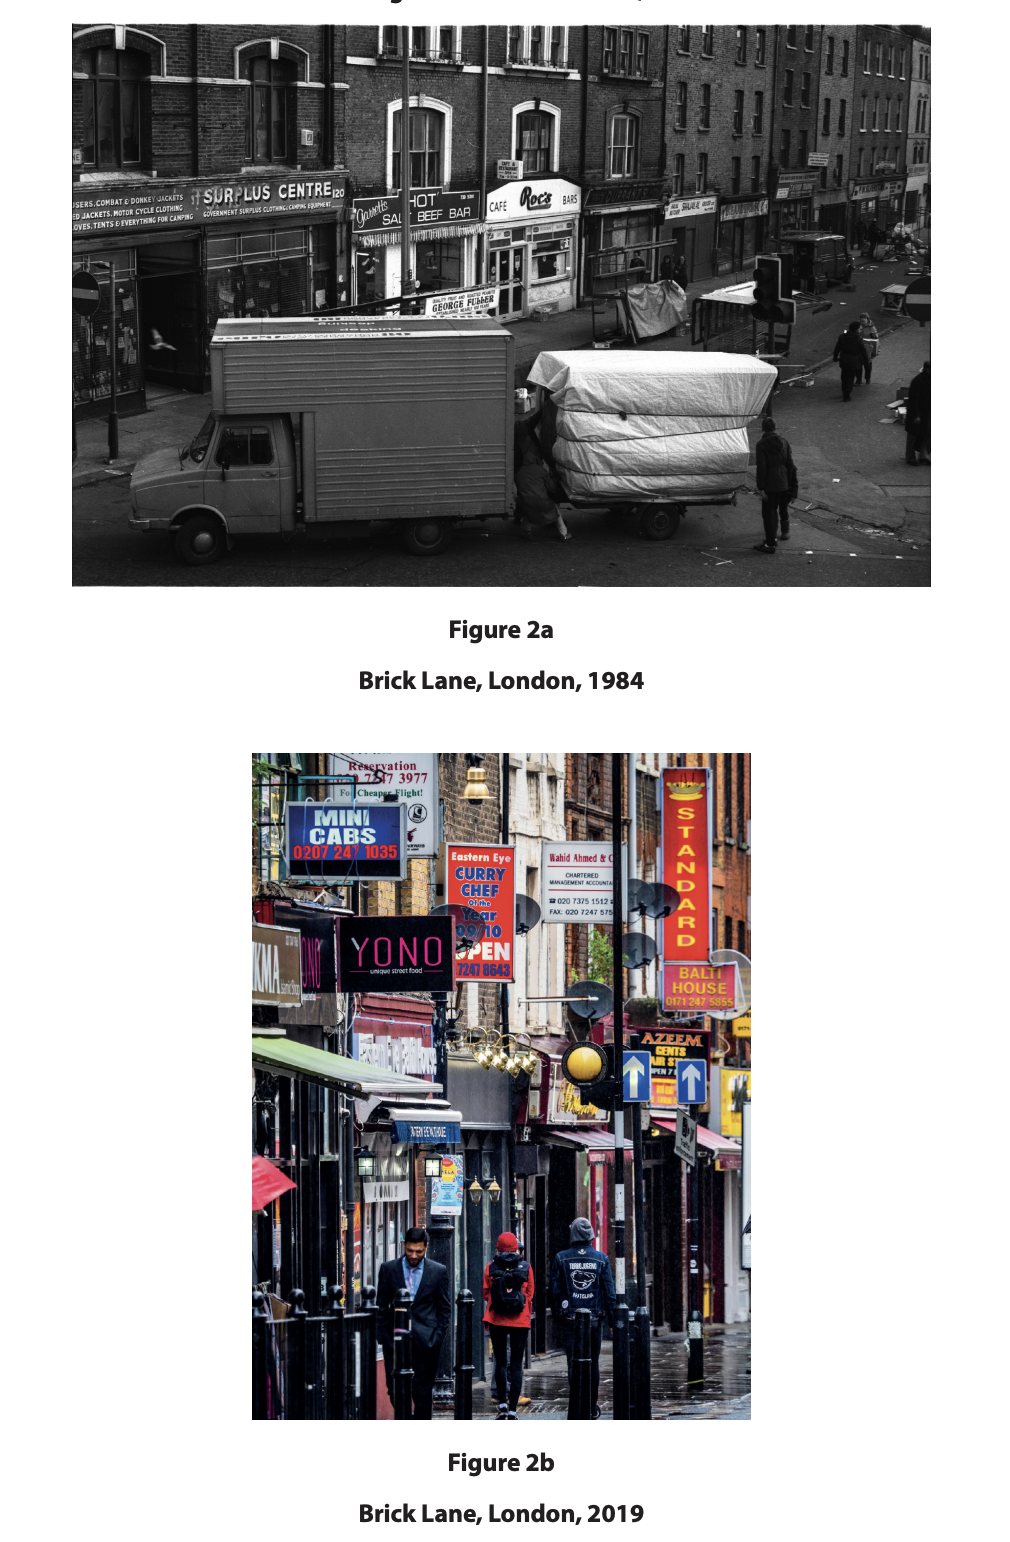
Explain why stakeholders often have different views about the changes taking place in urban areas such as Brick Lane.
Was this exam question helpful?
Study Figure 1, which shows changes planned in the regeneration of a London council estate.
Figure 1: Aylesbury Estate (South London) regeneration – selected outcomes
Feature | Before | After rebuild |
|---|---|---|
Existing flats | 370 (to be demolished) | residents temporarily rehomed |
Social rent homes | higher number | fewer |
Private homes | baseline | threefold increase |
Suggest why different stakeholders may disagree about whether this scheme has been successful.
Was this exam question helpful?
Study Figure 1, which shows measures of political engagement in the UK.
Figure 1: Measures of UK political engagement
Measure | Value |
|---|---|
2019 general election turnout (all eligible voters) | 67.3% |
Estimated eligible voters not registered (2019) | 9.4 million |
Ethnic minority groups who chose to vote | 52% |
Suggest why political engagement data are useful for assessing the integration of minority groups.
Was this exam question helpful?
Study Figure 1, which shows house prices in a popular rural area.
Figure 1: House prices in Ambleside, Lake District (2022)
Measure | Value |
|---|---|
Average house price | £512,733 |
Average flat price | £372,120 |
Most common type of sale | Flats |
Suggest why rising house prices in a rural area can create tension between stakeholders.
Was this exam question helpful?
With reference to a named example, explain how a partnership can manage change in a rural living space.
Was this exam question helpful?
With reference to a named example, explain how local community groups can manage cultural tension in an urban living space.
Was this exam question helpful?
With reference to named examples, explain how national government strategies attempt to manage change in urban living spaces.
Was this exam question helpful?
Evaluate why stakeholders in diverse communities use different criteria for measuring the success of managing change.
Was this exam question helpful?
Evaluate the view that successful urban management for some is likely to be unsuccessful for others.
Was this exam question helpful?
Evaluate the impact of government decisions on the demographic and cultural characteristics of either urban or rural places.
Was this exam question helpful?
Evaluate the success of different strategies in improving the image and reality of rural places.
Was this exam question helpful?
Evaluate the view that national government strategies are the most effective way of managing change in diverse places.
Was this exam question helpful?
Evaluate the view that the success of managing demographic and cultural change is impossible to measure objectively.
Was this exam question helpful?