Integrated Development Environment (IDE) (OCR A Level Computer Science): Revision Note
Exam code: H446

Integrated Development Environment (IDE)
What is an IDE?
An Integrated Development Environment (IDE) is a software tool that provides programmers with a comprehensive and integrated platform to write, edit, compile, debug, and manage their code efficiently
IDEs are designed to streamline the software development process by offering a wide range of features and tools that can help programmers
IDEs can be an app to download or can be web-based
Example IDE's
IDLE is a basic IDE that is used for writing and running Python code.
IDLE software which is used to write and run Python code
Another example IDE is Replit
This allows programmers to write and run code as well as collaborate with other programmers online
It supports many programming languages such as Python, JavaScript and C++.
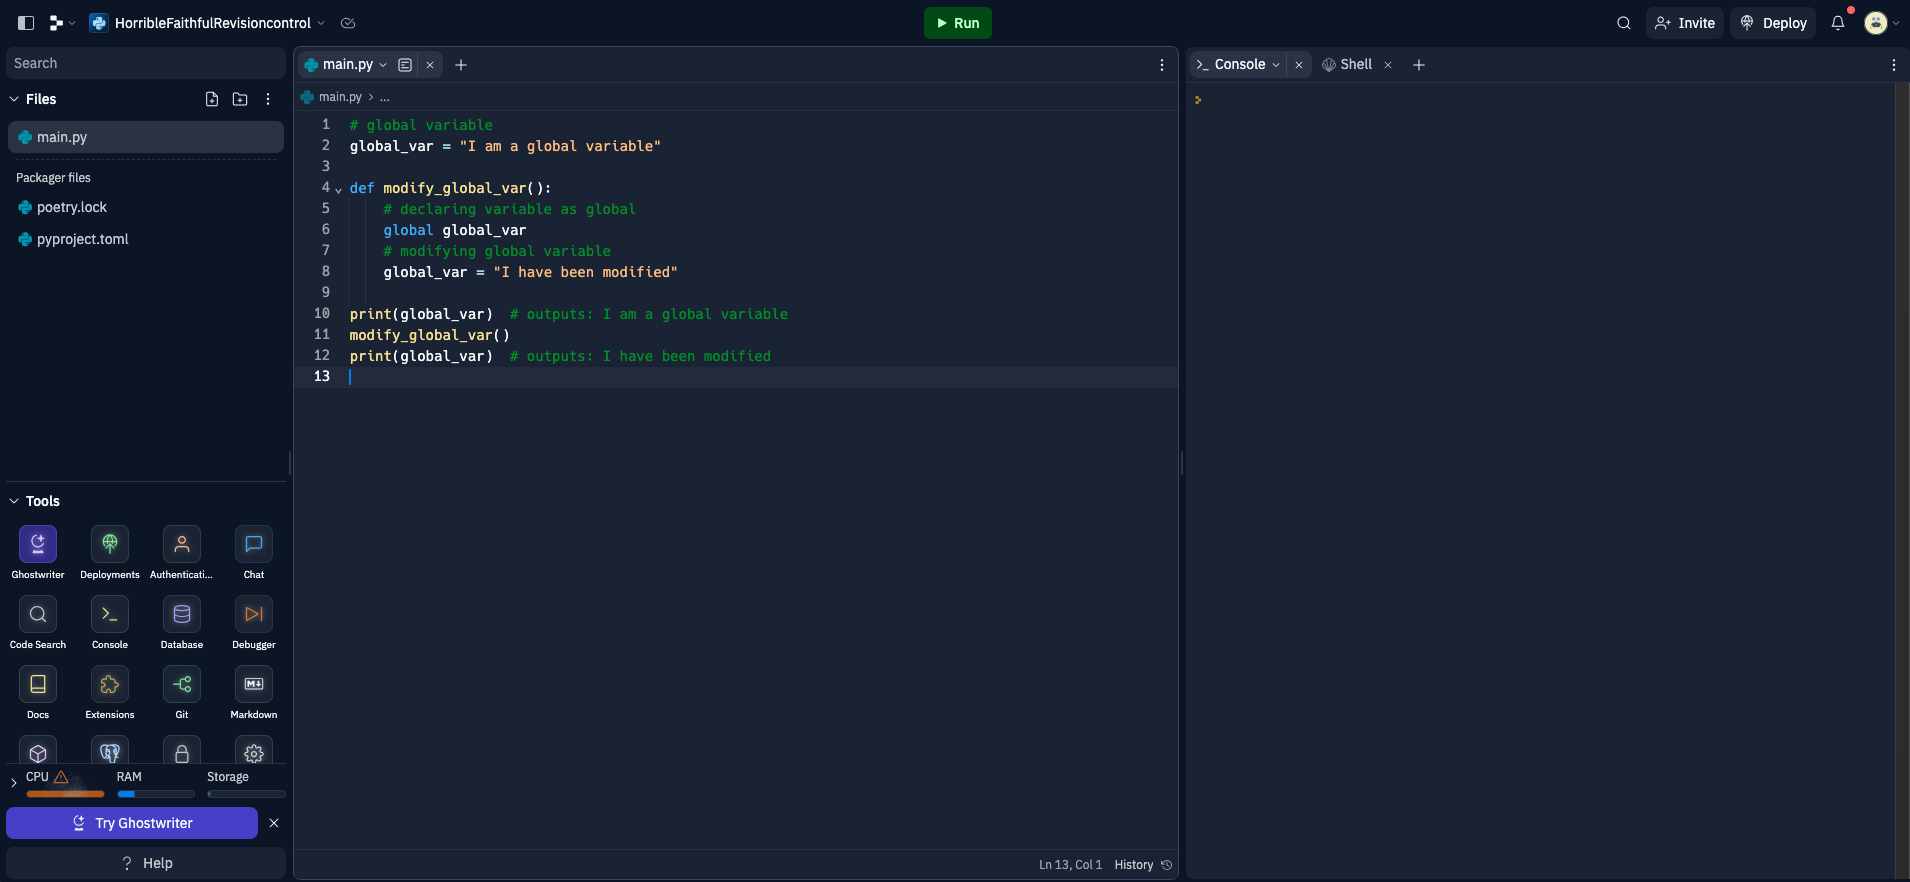
Replit which is web-based software used to write and run code in different languages
Examiner Tips and Tricks
Before answering questions on IDE's, make sure you read the question first.
Some questions may ask you to provide features of IDE's that can be used to:
write programming code
debug programming code
Some of the features that you have learnt cannot be used for both of these. For example autocomplete and auto indent can be used for writing programming code, however, are not useful for debugging programming code.
Features on an IDE
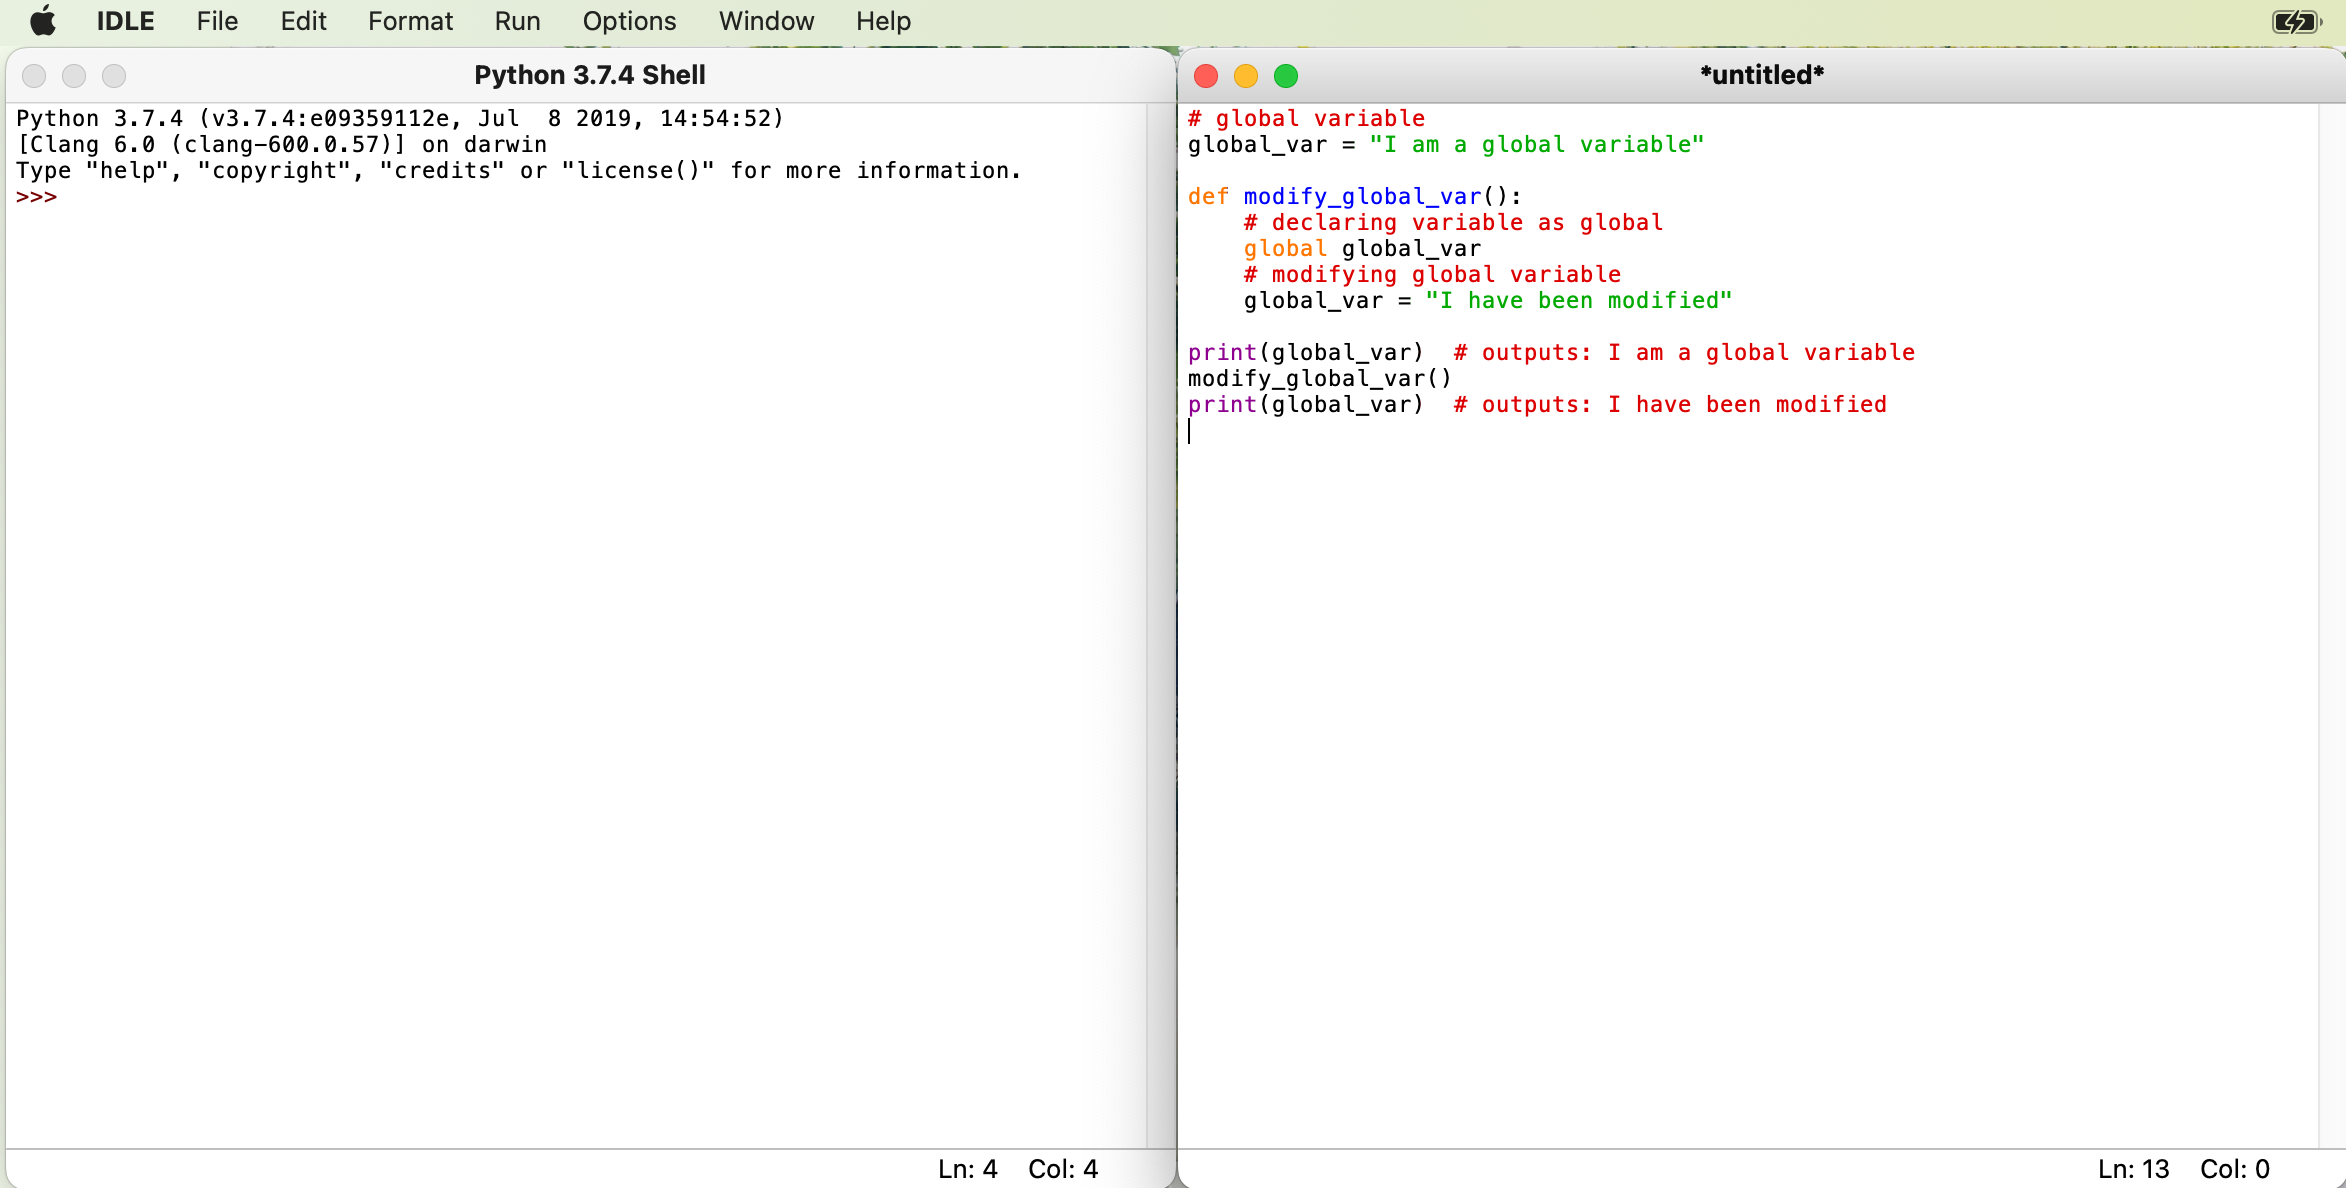
Syntax highlighting (pretty printing)
IDEs use syntax highlighting to visually distinguish different elements of code based on their syntax
The IDE assigns distinct colours or styles to keywords, strings, comments, variables, functions, and other language constructs
Syntax highlighting helps programmers quickly identify and differentiate code components, reducing the chance of syntax errors and improving code comprehension
In this example Python code, you can see that the code comments are displayed in red, the strings are displayed in green and the print commands are displayed in purple
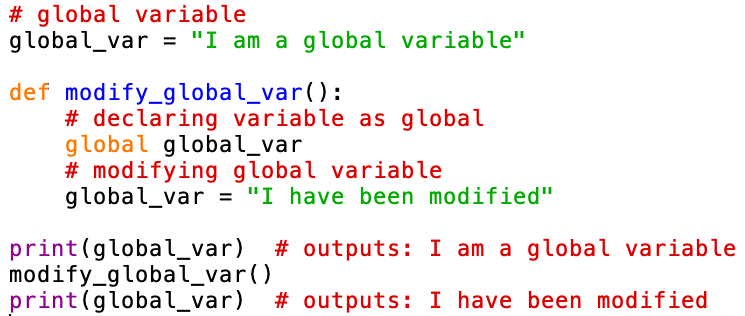
Syntax highlighting in an IDE
Autocomplete
Autocomplete will suggest code completions as programmers type
For example, as developers start typing a variable, function, or method name, the IDE displays a list of available options
Another example is when programmers use opening brackets and the autocomplete facility will automatically add closing brackets
Code completion improves productivity by reducing typing effort and preventing typing errors and naming inconsistencies
IDEs can automatically correct common mistakes or typing errors made during coding. When an error-prone sequence is detected, the IDE can suggest a correction, helping developers fix minor errors as they type their code
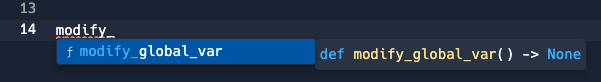
Code completion in an IDE
Auto indent
Auto indent will automatically indent the programming code when you start a new line of code within a code block
They are commonly used in selection and iteration programming constructs
In the example below, the indentation is automatic after starting to define the code block on line 04 and is clearly marked to show which lines of code are included within the block.
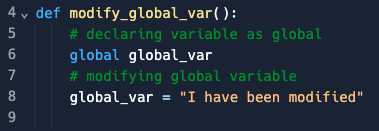
Code formatting with automatic indentation
Code comments
Comments are lines of text within the code that are not executed but serve as documentation and explanations for programmers
IDEs enable developers to add single-line or multi-line comments to describe the code's purpose, algorithmic steps, and any relevant information that will be useful to the maintenance of the program
Comments enhance code understanding, making it easier for developers to revisit and modify code at a later stage
Comments are in green on the image above
Syntax error highlighting
IDEs can automatically highlight syntax errors in the code editor as developers type
This feature helps catch mistakes instantly, allowing programmers to address syntax-related issues promptly
Syntax errors are highlighted with distinct colours, making them easily noticeable, even before executing the code
Variable watch window
The watch window is a debugging tool that allows developers to monitor the values of specific variables during runtime
Developers can add variables to the watch window and observe their values change as the program executes
This tool is particularly valuable for understanding how variables evolve throughout the program's execution and diagnosing issues related to variable values
Breakpoints
Breakpoints are markers that developers can set at specific lines of code to halt program execution during runtime
When the program reaches a breakpoint, it pauses, allowing developers to inspect the program's state and variable values and identify the cause of potential bugs
Breakpoints provide a controlled way to analyse code step-by-step
Error message list
The error message list displays a collection of errors, warnings, and messages generated during the compilation and execution of the program
IDEs present detailed error descriptions and relevant code locations, enabling programmers to address and correct issues systematically
Stepping mode
Stepping mode is a debugging mode that allows developers to execute the program one line at a time
Developers can choose between different step options, such as step into, step over, and step out, to examine function calls and control flow
Step mode offers a granular view of the program's execution, making it easier to identify the exact location of potential bugs
Crash dump/post-mortem report
When a program crashes, IDEs can generate a crash dump or post-mortem report
This report captures the program's state and memory contents at the time of the crash, helping developers diagnose the root cause of the crash after the program has terminated unexpectedly
Stack contents
The stack contents tool allows developers to inspect the contents of the program's call stack during debugging
It shows the order in which functions were called and the parameters and local variables of each function
Understanding the call stack, aids in understanding the program's flow and diagnosing issues related to function calls

Unlock more, it's free!
Join the 100,000+ Students that ❤️ Save My Exams
the (exam) results speak for themselves:

Was this revision note helpful?
Build on this topic