Efficiency Ratios (AQA A Level Business): Revision Note
Exam code: 7132

Introducing efficiency ratios
Efficiency ratios are valuable because they highlight how well a business manages its resources and operations, helping to identify areas where performance and cash flow can be improved
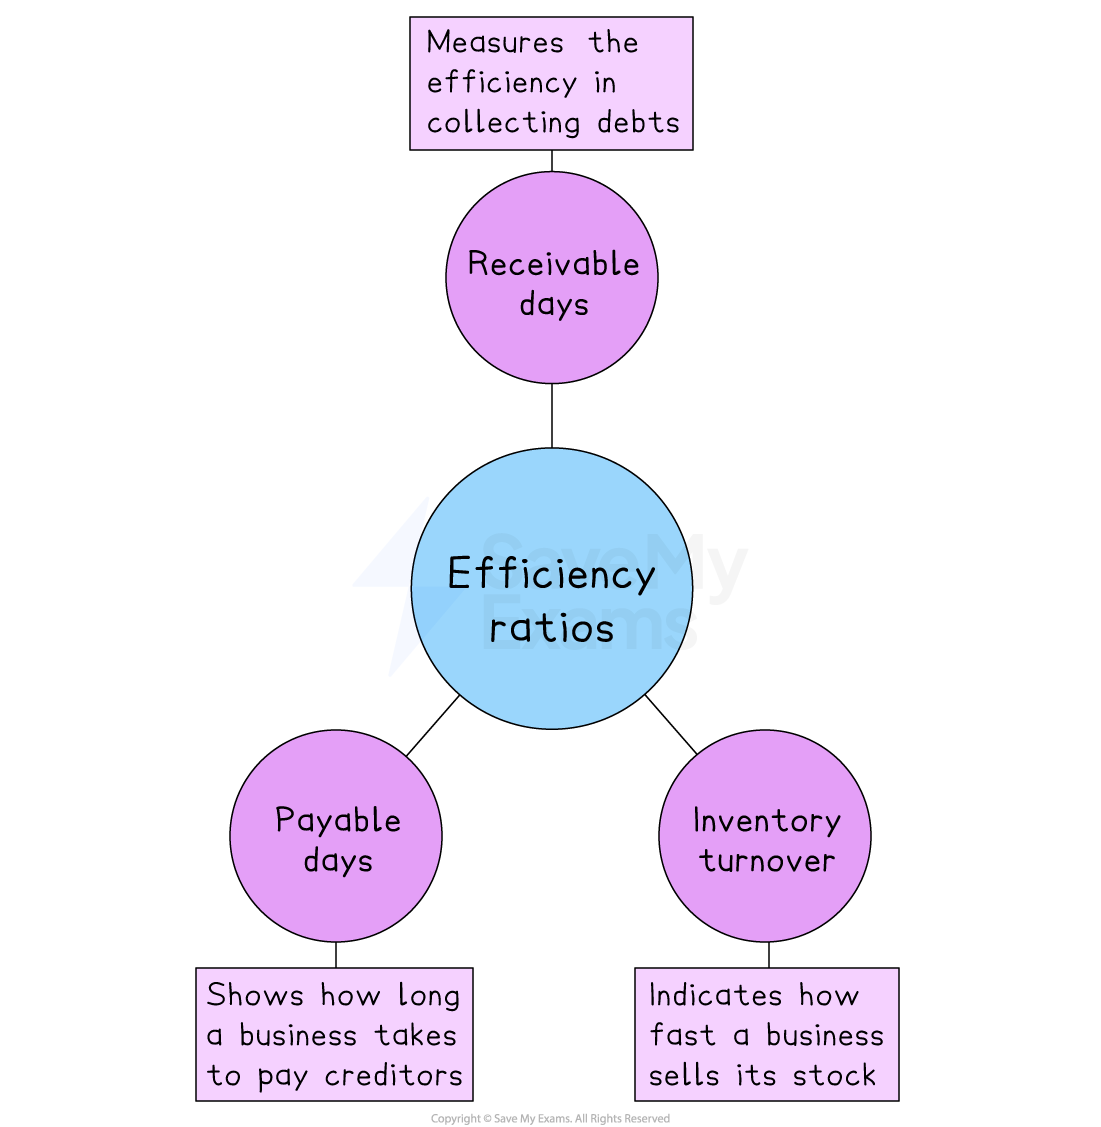
Payables days
Payables days measures the average number of days a business takes to pay invoices owed to creditors
It is calculated using the formula
![]()
Businesses generally aim for a high or increasing ratio
This indicates skills of negotiation in arranging extended credit terms with suppliers
Delaying payments to suppliers can improve cash flow
However, taking longer than agreed to pay outstanding invoices may have negative consequences
Relationships with important suppliers may worsen
They are less likely to extend further trade credit
Penalties may be issued for late payment
Orders may be delayed until payment is received
Creditworthiness may worsen
A business may fail credit checks
Unable to place orders with other suppliers
Less chance of obtaining trade credit elsewhere
Could impact applications for borrowing e.g. loans
Worked Example
YakPur Fashions is a manufacturer and exporter of high quality fashion outerwear
A selection of YakPur Fashions' financial performance indicators are shown in the table
Selected Financial Performance Data 2024 YakPur Fashions | |
|---|---|
| £ |
Inventory held on 1st January 2024 | 47,600 |
Credit Sales Revenue | 241,200 |
Cost of Sales | 112,400 |
Inventory held on 31st December 2024 | 26,000 |
Receivables on 31st December 2024 | 31,200 |
Payables on 31st December 2024 | 28,500 |
Calculate YakPur Fashion's payables days ratio for 2024.
[2]
Step 1: Multiply payables by 365
format('truetype')%3Bfont-weight%3Anormal%3Bfont-style%3Anormal%3B%7D%3C%2Fstyle%3E%3C%2Fdefs%3E%3Ctext%20font-family%3D%22math1995c9b895ce727fb7b1505a8b9%22%20font-size%3D%2216%22%20text-anchor%3D%22middle%22%20x%3D%228.5%22%20y%3D%2216%22%3E%3D%3C%2Ftext%3E%3Ctext%20font-family%3D%22Arial%22%20font-size%3D%2216%22%20text-anchor%3D%22middle%22%20x%3D%2227.5%22%20y%3D%2216%22%3E%26%23xA3%3B%3C%2Ftext%3E%3Ctext%20font-family%3D%22Arial%22%20font-size%3D%2216%22%20text-anchor%3D%22middle%22%20x%3D%2243.5%22%20y%3D%2216%22%3E28%3C%2Ftext%3E%3Ctext%20font-family%3D%22math1995c9b895ce727fb7b1505a8b9%22%20font-size%3D%2216%22%20text-anchor%3D%22middle%22%20x%3D%2254.5%22%20y%3D%2216%22%3E%2C%3C%2Ftext%3E%3Ctext%20font-family%3D%22Arial%22%20font-size%3D%2216%22%20text-anchor%3D%22middle%22%20x%3D%2270.5%22%20y%3D%2216%22%3E500%3C%2Ftext%3E%3Ctext%20font-family%3D%22math1995c9b895ce727fb7b1505a8b9%22%20font-size%3D%2216%22%20text-anchor%3D%22middle%22%20x%3D%2295.5%22%20y%3D%2216%22%3E%26%23xD7%3B%3C%2Ftext%3E%3Ctext%20font-family%3D%22Arial%22%20font-size%3D%2216%22%20text-anchor%3D%22middle%22%20x%3D%22120.5%22%20y%3D%2216%22%3E365%3C%2Ftext%3E%3Ctext%20font-family%3D%22math1995c9b895ce727fb7b1505a8b9%22%20font-size%3D%2216%22%20text-anchor%3D%22middle%22%20x%3D%228.5%22%20y%3D%2259%22%3E%3D%3C%2Ftext%3E%3Ctext%20font-family%3D%22Arial%22%20font-size%3D%2216%22%20text-anchor%3D%22middle%22%20x%3D%2227.5%22%20y%3D%2259%22%3E%26%23xA3%3B%3C%2Ftext%3E%3Ctext%20font-family%3D%22Arial%22%20font-size%3D%2216%22%20text-anchor%3D%22middle%22%20x%3D%2243.5%22%20y%3D%2259%22%3E10%3C%2Ftext%3E%3Ctext%20font-family%3D%22math1995c9b895ce727fb7b1505a8b9%22%20font-size%3D%2216%22%20text-anchor%3D%22middle%22%20x%3D%2254.5%22%20y%3D%2259%22%3E%2C%3C%2Ftext%3E%3Ctext%20font-family%3D%22Arial%22%20font-size%3D%2216%22%20text-anchor%3D%22middle%22%20x%3D%2270.5%22%20y%3D%2259%22%3E402%3C%2Ftext%3E%3Ctext%20font-family%3D%22math1995c9b895ce727fb7b1505a8b9%22%20font-size%3D%2216%22%20text-anchor%3D%22middle%22%20x%3D%2286.5%22%20y%3D%2259%22%3E%2C%3C%2Ftext%3E%3Ctext%20font-family%3D%22Arial%22%20font-size%3D%2216%22%20text-anchor%3D%22middle%22%20x%3D%22102.5%22%20y%3D%2259%22%3E500%3C%2Ftext%3E%3C%2Fsvg%3E) (1)
(1)
Step 2: Divide the outcome by cost of sales
format('truetype')%3Bfont-weight%3Anormal%3Bfont-style%3Anormal%3B%7D%3C%2Fstyle%3E%3C%2Fdefs%3E%3Ctext%20font-family%3D%22math1accd16a5c8686f1af84b300ff6%22%20font-size%3D%2216%22%20text-anchor%3D%22middle%22%20x%3D%228.5%22%20y%3D%2216%22%3E%3D%3C%2Ftext%3E%3Ctext%20font-family%3D%22Arial%22%20font-size%3D%2216%22%20text-anchor%3D%22middle%22%20x%3D%2227.5%22%20y%3D%2216%22%3E%26%23xA3%3B%3C%2Ftext%3E%3Ctext%20font-family%3D%22Arial%22%20font-size%3D%2216%22%20text-anchor%3D%22middle%22%20x%3D%2243.5%22%20y%3D%2216%22%3E10%3C%2Ftext%3E%3Ctext%20font-family%3D%22math1accd16a5c8686f1af84b300ff6%22%20font-size%3D%2216%22%20text-anchor%3D%22middle%22%20x%3D%2254.5%22%20y%3D%2216%22%3E%2C%3C%2Ftext%3E%3Ctext%20font-family%3D%22Arial%22%20font-size%3D%2216%22%20text-anchor%3D%22middle%22%20x%3D%2270.5%22%20y%3D%2216%22%3E402%3C%2Ftext%3E%3Ctext%20font-family%3D%22math1accd16a5c8686f1af84b300ff6%22%20font-size%3D%2216%22%20text-anchor%3D%22middle%22%20x%3D%2286.5%22%20y%3D%2216%22%3E%2C%3C%2Ftext%3E%3Ctext%20font-family%3D%22Arial%22%20font-size%3D%2216%22%20text-anchor%3D%22middle%22%20x%3D%22102.5%22%20y%3D%2216%22%3E500%3C%2Ftext%3E%3Ctext%20font-family%3D%22math1accd16a5c8686f1af84b300ff6%22%20font-size%3D%2216%22%20text-anchor%3D%22middle%22%20x%3D%22128.5%22%20y%3D%2216%22%3E%26%23xF7%3B%3C%2Ftext%3E%3Ctext%20font-family%3D%22Arial%22%20font-size%3D%2216%22%20text-anchor%3D%22middle%22%20x%3D%22146.5%22%20y%3D%2216%22%3E%26%23xA3%3B%3C%2Ftext%3E%3Ctext%20font-family%3D%22Arial%22%20font-size%3D%2216%22%20text-anchor%3D%22middle%22%20x%3D%22166.5%22%20y%3D%2216%22%3E112%3C%2Ftext%3E%3Ctext%20font-family%3D%22math1accd16a5c8686f1af84b300ff6%22%20font-size%3D%2216%22%20text-anchor%3D%22middle%22%20x%3D%22182.5%22%20y%3D%2216%22%3E%2C%3C%2Ftext%3E%3Ctext%20font-family%3D%22Arial%22%20font-size%3D%2216%22%20text-anchor%3D%22middle%22%20x%3D%22198.5%22%20y%3D%2216%22%3E400%3C%2Ftext%3E%3Ctext%20font-family%3D%22math1accd16a5c8686f1af84b300ff6%22%20font-size%3D%2216%22%20text-anchor%3D%22middle%22%20x%3D%228.5%22%20y%3D%2259%22%3E%3D%3C%2Ftext%3E%3Ctext%20font-family%3D%22Arial%22%20font-size%3D%2216%22%20text-anchor%3D%22middle%22%20x%3D%2230.5%22%20y%3D%2259%22%3E92%3C%2Ftext%3E%3Ctext%20font-family%3D%22math1accd16a5c8686f1af84b300ff6%22%20font-size%3D%2216%22%20text-anchor%3D%22middle%22%20x%3D%2241.5%22%20y%3D%2259%22%3E.%3C%2Ftext%3E%3Ctext%20font-family%3D%22Arial%22%20font-size%3D%2216%22%20text-anchor%3D%22middle%22%20x%3D%2253.5%22%20y%3D%2259%22%3E55%3C%2Ftext%3E%3Ctext%20font-family%3D%22Arial%22%20font-size%3D%2216%22%20text-anchor%3D%22middle%22%20x%3D%2283.5%22%20y%3D%2259%22%3Edays%3C%2Ftext%3E%3C%2Fsvg%3E) (1)
(1)
Yakpur takes an average of 92.55 days to settle supplier invoices
Improving the payables days ratio
Method | Explanation |
|---|---|
Develop close relationships with suppliers |
|
Improve the business's credit rating |
|
Seek suppliers that offer extended trade credit terms |
|
Receivables days
Receivables days measures the average number of days it takes for a business to collect money from its debtors
Businesses often provide a period of trade credit to customers
In the UK 30 to 60 days is typical
The growth of promotional 'buy now, pay later' deals has increased the level of debtors for some businesses
It is calculated using the formula
![]()
Businesses aim for a low or reducing ratio
This indicates efficiency in collecting outstanding debts from credit customers
Collecting debts promptly can improve cash flow
Worked Example
YakPur Fashions is a manufacturer and exporter of high quality fashion outerwear
A selection of YakPur Fashions' financial performance indicators are shown in the table
Selected Financial Performance Data 2024 YakPur Fashions | |
|---|---|
| £ |
Inventory held on 1st January 2024 | 47,600 |
Credit Sales Revenue | 241,200 |
Cost of Sales | 112,400 |
Inventory held on 31st December 2024 | 26,000 |
Receivables on 31st December 2024 | 31,200 |
Payables on 31st December 2024 | 28,500 |
(a) Calculate YakPur Fashion's receivables days ratio for 2024.
(2 marks)
Step 1: Multiply receivables by 365
format('truetype')%3Bfont-weight%3Anormal%3Bfont-style%3Anormal%3B%7D%3C%2Fstyle%3E%3C%2Fdefs%3E%3Ctext%20font-family%3D%22math1995c9b895ce727fb7b1505a8b9%22%20font-size%3D%2216%22%20text-anchor%3D%22middle%22%20x%3D%228.5%22%20y%3D%2216%22%3E%3D%3C%2Ftext%3E%3Ctext%20font-family%3D%22Arial%22%20font-size%3D%2216%22%20text-anchor%3D%22middle%22%20x%3D%2227.5%22%20y%3D%2216%22%3E%26%23xA3%3B%3C%2Ftext%3E%3Ctext%20font-family%3D%22Arial%22%20font-size%3D%2216%22%20text-anchor%3D%22middle%22%20x%3D%2243.5%22%20y%3D%2216%22%3E31%3C%2Ftext%3E%3Ctext%20font-family%3D%22math1995c9b895ce727fb7b1505a8b9%22%20font-size%3D%2216%22%20text-anchor%3D%22middle%22%20x%3D%2254.5%22%20y%3D%2216%22%3E%2C%3C%2Ftext%3E%3Ctext%20font-family%3D%22Arial%22%20font-size%3D%2216%22%20text-anchor%3D%22middle%22%20x%3D%2270.5%22%20y%3D%2216%22%3E200%3C%2Ftext%3E%3Ctext%20font-family%3D%22math1995c9b895ce727fb7b1505a8b9%22%20font-size%3D%2216%22%20text-anchor%3D%22middle%22%20x%3D%2295.5%22%20y%3D%2216%22%3E%26%23xD7%3B%3C%2Ftext%3E%3Ctext%20font-family%3D%22Arial%22%20font-size%3D%2216%22%20text-anchor%3D%22middle%22%20x%3D%22120.5%22%20y%3D%2216%22%3E365%3C%2Ftext%3E%3Ctext%20font-family%3D%22math1995c9b895ce727fb7b1505a8b9%22%20font-size%3D%2216%22%20text-anchor%3D%22middle%22%20x%3D%228.5%22%20y%3D%2259%22%3E%3D%3C%2Ftext%3E%3Ctext%20font-family%3D%22Arial%22%20font-size%3D%2216%22%20text-anchor%3D%22middle%22%20x%3D%2227.5%22%20y%3D%2259%22%3E%26%23xA3%3B%3C%2Ftext%3E%3Ctext%20font-family%3D%22Arial%22%20font-size%3D%2216%22%20text-anchor%3D%22middle%22%20x%3D%2243.5%22%20y%3D%2259%22%3E11%3C%2Ftext%3E%3Ctext%20font-family%3D%22math1995c9b895ce727fb7b1505a8b9%22%20font-size%3D%2216%22%20text-anchor%3D%22middle%22%20x%3D%2254.5%22%20y%3D%2259%22%3E%2C%3C%2Ftext%3E%3Ctext%20font-family%3D%22Arial%22%20font-size%3D%2216%22%20text-anchor%3D%22middle%22%20x%3D%2270.5%22%20y%3D%2259%22%3E388%3C%2Ftext%3E%3Ctext%20font-family%3D%22math1995c9b895ce727fb7b1505a8b9%22%20font-size%3D%2216%22%20text-anchor%3D%22middle%22%20x%3D%2286.5%22%20y%3D%2259%22%3E%2C%3C%2Ftext%3E%3Ctext%20font-family%3D%22Arial%22%20font-size%3D%2216%22%20text-anchor%3D%22middle%22%20x%3D%22102.5%22%20y%3D%2259%22%3E000%3C%2Ftext%3E%3C%2Fsvg%3E) (1)
(1)
Step 2: Divide the outcome by revenue
format('truetype')%3Bfont-weight%3Anormal%3Bfont-style%3Anormal%3B%7D%3C%2Fstyle%3E%3C%2Fdefs%3E%3Ctext%20font-family%3D%22math1accd16a5c8686f1af84b300ff6%22%20font-size%3D%2216%22%20text-anchor%3D%22middle%22%20x%3D%228.5%22%20y%3D%2216%22%3E%3D%3C%2Ftext%3E%3Ctext%20font-family%3D%22Arial%22%20font-size%3D%2216%22%20text-anchor%3D%22middle%22%20x%3D%2227.5%22%20y%3D%2216%22%3E%26%23xA3%3B%3C%2Ftext%3E%3Ctext%20font-family%3D%22Arial%22%20font-size%3D%2216%22%20text-anchor%3D%22middle%22%20x%3D%2243.5%22%20y%3D%2216%22%3E11%3C%2Ftext%3E%3Ctext%20font-family%3D%22math1accd16a5c8686f1af84b300ff6%22%20font-size%3D%2216%22%20text-anchor%3D%22middle%22%20x%3D%2254.5%22%20y%3D%2216%22%3E%2C%3C%2Ftext%3E%3Ctext%20font-family%3D%22Arial%22%20font-size%3D%2216%22%20text-anchor%3D%22middle%22%20x%3D%2270.5%22%20y%3D%2216%22%3E388%3C%2Ftext%3E%3Ctext%20font-family%3D%22math1accd16a5c8686f1af84b300ff6%22%20font-size%3D%2216%22%20text-anchor%3D%22middle%22%20x%3D%2286.5%22%20y%3D%2216%22%3E%2C%3C%2Ftext%3E%3Ctext%20font-family%3D%22Arial%22%20font-size%3D%2216%22%20text-anchor%3D%22middle%22%20x%3D%22102.5%22%20y%3D%2216%22%3E000%3C%2Ftext%3E%3Ctext%20font-family%3D%22math1accd16a5c8686f1af84b300ff6%22%20font-size%3D%2216%22%20text-anchor%3D%22middle%22%20x%3D%22128.5%22%20y%3D%2216%22%3E%26%23xF7%3B%3C%2Ftext%3E%3Ctext%20font-family%3D%22Arial%22%20font-size%3D%2216%22%20text-anchor%3D%22middle%22%20x%3D%22146.5%22%20y%3D%2216%22%3E%26%23xA3%3B%3C%2Ftext%3E%3Ctext%20font-family%3D%22Arial%22%20font-size%3D%2216%22%20text-anchor%3D%22middle%22%20x%3D%22166.5%22%20y%3D%2216%22%3E241%3C%2Ftext%3E%3Ctext%20font-family%3D%22math1accd16a5c8686f1af84b300ff6%22%20font-size%3D%2216%22%20text-anchor%3D%22middle%22%20x%3D%22182.5%22%20y%3D%2216%22%3E%2C%3C%2Ftext%3E%3Ctext%20font-family%3D%22Arial%22%20font-size%3D%2216%22%20text-anchor%3D%22middle%22%20x%3D%22198.5%22%20y%3D%2216%22%3E200%3C%2Ftext%3E%3Ctext%20font-family%3D%22math1accd16a5c8686f1af84b300ff6%22%20font-size%3D%2216%22%20text-anchor%3D%22middle%22%20x%3D%228.5%22%20y%3D%2259%22%3E%3D%3C%2Ftext%3E%3Ctext%20font-family%3D%22Arial%22%20font-size%3D%2216%22%20text-anchor%3D%22middle%22%20x%3D%2230.5%22%20y%3D%2259%22%3E47%3C%2Ftext%3E%3Ctext%20font-family%3D%22math1accd16a5c8686f1af84b300ff6%22%20font-size%3D%2216%22%20text-anchor%3D%22middle%22%20x%3D%2241.5%22%20y%3D%2259%22%3E.%3C%2Ftext%3E%3Ctext%20font-family%3D%22Arial%22%20font-size%3D%2216%22%20text-anchor%3D%22middle%22%20x%3D%2253.5%22%20y%3D%2259%22%3E21%3C%2Ftext%3E%3Ctext%20font-family%3D%22Arial%22%20font-size%3D%2216%22%20text-anchor%3D%22middle%22%20x%3D%2283.5%22%20y%3D%2259%22%3Edays%3C%2Ftext%3E%3C%2Fsvg%3E) (1)
(1)
It takes YakPur Fashions an average of 47.21 days to collect money owing from debtors
Ways to reduce the receivables days ratio
Method | Explanation |
|---|---|
Streamline invoicing and credit control processes |
|
Establish and monitor creditworthiness of customers |
|
Improve payment systems |
|
Provide incentives for early payment |
|
If these methods fail to persuade customers to pay their invoices on time a business has a range of further options. These methods should be pursued with caution as relationships with customers may be damaged
Further ways to reduce the receivables days ratio
Method | Explanation |
|---|---|
Refuse to provide further goods unless outstanding debts are paid |
|
Threaten to take legal action |
|
Comparing payables days and receivables days
Comparing receivables days and payables days helps assess how well a business manages its cash flow and short-term liquidity
If receivables days are greater than payables days, the business waits longer to collect cash than it does to pay suppliers
This creates a cash outflow gap that must be financed from cash reserves or borrowing, reducing liquidity
Conversely, if payables days are greater than receivables days, suppliers effectively finance the business
This eases the pressure on liquidity, so the business can meet its short-term obligations without running out of cash
Inventory turnover
The inventory turnover ratio shows how well a business converts its stock into sales
Before calculating inventory turnover it is first necessary to calculate the average value of stock held by a business in a given period
It is calculated using the formula
![]()
Calculating the inventory turnover ratio
Inventory turnover can then be calculated in two ways
The number of times a business sells all of its stock during a period (usually a year)
![]()
Businesses aim for a high or increasing ratio
More stock sold means that it is generating profit more efficiently
Perishable goods are less likely to be wasted
The number of days taken to sell all of its stock
![]()
Businesses aim for a low or falling ratio
Selling stock quickly means profit is achieved swiftly
Less likely to hold obsolete stock that may need to be sold at a loss
Worked Example
YakPur Fashions is a manufacturer and exporter of high quality fashion outerwear
A selection of YakPur Fashions' financial performance indicators are shown in the table
Selected Financial Performance Data 2024 YakPur Fashions | |
|---|---|
| £ |
Inventory held on 1st January 2024 | 47,600 |
Credit Sales Revenue | 241,200 |
Cost of Sales | 112,400 |
Inventory held on 31st December 2024 | 26,000 |
Receivables on 31st December 2024 | 31,200 |
Payables on 31st December 2024 | 28,500 |
(a) Calculate YakPur Fashions' inventory turnover ratio for 2022
(i) in terms of the number of times inventory was sold during the year
(ii) in terms of the number of days taken to sell all inventory.
[4]
Step 1: Calculate the average value of inventory
format('truetype')%3Bfont-weight%3Anormal%3Bfont-style%3Anormal%3B%7D%3C%2Fstyle%3E%3C%2Fdefs%3E%3Cline%20stroke%3D%22%23000000%22%20stroke-linecap%3D%22square%22%20stroke-width%3D%221%22%20x1%3D%222.5%22%20x2%3D%22279.5%22%20y1%3D%2221.5%22%20y2%3D%2221.5%22%2F%3E%3Ctext%20font-family%3D%22Arial%22%20font-size%3D%2216%22%20text-anchor%3D%22middle%22%20x%3D%2234.5%22%20y%3D%2216%22%3EOpening%3C%2Ftext%3E%3Ctext%20font-family%3D%22Arial%22%20font-size%3D%2216%22%20text-anchor%3D%22middle%22%20x%3D%22100.5%22%20y%3D%2216%22%3Einventory%3C%2Ftext%3E%3Ctext%20font-family%3D%22math1b5bdfceef335582fcc862bf999%22%20font-size%3D%2216%22%20text-anchor%3D%22middle%22%20x%3D%22144.5%22%20y%3D%2216%22%3E%2B%3C%2Ftext%3E%3Ctext%20font-family%3D%22Arial%22%20font-size%3D%2216%22%20text-anchor%3D%22middle%22%20x%3D%22182.5%22%20y%3D%2216%22%3EClosing%3C%2Ftext%3E%3Ctext%20font-family%3D%22Arial%22%20font-size%3D%2216%22%20text-anchor%3D%22middle%22%20x%3D%22245.5%22%20y%3D%2216%22%3Einventory%3C%2Ftext%3E%3Ctext%20font-family%3D%22Arial%22%20font-size%3D%2216%22%20text-anchor%3D%22middle%22%20x%3D%22141.5%22%20y%3D%2238%22%3E2%3C%2Ftext%3E%3Ctext%20font-family%3D%22math1b5bdfceef335582fcc862bf999%22%20font-size%3D%2216%22%20text-anchor%3D%22middle%22%20x%3D%228.5%22%20y%3D%2292%22%3E%3D%3C%2Ftext%3E%3Cline%20stroke%3D%22%23000000%22%20stroke-linecap%3D%22square%22%20stroke-width%3D%221%22%20x1%3D%2223.5%22%20x2%3D%22175.5%22%20y1%3D%2286.5%22%20y2%3D%2286.5%22%2F%3E%3Ctext%20font-family%3D%22Arial%22%20font-size%3D%2216%22%20text-anchor%3D%22middle%22%20x%3D%2231.5%22%20y%3D%2281%22%3E%26%23xA3%3B%3C%2Ftext%3E%3Ctext%20font-family%3D%22Arial%22%20font-size%3D%2216%22%20text-anchor%3D%22middle%22%20x%3D%2247.5%22%20y%3D%2281%22%3E47%3C%2Ftext%3E%3Ctext%20font-family%3D%22math1b5bdfceef335582fcc862bf999%22%20font-size%3D%2216%22%20text-anchor%3D%22middle%22%20x%3D%2258.5%22%20y%3D%2281%22%3E%2C%3C%2Ftext%3E%3Ctext%20font-family%3D%22Arial%22%20font-size%3D%2216%22%20text-anchor%3D%22middle%22%20x%3D%2274.5%22%20y%3D%2281%22%3E600%3C%2Ftext%3E%3Ctext%20font-family%3D%22math1b5bdfceef335582fcc862bf999%22%20font-size%3D%2216%22%20text-anchor%3D%22middle%22%20x%3D%2299.5%22%20y%3D%2281%22%3E%2B%3C%2Ftext%3E%3Ctext%20font-family%3D%22Arial%22%20font-size%3D%2216%22%20text-anchor%3D%22middle%22%20x%3D%22117.5%22%20y%3D%2281%22%3E%26%23xA3%3B%3C%2Ftext%3E%3Ctext%20font-family%3D%22Arial%22%20font-size%3D%2216%22%20text-anchor%3D%22middle%22%20x%3D%22133.5%22%20y%3D%2281%22%3E26%3C%2Ftext%3E%3Ctext%20font-family%3D%22math1b5bdfceef335582fcc862bf999%22%20font-size%3D%2216%22%20text-anchor%3D%22middle%22%20x%3D%22144.5%22%20y%3D%2281%22%3E%2C%3C%2Ftext%3E%3Ctext%20font-family%3D%22Arial%22%20font-size%3D%2216%22%20text-anchor%3D%22middle%22%20x%3D%22160.5%22%20y%3D%2281%22%3E000%3C%2Ftext%3E%3Ctext%20font-family%3D%22Arial%22%20font-size%3D%2216%22%20text-anchor%3D%22middle%22%20x%3D%2299.5%22%20y%3D%22103%22%3E2%3C%2Ftext%3E%3Ctext%20font-family%3D%22math1b5bdfceef335582fcc862bf999%22%20font-size%3D%2216%22%20text-anchor%3D%22middle%22%20x%3D%228.5%22%20y%3D%22146%22%3E%3D%3C%2Ftext%3E%3Ctext%20font-family%3D%22Arial%22%20font-size%3D%2216%22%20text-anchor%3D%22middle%22%20x%3D%2227.5%22%20y%3D%22146%22%3E%26%23xA3%3B%3C%2Ftext%3E%3Ctext%20font-family%3D%22Arial%22%20font-size%3D%2216%22%20text-anchor%3D%22middle%22%20x%3D%2243.5%22%20y%3D%22146%22%3E36%3C%2Ftext%3E%3Ctext%20font-family%3D%22math1b5bdfceef335582fcc862bf999%22%20font-size%3D%2216%22%20text-anchor%3D%22middle%22%20x%3D%2254.5%22%20y%3D%22146%22%3E%2C%3C%2Ftext%3E%3Ctext%20font-family%3D%22Arial%22%20font-size%3D%2216%22%20text-anchor%3D%22middle%22%20x%3D%2270.5%22%20y%3D%22146%22%3E800%3C%2Ftext%3E%3C%2Fsvg%3E) (1)
(1)
Step 2: Calculate the number of times stock sold during the year
format('truetype')%3Bfont-weight%3Anormal%3Bfont-style%3Anormal%3B%7D%3C%2Fstyle%3E%3C%2Fdefs%3E%3Cline%20stroke%3D%22%23000000%22%20stroke-linecap%3D%22square%22%20stroke-width%3D%221%22%20x1%3D%222.5%22%20x2%3D%22134.5%22%20y1%3D%2221.5%22%20y2%3D%2221.5%22%2F%3E%3Ctext%20font-family%3D%22Arial%22%20font-size%3D%2216%22%20text-anchor%3D%22middle%22%20x%3D%2239.5%22%20y%3D%2216%22%3ECost%3C%2Ftext%3E%3Ctext%20font-family%3D%22Arial%22%20font-size%3D%2216%22%20text-anchor%3D%22middle%22%20x%3D%2266.5%22%20y%3D%2216%22%3Eof%3C%2Ftext%3E%3Ctext%20font-family%3D%22Arial%22%20font-size%3D%2216%22%20text-anchor%3D%22middle%22%20x%3D%2295.5%22%20y%3D%2216%22%3Esales%3C%2Ftext%3E%3Ctext%20font-family%3D%22Arial%22%20font-size%3D%2216%22%20text-anchor%3D%22middle%22%20x%3D%2234.5%22%20y%3D%2239%22%3EAverage%3C%2Ftext%3E%3Ctext%20font-family%3D%22Arial%22%20font-size%3D%2216%22%20text-anchor%3D%22middle%22%20x%3D%22100.5%22%20y%3D%2239%22%3Einventory%3C%2Ftext%3E%3Ctext%20font-family%3D%22math1441a2c6ef28893a9f43fb56770%22%20font-size%3D%2216%22%20text-anchor%3D%22middle%22%20x%3D%228.5%22%20y%3D%2293%22%3E%3D%3C%2Ftext%3E%3Cline%20stroke%3D%22%23000000%22%20stroke-linecap%3D%22square%22%20stroke-width%3D%221%22%20x1%3D%2223.5%22%20x2%3D%2298.5%22%20y1%3D%2287.5%22%20y2%3D%2287.5%22%2F%3E%3Ctext%20font-family%3D%22Arial%22%20font-size%3D%2216%22%20text-anchor%3D%22middle%22%20x%3D%2231.5%22%20y%3D%2282%22%3E%26%23xA3%3B%3C%2Ftext%3E%3Ctext%20font-family%3D%22Arial%22%20font-size%3D%2216%22%20text-anchor%3D%22middle%22%20x%3D%2251.5%22%20y%3D%2282%22%3E112%3C%2Ftext%3E%3Ctext%20font-family%3D%22math1441a2c6ef28893a9f43fb56770%22%20font-size%3D%2216%22%20text-anchor%3D%22middle%22%20x%3D%2267.5%22%20y%3D%2282%22%3E%2C%3C%2Ftext%3E%3Ctext%20font-family%3D%22Arial%22%20font-size%3D%2216%22%20text-anchor%3D%22middle%22%20x%3D%2283.5%22%20y%3D%2282%22%3E400%3C%2Ftext%3E%3Ctext%20font-family%3D%22Arial%22%20font-size%3D%2216%22%20text-anchor%3D%22middle%22%20x%3D%2236.5%22%20y%3D%22105%22%3E%26%23xA3%3B%3C%2Ftext%3E%3Ctext%20font-family%3D%22Arial%22%20font-size%3D%2216%22%20text-anchor%3D%22middle%22%20x%3D%2252.5%22%20y%3D%22105%22%3E36%3C%2Ftext%3E%3Ctext%20font-family%3D%22math1441a2c6ef28893a9f43fb56770%22%20font-size%3D%2216%22%20text-anchor%3D%22middle%22%20x%3D%2263.5%22%20y%3D%22105%22%3E%2C%3C%2Ftext%3E%3Ctext%20font-family%3D%22Arial%22%20font-size%3D%2216%22%20text-anchor%3D%22middle%22%20x%3D%2279.5%22%20y%3D%22105%22%3E800%3C%2Ftext%3E%3Ctext%20font-family%3D%22math1441a2c6ef28893a9f43fb56770%22%20font-size%3D%2216%22%20text-anchor%3D%22middle%22%20x%3D%228.5%22%20y%3D%22148%22%3E%3D%3C%2Ftext%3E%3Ctext%20font-family%3D%22Arial%22%20font-size%3D%2216%22%20text-anchor%3D%22middle%22%20x%3D%2225.5%22%20y%3D%22148%22%3E3%3C%2Ftext%3E%3Ctext%20font-family%3D%22math1441a2c6ef28893a9f43fb56770%22%20font-size%3D%2216%22%20text-anchor%3D%22middle%22%20x%3D%2232.5%22%20y%3D%22148%22%3E.%3C%2Ftext%3E%3Ctext%20font-family%3D%22Arial%22%20font-size%3D%2216%22%20text-anchor%3D%22middle%22%20x%3D%2244.5%22%20y%3D%22148%22%3E05%3C%2Ftext%3E%3Ctext%20font-family%3D%22Arial%22%20font-size%3D%2216%22%20text-anchor%3D%22middle%22%20x%3D%2276.5%22%20y%3D%22148%22%3Etimes%3C%2Ftext%3E%3C%2Fsvg%3E) (1)
(1)
Step 3: Calculate the number of days taken to sell stock
format('truetype')%3Bfont-weight%3Anormal%3Bfont-style%3Anormal%3B%7D%3C%2Fstyle%3E%3C%2Fdefs%3E%3Cline%20stroke%3D%22%23000000%22%20stroke-linecap%3D%22square%22%20stroke-width%3D%221%22%20x1%3D%222.5%22%20x2%3D%22184.5%22%20y1%3D%2221.5%22%20y2%3D%2221.5%22%2F%3E%3Ctext%20font-family%3D%22Arial%22%20font-size%3D%2216%22%20text-anchor%3D%22middle%22%20x%3D%2234.5%22%20y%3D%2216%22%3EAverage%3C%2Ftext%3E%3Ctext%20font-family%3D%22Arial%22%20font-size%3D%2216%22%20text-anchor%3D%22middle%22%20x%3D%22100.5%22%20y%3D%2216%22%3Einventory%3C%2Ftext%3E%3Ctext%20font-family%3D%22math184975f6f12cf02d48a427fe25f%22%20font-size%3D%2216%22%20text-anchor%3D%22middle%22%20x%3D%22144.5%22%20y%3D%2216%22%3E%26%23xD7%3B%3C%2Ftext%3E%3Ctext%20font-family%3D%22Arial%22%20font-size%3D%2216%22%20text-anchor%3D%22middle%22%20x%3D%22169.5%22%20y%3D%2216%22%3E365%3C%2Ftext%3E%3Ctext%20font-family%3D%22Arial%22%20font-size%3D%2216%22%20text-anchor%3D%22middle%22%20x%3D%2264.5%22%20y%3D%2239%22%3ECost%3C%2Ftext%3E%3Ctext%20font-family%3D%22Arial%22%20font-size%3D%2216%22%20text-anchor%3D%22middle%22%20x%3D%2291.5%22%20y%3D%2239%22%3Eof%3C%2Ftext%3E%3Ctext%20font-family%3D%22Arial%22%20font-size%3D%2216%22%20text-anchor%3D%22middle%22%20x%3D%22120.5%22%20y%3D%2239%22%3Esales%3C%2Ftext%3E%3Ctext%20font-family%3D%22math184975f6f12cf02d48a427fe25f%22%20font-size%3D%2216%22%20text-anchor%3D%22middle%22%20x%3D%228.5%22%20y%3D%2293%22%3E%3D%3C%2Ftext%3E%3Cline%20stroke%3D%22%23000000%22%20stroke-linecap%3D%22square%22%20stroke-width%3D%221%22%20x1%3D%2223.5%22%20x2%3D%22139.5%22%20y1%3D%2287.5%22%20y2%3D%2287.5%22%2F%3E%3Ctext%20font-family%3D%22Arial%22%20font-size%3D%2216%22%20text-anchor%3D%22middle%22%20x%3D%2231.5%22%20y%3D%2282%22%3E%26%23xA3%3B%3C%2Ftext%3E%3Ctext%20font-family%3D%22Arial%22%20font-size%3D%2216%22%20text-anchor%3D%22middle%22%20x%3D%2247.5%22%20y%3D%2282%22%3E36%3C%2Ftext%3E%3Ctext%20font-family%3D%22math184975f6f12cf02d48a427fe25f%22%20font-size%3D%2216%22%20text-anchor%3D%22middle%22%20x%3D%2258.5%22%20y%3D%2282%22%3E%2C%3C%2Ftext%3E%3Ctext%20font-family%3D%22Arial%22%20font-size%3D%2216%22%20text-anchor%3D%22middle%22%20x%3D%2274.5%22%20y%3D%2282%22%3E800%3C%2Ftext%3E%3Ctext%20font-family%3D%22math184975f6f12cf02d48a427fe25f%22%20font-size%3D%2216%22%20text-anchor%3D%22middle%22%20x%3D%2299.5%22%20y%3D%2282%22%3E%26%23xD7%3B%3C%2Ftext%3E%3Ctext%20font-family%3D%22Arial%22%20font-size%3D%2216%22%20text-anchor%3D%22middle%22%20x%3D%22124.5%22%20y%3D%2282%22%3E365%3C%2Ftext%3E%3Ctext%20font-family%3D%22Arial%22%20font-size%3D%2216%22%20text-anchor%3D%22middle%22%20x%3D%2252.5%22%20y%3D%22105%22%3E%26%23xA3%3B%3C%2Ftext%3E%3Ctext%20font-family%3D%22Arial%22%20font-size%3D%2216%22%20text-anchor%3D%22middle%22%20x%3D%2272.5%22%20y%3D%22105%22%3E112%3C%2Ftext%3E%3Ctext%20font-family%3D%22math184975f6f12cf02d48a427fe25f%22%20font-size%3D%2216%22%20text-anchor%3D%22middle%22%20x%3D%2288.5%22%20y%3D%22105%22%3E%2C%3C%2Ftext%3E%3Ctext%20font-family%3D%22Arial%22%20font-size%3D%2216%22%20text-anchor%3D%22middle%22%20x%3D%22104.5%22%20y%3D%22105%22%3E400%3C%2Ftext%3E%3Ctext%20font-family%3D%22math184975f6f12cf02d48a427fe25f%22%20font-size%3D%2216%22%20text-anchor%3D%22middle%22%20x%3D%228.5%22%20y%3D%22148%22%3E%3D%3C%2Ftext%3E%3Ctext%20font-family%3D%22Arial%22%20font-size%3D%2216%22%20text-anchor%3D%22middle%22%20x%3D%2234.5%22%20y%3D%22148%22%3E119%3C%2Ftext%3E%3Ctext%20font-family%3D%22math184975f6f12cf02d48a427fe25f%22%20font-size%3D%2216%22%20text-anchor%3D%22middle%22%20x%3D%2250.5%22%20y%3D%22148%22%3E.%3C%2Ftext%3E%3Ctext%20font-family%3D%22Arial%22%20font-size%3D%2216%22%20text-anchor%3D%22middle%22%20x%3D%2262.5%22%20y%3D%22148%22%3E50%3C%2Ftext%3E%3Ctext%20font-family%3D%22Arial%22%20font-size%3D%2216%22%20text-anchor%3D%22middle%22%20x%3D%2292.5%22%20y%3D%22148%22%3Edays%3C%2Ftext%3E%3C%2Fsvg%3E) (2)
(2)
Improving the inventory turnover ratio
Hold less inventory | Reduce the cost of sales |
|---|---|
|
|
Inventory turnover variations
There is no ideal ratio for stock turnover
Some businesses will have a very low stock turnover ratio as they sell few products - usually at a high price
Examples include jewellers, luxury vehicles and specialist equipment or services
Other businesses have a very high stock turnover ratio as they sell large volumes of low or moderately-priced products
Their business model often requires this - for example, they may sell perishable goods
Examples include supermarkets, florists or takeaway food businesses
Examiner Tips and Tricks
When calculating financial ratios, check that you are using the correct units.
In some cases, financial data is presented as raw figures (e.g. £14,520) but in most cases, you will be working in thousands (£000) or millions (£m).
Ensure that you convert correctly, e.g. £0.39m is equal to £390,000 and £34.9 (000) is equal to £34,900
Make sure the decimal place is in the correct place
Calculate to two decimal places unless stated otherwise
Evaluation of ratio and efficiency analysis
A range of factors can affect how useful ratio analysis is in supporting business decision-making
The business’s market position
A market leader’s ratios (e.g. high profit margins) may look very different to those of a small rival, so comparing them directly can be misleading without adjustments for size
Quality of management decision making
Strong management can boost key ratios by making choices like cutting costs that may hide longer-term problems
Poor decisions can worsen ratios even if the wider market is performing well
Workers’ and management skills
A highly skilled workforce and experienced managers improve productivity and efficiency ratios, such as inventory turnover
The economic environment
In a recession, profitability and liquidity ratios tend to fall for most businesses, so low ratios may reflect the wider economy rather than internal failings
Market conditions
Industry-specific factors such as seasonal demand swings, intense price competition or new regulations, can skew ratios, making it hard to tell if a ratio change is a company problem or an industry trend
Advantages and disadvantages of using ratio analysis to assess business performance
Advantages | Disadvantages |
|---|---|
|
|
|
|
|
|

Unlock more, it's free!
Join the 100,000+ Students that ❤️ Save My Exams
the (exam) results speak for themselves:

Was this revision note helpful?
