Large Data Set (OCR A Level Maths A: Statistics): Revision Note
Exam code: H240
Did this video help you?
Using a large data set
What is a large data set?
As part of your course there is a large data set that you can use
It contains lots of information
You are not expected to memorise any results from the data
You will have an advantage if you are familiar with the large data set
Understand what the variables are
Understand the terminology used
Understand the context
You will not get a copy of the large data set in your exam
if you are required to calculate anything using the large data set you will be given an extract within the question
What questions could be asked?
Cleaning data
There might be missing data
You could identify outliers and question their validity
Sampling and hypothesis testing
You can practice different methods of sampling using the data
You could use a sample to test a hypothesis
Statistical measures and diagram
You could calculate summary statistics for different variables
You could create different diagrams
You can interpret the summary statistics and diagrams (as it is real data you could explore the context behind the results)
You could compare summary statistics and diagrams
Do I have to use spreadsheets and other technology?
You will not be assessed on using spreadsheets
However, it is a useful skill for your future career
You could use technology to calculate the summary statistics and create the statistical diagrams
This will help you to practice these skills whilst using real data
Spreadsheets can calculate summary statistics
In the exam you could use the statistics mode on your calculator
Did this video help you?
Summary of the OCR large data set
What is the data about?
The LDS consists of four data sets covering the age structure of the population in England and Wales and the method of travel to work from the censuses of 2001 and 2011
The data is regional and comes from 348 districts covering all of England and Wales which are referred to as the Local Authority Districts (LAD) or Unitary Authorities (UA)
The unitary authorities were created by combining some LADs due to change over the 10 years between 2001 and 2011
The 348 districts are grouped into the following regions
North East (12 districts)
North West (39 districts)
Yorkshire & The Humber (21 districts)
East Midlands (40 districts)
West Midlands (30 districts)
East of England (47 districts)
London (33 districts)
South East (67 districts)
South West (37 districts)
Wales (22 districts)
What data collection methods were used?
The data were collated from the 2001 and 2011 censuses
The census is carried out every 10 years and collects data from every contributing member of the population across England and Wales
It gives the best possible estimate for an overview of the population
The 'method of travel' data sets encompass all people who were in employment at the time of the census collection
The method of travel concerns the part of their journey to work where they travelled the furthest
The age structure data set is taken from the date of birth question on the survey
The age is taken to be the person's age on their last birthday before the time of the census collection
A person of less than a year old was recorded at 0
In 2001 a data entry of over 110 was treated as invalid
In 2011 a data entry of over 115 was treated as invalid
What important features do I need to be aware of?
Take some time to review the age structure boundaries
They are not even and have widely varying class widths
Notice how the class widths for teenagers are particularly small whilst those for ages 30 – 59 are much wider
This means looking at a normal frequency diagram or population pyramid would be misleading, instead you should use a histogram and calculate frequency densities
Look at the different types of districts and be aware of how the method of travel to work changes between them
Non-metropolitan district in England (E08) refers to towns and small cities
Metropolitan boroughs (E08) refers to big cities is certain areas of England
London borough (E09) refers to all parts of London
Be aware that there are other Unitary Authorities in England (E06) that could be either a metropolis or a smaller city
W06 refers to a unitary authority in Wales, these are mostly rural except for the districts of Cardiff and Newport
Consider the variation in age in rural areas compared to metropolises, think about why big cities and the London districts might have less variation in age
Consider the method of travel to work in rural areas compared to metropolises, think about why big cities and the London districts might have more people who use public transport
Look at the change in use of public transport from 2001 to 2011
Consider some reasons why more people may use public transport in 2011, could there have been improvements in those areas or perhaps government incentive schemes?
Watch out for correlation, the values are given as direct numbers so as the population increases so will the method of travel to work
You would need to look at the proportion to get a better idea of correlation
Worked Example
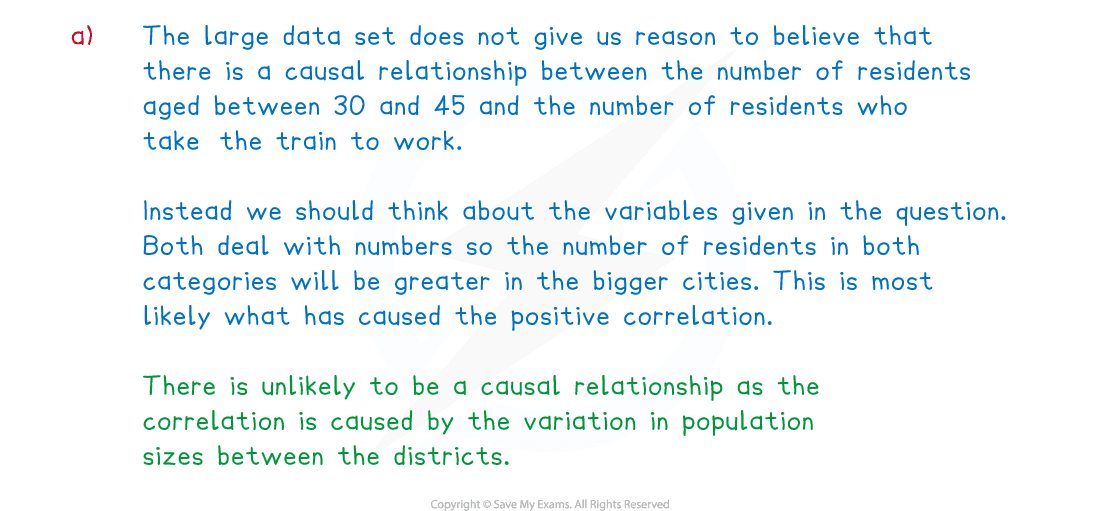
A random sample of 100 regions is taken from the 2001 data and a scatter graph is drawn with the number of residents aged between 30 and 45 on the x – axis and the number of residents who travel to work by train on the y – axis. The scatter graph shows positive correlation.
(a) Using your knowledge of the large data set, explain whether this may show a causal relationship between the two variables. Give a reason for your answer.
Answer:
(b) A researcher wants to investigate the relationship between the number of residents aged between 30 and 45 and the number of residents who travel to work by train in 2011. Suggest a suitable method the researcher could use to display this data.
Answer:


Unlock more, it's free!
Join the 100,000+ Students that ❤️ Save My Exams
the (exam) results speak for themselves:

Was this revision note helpful?