Cost Information (Cambridge (CIE) A Level Business): Revision Note
Exam code: 9609

The need for accurate cost information
Cost information refers to data about all the costs involved in producing and selling a product
Why is accurate cost information needed?
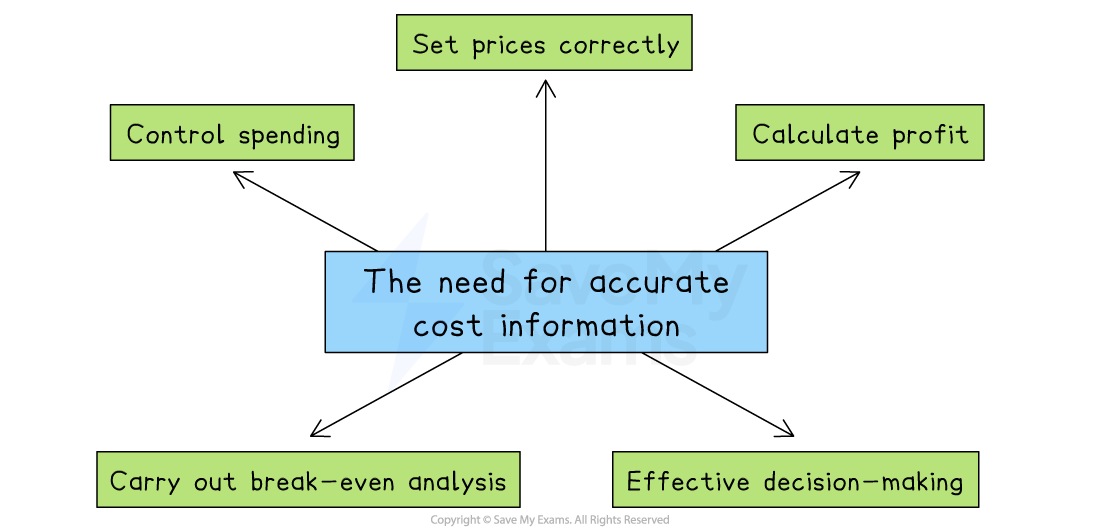
To set prices correctly
If a business underestimates its costs, it may set prices too low and make a loss
Overestimating costs may lead to prices that are too high, reducing demand
To calculate profit
Accurate costs help calculate gross profit and net profit, important for judging performance
For decision-making
Managers use cost data to decide whether to
Launch a new product
Continue or stop production
Change suppliers or production methods
To carry out break-even analysis
This helps decide how many units need to be sold to cover all costs.
Accurate costs make break-even analysis more reliable
To control spending
Comparing actual costs with budgets helps identify areas of overspending and take action
Types of costs
In preparing goods and services for sale, businesses incur a range of costs
These costs can be broken into different categories
Fixed costs
Fixed costs do not change according to output
These have to be paid whether the output is zero or 5,000
Examples include rent, management salaries, insurance and bank loan repayments

Fixed costs in this instance are $4,000
Variable costs
Variable costs rise proportionally with output
These increase as output rises and decrease as output falls
Examples include raw material costs and wages of workers directly involved in production and packaging
At some point, a business may benefit from a purchasing economies, so the rise will no longer be proportional

Total costs

Total costs is the combination of all fixed and variable costs involved in producing a certain level of output
Total costs cannot be zero, as all organisations have some level of fixed costs
An alternative way to classify costs
Direct costs
These are costs that can be directly traced to a specific product, service, or department
They relate specifically and exclusively to the production of a particular item
Direct costs can be fixed or variable
For example, a one-off licence fee for a software product is a direct fixed cost if it applies only to that product
Examples of direct costs include:
The cost of raw materials used to make a table
Wages paid to factory workers assembling a specific product
Packaging for a single product line
Indirect costs
Indirect costs are costs that cannot be traced directly to a specific product, job, or service
They support overall operations and are shared across departments or products
These costs are necessary for production or business operations, but they are not directly linked to any one unit of output
Indirect costs can also be fixed or variable
For example, the monthly rent paid for a shared office space is an indirect fixed cost, as it supports multiple departments but does not vary with output
Examples of indirect costs include:
Rent and utility bills for a factory or office
Salaries of supervisors or administrative staff
Office supplies and insurance
Depreciation of machinery used across several product lines

Comparison: direct vs indirect costs
Feature | Direct costs | Indirect costs |
|---|---|---|
Traceability |
|
|
Examples |
|
|
Can be fixed or variable? |
|
|
Using cost information to make decisions
Cost data helps businesses make key decisions
Total costs (TC)
Total costs information can be used to assess how much money is needed to produce at a certain level and is vital for budgeting and cash flow forecasting
Worked Example
SupaJuice produces 12,400 bottles of its premium fruit juice drink each month.
It incurs monthly fixed costs (e.g. rent, salaries) of $25,700
Variable costs per unit (e.g. bottles, fruit) of $1.24
Calculate the business's annual total costs.
(3)
Step 1: Calculate monthly variable costs
format('truetype')%3Bfont-weight%3Anormal%3Bfont-style%3Anormal%3B%7D%3C%2Fstyle%3E%3C%2Fdefs%3E%3Ctext%20font-family%3D%22math16f8c8c1452798594b40e28e31d%22%20font-size%3D%2216%22%20text-anchor%3D%22middle%22%20x%3D%228.5%22%20y%3D%2216%22%3E%3D%3C%2Ftext%3E%3Ctext%20font-family%3D%22Times%20New%20Roman%22%20font-size%3D%2218%22%20text-anchor%3D%22middle%22%20x%3D%2230.5%22%20y%3D%2216%22%3E12%3C%2Ftext%3E%3Ctext%20font-family%3D%22math16f8c8c1452798594b40e28e31d%22%20font-size%3D%2216%22%20text-anchor%3D%22middle%22%20x%3D%2241.5%22%20y%3D%2216%22%3E%2C%3C%2Ftext%3E%3Ctext%20font-family%3D%22Times%20New%20Roman%22%20font-size%3D%2218%22%20text-anchor%3D%22middle%22%20x%3D%2257.5%22%20y%3D%2216%22%3E400%3C%2Ftext%3E%3Ctext%20font-family%3D%22math16f8c8c1452798594b40e28e31d%22%20font-size%3D%2216%22%20text-anchor%3D%22middle%22%20x%3D%2283.5%22%20y%3D%2216%22%3E%26%23xD7%3B%3C%2Ftext%3E%3Ctext%20font-family%3D%22Times%20New%20Roman%22%20font-size%3D%2218%22%20text-anchor%3D%22middle%22%20x%3D%22102.5%22%20y%3D%2216%22%3E%24%3C%2Ftext%3E%3Ctext%20font-family%3D%22Times%20New%20Roman%22%20font-size%3D%2218%22%20text-anchor%3D%22middle%22%20x%3D%22113.5%22%20y%3D%2216%22%3E1%3C%2Ftext%3E%3Ctext%20font-family%3D%22math16f8c8c1452798594b40e28e31d%22%20font-size%3D%2216%22%20text-anchor%3D%22middle%22%20x%3D%22120.5%22%20y%3D%2216%22%3E.%3C%2Ftext%3E%3Ctext%20font-family%3D%22Times%20New%20Roman%22%20font-size%3D%2218%22%20text-anchor%3D%22middle%22%20x%3D%22132.5%22%20y%3D%2216%22%3E24%3C%2Ftext%3E%3Ctext%20font-family%3D%22math16f8c8c1452798594b40e28e31d%22%20font-size%3D%2216%22%20text-anchor%3D%22middle%22%20x%3D%228.5%22%20y%3D%2263%22%3E%3D%3C%2Ftext%3E%3Ctext%20font-family%3D%22Times%20New%20Roman%22%20font-size%3D%2218%22%20text-anchor%3D%22middle%22%20x%3D%2227.5%22%20y%3D%2263%22%3E%24%3C%2Ftext%3E%3Ctext%20font-family%3D%22Times%20New%20Roman%22%20font-size%3D%2218%22%20text-anchor%3D%22middle%22%20x%3D%2243.5%22%20y%3D%2263%22%3E15%3C%2Ftext%3E%3Ctext%20font-family%3D%22math16f8c8c1452798594b40e28e31d%22%20font-size%3D%2216%22%20text-anchor%3D%22middle%22%20x%3D%2254.5%22%20y%3D%2263%22%3E%2C%3C%2Ftext%3E%3Ctext%20font-family%3D%22Times%20New%20Roman%22%20font-size%3D%2218%22%20text-anchor%3D%22middle%22%20x%3D%2270.5%22%20y%3D%2263%22%3E376%3C%2Ftext%3E%3C%2Fsvg%3E) (1)
(1)
Step 2: Calculate monthly total costs
format('truetype')%3Bfont-weight%3Anormal%3Bfont-style%3Anormal%3B%7D%3C%2Fstyle%3E%3C%2Fdefs%3E%3Ctext%20font-family%3D%22math18dad2c3ab98eb6d3d045db7d28%22%20font-size%3D%2216%22%20text-anchor%3D%22middle%22%20x%3D%228.5%22%20y%3D%2216%22%3E%3D%3C%2Ftext%3E%3Ctext%20font-family%3D%22Times%20New%20Roman%22%20font-size%3D%2218%22%20text-anchor%3D%22middle%22%20x%3D%2227.5%22%20y%3D%2216%22%3E%24%3C%2Ftext%3E%3Ctext%20font-family%3D%22Times%20New%20Roman%22%20font-size%3D%2218%22%20text-anchor%3D%22middle%22%20x%3D%2243.5%22%20y%3D%2216%22%3E15%3C%2Ftext%3E%3Ctext%20font-family%3D%22math18dad2c3ab98eb6d3d045db7d28%22%20font-size%3D%2216%22%20text-anchor%3D%22middle%22%20x%3D%2254.5%22%20y%3D%2216%22%3E%2C%3C%2Ftext%3E%3Ctext%20font-family%3D%22Times%20New%20Roman%22%20font-size%3D%2218%22%20text-anchor%3D%22middle%22%20x%3D%2270.5%22%20y%3D%2216%22%3E376%3C%2Ftext%3E%3Ctext%20font-family%3D%22math18dad2c3ab98eb6d3d045db7d28%22%20font-size%3D%2216%22%20text-anchor%3D%22middle%22%20x%3D%2296.5%22%20y%3D%2216%22%3E%2B%3C%2Ftext%3E%3Ctext%20font-family%3D%22Times%20New%20Roman%22%20font-size%3D%2218%22%20text-anchor%3D%22middle%22%20x%3D%22115.5%22%20y%3D%2216%22%3E%24%3C%2Ftext%3E%3Ctext%20font-family%3D%22Times%20New%20Roman%22%20font-size%3D%2218%22%20text-anchor%3D%22middle%22%20x%3D%22131.5%22%20y%3D%2216%22%3E25%3C%2Ftext%3E%3Ctext%20font-family%3D%22math18dad2c3ab98eb6d3d045db7d28%22%20font-size%3D%2216%22%20text-anchor%3D%22middle%22%20x%3D%22142.5%22%20y%3D%2216%22%3E%2C%3C%2Ftext%3E%3Ctext%20font-family%3D%22Times%20New%20Roman%22%20font-size%3D%2218%22%20text-anchor%3D%22middle%22%20x%3D%22158.5%22%20y%3D%2216%22%3E700%3C%2Ftext%3E%3Ctext%20font-family%3D%22math18dad2c3ab98eb6d3d045db7d28%22%20font-size%3D%2216%22%20text-anchor%3D%22middle%22%20x%3D%228.5%22%20y%3D%2263%22%3E%3D%3C%2Ftext%3E%3Ctext%20font-family%3D%22Times%20New%20Roman%22%20font-size%3D%2218%22%20text-anchor%3D%22middle%22%20x%3D%2227.5%22%20y%3D%2263%22%3E%24%3C%2Ftext%3E%3Ctext%20font-family%3D%22Times%20New%20Roman%22%20font-size%3D%2218%22%20text-anchor%3D%22middle%22%20x%3D%2243.5%22%20y%3D%2263%22%3E41%3C%2Ftext%3E%3Ctext%20font-family%3D%22math18dad2c3ab98eb6d3d045db7d28%22%20font-size%3D%2216%22%20text-anchor%3D%22middle%22%20x%3D%2254.5%22%20y%3D%2263%22%3E%2C%3C%2Ftext%3E%3Ctext%20font-family%3D%22Times%20New%20Roman%22%20font-size%3D%2218%22%20text-anchor%3D%22middle%22%20x%3D%2270.5%22%20y%3D%2263%22%3E076%3C%2Ftext%3E%3C%2Fsvg%3E) (1)
(1)
Step 3: Calculate annual total costs
format('truetype')%3Bfont-weight%3Anormal%3Bfont-style%3Anormal%3B%7D%3C%2Fstyle%3E%3C%2Fdefs%3E%3Ctext%20font-family%3D%22math1995c9b895ce727fb7b1505a8b9%22%20font-size%3D%2216%22%20text-anchor%3D%22middle%22%20x%3D%228.5%22%20y%3D%2216%22%3E%3D%3C%2Ftext%3E%3Ctext%20font-family%3D%22Times%20New%20Roman%22%20font-size%3D%2218%22%20text-anchor%3D%22middle%22%20x%3D%2227.5%22%20y%3D%2216%22%3E%24%3C%2Ftext%3E%3Ctext%20font-family%3D%22Times%20New%20Roman%22%20font-size%3D%2218%22%20text-anchor%3D%22middle%22%20x%3D%2243.5%22%20y%3D%2216%22%3E41%3C%2Ftext%3E%3Ctext%20font-family%3D%22math1995c9b895ce727fb7b1505a8b9%22%20font-size%3D%2216%22%20text-anchor%3D%22middle%22%20x%3D%2254.5%22%20y%3D%2216%22%3E%2C%3C%2Ftext%3E%3Ctext%20font-family%3D%22Times%20New%20Roman%22%20font-size%3D%2218%22%20text-anchor%3D%22middle%22%20x%3D%2270.5%22%20y%3D%2216%22%3E076%3C%2Ftext%3E%3Ctext%20font-family%3D%22math1995c9b895ce727fb7b1505a8b9%22%20font-size%3D%2216%22%20text-anchor%3D%22middle%22%20x%3D%2296.5%22%20y%3D%2216%22%3E%26%23xD7%3B%3C%2Ftext%3E%3Ctext%20font-family%3D%22Times%20New%20Roman%22%20font-size%3D%2218%22%20text-anchor%3D%22middle%22%20x%3D%22118.5%22%20y%3D%2216%22%3E12%3C%2Ftext%3E%3Ctext%20font-family%3D%22Times%20New%20Roman%22%20font-size%3D%2218%22%20text-anchor%3D%22middle%22%20x%3D%22157.5%22%20y%3D%2216%22%3Emonths%3C%2Ftext%3E%3Ctext%20font-family%3D%22math1995c9b895ce727fb7b1505a8b9%22%20font-size%3D%2216%22%20text-anchor%3D%22middle%22%20x%3D%228.5%22%20y%3D%2263%22%3E%3D%3C%2Ftext%3E%3Ctext%20font-family%3D%22Times%20New%20Roman%22%20font-size%3D%2218%22%20text-anchor%3D%22middle%22%20x%3D%2227.5%22%20y%3D%2263%22%3E%24%3C%2Ftext%3E%3Ctext%20font-family%3D%22Times%20New%20Roman%22%20font-size%3D%2218%22%20text-anchor%3D%22middle%22%20x%3D%2247.5%22%20y%3D%2263%22%3E492%3C%2Ftext%3E%3Ctext%20font-family%3D%22math1995c9b895ce727fb7b1505a8b9%22%20font-size%3D%2216%22%20text-anchor%3D%22middle%22%20x%3D%2263.5%22%20y%3D%2263%22%3E%2C%3C%2Ftext%3E%3Ctext%20font-family%3D%22Times%20New%20Roman%22%20font-size%3D%2218%22%20text-anchor%3D%22middle%22%20x%3D%2279.5%22%20y%3D%2263%22%3E912%3C%2Ftext%3E%3C%2Fsvg%3E) (1)
(1)
Average costs (AC)
Average cost is the cost of producing one unit of output, calcualted using the formula
![]()
The average cost helps a businesses set prices that cover costs and leave room for profit
It is also used to compare efficiency over time or between different products
Worked Example
Supajuice has been approached by a large supermarket chain that wants to buy a large volume of its juice each month. The supermarket chain is willing to pay $2.95 for each bottle.
Explain whether SupaJuice should accept the supermarket's offer.
(3)
Step 1: Calculate the average cost of producing each bottle
format('truetype')%3Bfont-weight%3Anormal%3Bfont-style%3Anormal%3B%7D%3C%2Fstyle%3E%3C%2Fdefs%3E%3Ctext%20font-family%3D%22math1a9baeb1ab9771045d1871a21e7%22%20font-size%3D%2216%22%20text-anchor%3D%22middle%22%20x%3D%228.5%22%20y%3D%2216%22%3E%3D%3C%2Ftext%3E%3Ctext%20font-family%3D%22Times%20New%20Roman%22%20font-size%3D%2218%22%20text-anchor%3D%22middle%22%20x%3D%2252.5%22%20y%3D%2216%22%3EMonthly%3C%2Ftext%3E%3Ctext%20font-family%3D%22Times%20New%20Roman%22%20font-size%3D%2218%22%20text-anchor%3D%22middle%22%20x%3D%22103.5%22%20y%3D%2216%22%3Etotal%3C%2Ftext%3E%3Ctext%20font-family%3D%22Times%20New%20Roman%22%20font-size%3D%2218%22%20text-anchor%3D%22middle%22%20x%3D%22137.5%22%20y%3D%2216%22%3Ecost%3C%2Ftext%3E%3Ctext%20font-family%3D%22math1a9baeb1ab9771045d1871a21e7%22%20font-size%3D%2216%22%20text-anchor%3D%22middle%22%20x%3D%22165.5%22%20y%3D%2216%22%3E%26%23xF7%3B%3C%2Ftext%3E%3Ctext%20font-family%3D%22Times%20New%20Roman%22%20font-size%3D%2218%22%20text-anchor%3D%22middle%22%20x%3D%22209.5%22%20y%3D%2216%22%3EMonthly%3C%2Ftext%3E%3Ctext%20font-family%3D%22Times%20New%20Roman%22%20font-size%3D%2218%22%20text-anchor%3D%22middle%22%20x%3D%22267.5%22%20y%3D%2216%22%3Eoutput%3C%2Ftext%3E%3Ctext%20font-family%3D%22math1a9baeb1ab9771045d1871a21e7%22%20font-size%3D%2216%22%20text-anchor%3D%22middle%22%20x%3D%228.5%22%20y%3D%2263%22%3E%3D%3C%2Ftext%3E%3Ctext%20font-family%3D%22Times%20New%20Roman%22%20font-size%3D%2218%22%20text-anchor%3D%22middle%22%20x%3D%2223.5%22%20y%3D%2263%22%3E%24%3C%2Ftext%3E%3Ctext%20font-family%3D%22Times%20New%20Roman%22%20font-size%3D%2218%22%20text-anchor%3D%22middle%22%20x%3D%2239.5%22%20y%3D%2263%22%3E41%3C%2Ftext%3E%3Ctext%20font-family%3D%22math1a9baeb1ab9771045d1871a21e7%22%20font-size%3D%2216%22%20text-anchor%3D%22middle%22%20x%3D%2250.5%22%20y%3D%2263%22%3E%2C%3C%2Ftext%3E%3Ctext%20font-family%3D%22Times%20New%20Roman%22%20font-size%3D%2218%22%20text-anchor%3D%22middle%22%20x%3D%2266.5%22%20y%3D%2263%22%3E076%3C%2Ftext%3E%3Ctext%20font-family%3D%22math1a9baeb1ab9771045d1871a21e7%22%20font-size%3D%2216%22%20text-anchor%3D%22middle%22%20x%3D%2293.5%22%20y%3D%2263%22%3E%26%23xF7%3B%3C%2Ftext%3E%3Ctext%20font-family%3D%22Times%20New%20Roman%22%20font-size%3D%2218%22%20text-anchor%3D%22middle%22%20x%3D%22115.5%22%20y%3D%2263%22%3E12%3C%2Ftext%3E%3Ctext%20font-family%3D%22math1a9baeb1ab9771045d1871a21e7%22%20font-size%3D%2216%22%20text-anchor%3D%22middle%22%20x%3D%22126.5%22%20y%3D%2263%22%3E%2C%3C%2Ftext%3E%3Ctext%20font-family%3D%22Times%20New%20Roman%22%20font-size%3D%2218%22%20text-anchor%3D%22middle%22%20x%3D%22142.5%22%20y%3D%2263%22%3E400%3C%2Ftext%3E%3Ctext%20font-family%3D%22Times%20New%20Roman%22%20font-size%3D%2218%22%20text-anchor%3D%22middle%22%20x%3D%22184.5%22%20y%3D%2263%22%3Ebottles%3C%2Ftext%3E%3Ctext%20font-family%3D%22math1a9baeb1ab9771045d1871a21e7%22%20font-size%3D%2216%22%20text-anchor%3D%22middle%22%20x%3D%228.5%22%20y%3D%22110%22%3E%3D%3C%2Ftext%3E%3Ctext%20font-family%3D%22Times%20New%20Roman%22%20font-size%3D%2218%22%20text-anchor%3D%22middle%22%20x%3D%2227.5%22%20y%3D%22110%22%3E%24%3C%2Ftext%3E%3Ctext%20font-family%3D%22Times%20New%20Roman%22%20font-size%3D%2218%22%20text-anchor%3D%22middle%22%20x%3D%2238.5%22%20y%3D%22110%22%3E3%3C%2Ftext%3E%3Ctext%20font-family%3D%22math1a9baeb1ab9771045d1871a21e7%22%20font-size%3D%2216%22%20text-anchor%3D%22middle%22%20x%3D%2245.5%22%20y%3D%22110%22%3E.%3C%2Ftext%3E%3Ctext%20font-family%3D%22Times%20New%20Roman%22%20font-size%3D%2218%22%20text-anchor%3D%22middle%22%20x%3D%2257.5%22%20y%3D%22110%22%3E31%3C%2Ftext%3E%3C%2Fsvg%3E) (1)
(1)
Step 2: State your answer and give a reason
SupaJuice should not accept the supermarket's offer (1), as it would make a loss of $0.36 ($2.95 - $3.31) on each bottle (1)
Marginal cost (MC)
Marginal cost is the cost of producing one extra unit of output, calculated using the formula
![]()
The marginal cost helps a business decide whether producing extra units is profitable
It is a key consideration for decisions about increasing production, pricing, and entering new markets
It can also be used for special order pricing and decisions about increasing output
Worked Example
SupaJuice is considering increasing its output from 12,400 to 13,000 bottles per month. This will increase monthly total costs by $2,750.
Explain whether SupaJuice should increase its output if it sells each bottle of juice for $4.75.
Step 1: Calculate the marginal cost
format('truetype')%3Bfont-weight%3Anormal%3Bfont-style%3Anormal%3B%7D%3C%2Fstyle%3E%3C%2Fdefs%3E%3Ctext%20font-family%3D%22math1accd16a5c8686f1af84b300ff6%22%20font-size%3D%2216%22%20text-anchor%3D%22middle%22%20x%3D%228.5%22%20y%3D%2216%22%3E%3D%3C%2Ftext%3E%3Ctext%20font-family%3D%22Times%20New%20Roman%22%20font-size%3D%2218%22%20text-anchor%3D%22middle%22%20x%3D%2227.5%22%20y%3D%2216%22%3E%24%3C%2Ftext%3E%3Ctext%20font-family%3D%22Times%20New%20Roman%22%20font-size%3D%2218%22%20text-anchor%3D%22middle%22%20x%3D%2238.5%22%20y%3D%2216%22%3E2%3C%2Ftext%3E%3Ctext%20font-family%3D%22math1accd16a5c8686f1af84b300ff6%22%20font-size%3D%2216%22%20text-anchor%3D%22middle%22%20x%3D%2245.5%22%20y%3D%2216%22%3E%2C%3C%2Ftext%3E%3Ctext%20font-family%3D%22Times%20New%20Roman%22%20font-size%3D%2218%22%20text-anchor%3D%22middle%22%20x%3D%2261.5%22%20y%3D%2216%22%3E750%3C%2Ftext%3E%3Ctext%20font-family%3D%22math1accd16a5c8686f1af84b300ff6%22%20font-size%3D%2216%22%20text-anchor%3D%22middle%22%20x%3D%2288.5%22%20y%3D%2216%22%3E%26%23xF7%3B%3C%2Ftext%3E%3Ctext%20font-family%3D%22Times%20New%20Roman%22%20font-size%3D%2218%22%20text-anchor%3D%22middle%22%20x%3D%22114.5%22%20y%3D%2216%22%3E600%3C%2Ftext%3E%3Ctext%20font-family%3D%22Times%20New%20Roman%22%20font-size%3D%2218%22%20text-anchor%3D%22middle%22%20x%3D%22156.5%22%20y%3D%2216%22%3Ebottles%3C%2Ftext%3E%3Ctext%20font-family%3D%22math1accd16a5c8686f1af84b300ff6%22%20font-size%3D%2216%22%20text-anchor%3D%22middle%22%20x%3D%228.5%22%20y%3D%2263%22%3E%3D%3C%2Ftext%3E%3Ctext%20font-family%3D%22Times%20New%20Roman%22%20font-size%3D%2218%22%20text-anchor%3D%22middle%22%20x%3D%2227.5%22%20y%3D%2263%22%3E%24%3C%2Ftext%3E%3Ctext%20font-family%3D%22Times%20New%20Roman%22%20font-size%3D%2218%22%20text-anchor%3D%22middle%22%20x%3D%2238.5%22%20y%3D%2263%22%3E4%3C%2Ftext%3E%3Ctext%20font-family%3D%22math1accd16a5c8686f1af84b300ff6%22%20font-size%3D%2216%22%20text-anchor%3D%22middle%22%20x%3D%2245.5%22%20y%3D%2263%22%3E.%3C%2Ftext%3E%3Ctext%20font-family%3D%22Times%20New%20Roman%22%20font-size%3D%2218%22%20text-anchor%3D%22middle%22%20x%3D%2257.5%22%20y%3D%2263%22%3E58%3C%2Ftext%3E%3C%2Fsvg%3E) (1)
(1)
Step 2: State your answer and give a reason
SupaJuice should increase output (1), as the marginal cost is $0.17 ($4.75 - $4.58) less than the selling price, allowing a profit to be made on each bottle sold (1)
Using cost information to make pricing decisions
Cost information can help shape a business’s entire pricing strategy, including how to respond to competition, customer demand and market conditions
Cost information and pricing decisions
Setting a minimum price point
Accurate cost data ensures prices are set above total or marginal cost
This prevents selling at a loss and is especially important for new products where cost estimates may change as production increases
E.g. A small electronics company launching a smart speaker knows its unit cost is $40 and avoids pricing below that, even during a promotion
Choosing between pricing strategies
Businesses choose strategies like penetration pricing, skimming, or competitive pricing
Cost information helps assess whether these options are financially sustainable
Adjusting prices when costs change
When input costs, such as raw materials or wages, rise, cost data helps decide whether to increase prices or reduce other costs while keeping prices stable
Responding to competitors' prices
Cost information helps businesses know how low they can reduce prices in response to rivals without making a loss
This is essential in price wars or competitive markets
Planning discounts and promotions
Even during sales or promotions, businesses must at least cover variable costs
Accurate cost information prevents making a loss as a result of short-term discounts
Using cost information to monitor and improve business performance
Cost information is a vital tool for monitoring business performance
It helps businesses
Track profitability
Set and measure performance targets
Identify problems early
Make better decisions for the future
Become more efficient and competitive
Uses of cost information in relation to business performance
Use | Explanation |
|---|---|
Calculate and monitor profits |
|
Calculate profit margins |
|
Set performance targets |
|
Identify areas of inefficiency |
|
Support decision-making and planning |
|
Reduce waste and improve efficiency |
|

Unlock more, it's free!
Join the 100,000+ Students that ❤️ Save My Exams
the (exam) results speak for themselves:

Was this revision note helpful?
