Distribution of Sample Means (Cambridge (CIE) A Level Maths): Revision Note
Exam code: 9709

Did this video help you?
Sample Mean Distribution
What is the distribution of the sample means?
For any given population it can often be difficult or impractical to find the true value of the population mean, µ
The population could be too large to collect data using a census or
Collecting the data could compromise the individual data values and therefore taking a census could destroy the population
Instead, the population mean can be estimated by taking the mean from a sample from within the population
If a sample of size
 is taken from a population,
  , and the mean of the sample,
 format('truetype')%3Bfont-weight%3Anormal%3Bfont-style%3Anormal%3B%7D%3C%2Fstyle%3E%3C%2Fdefs%3E%3Ctext%20font-family%3D%22horizontalbf65417dcecc7f2b0006e%22%20font-size%3D%2212%22%20text-anchor%3D%22middle%22%20x%3D%222.5%22%20y%3D%228%22%3E%26%23x23AF%3B%3C%2Ftext%3E%3Ctext%20font-family%3D%22horizontalbf65417dcecc7f2b0006e%22%20font-size%3D%2212%22%20text-anchor%3D%22middle%22%20x%3D%226.5%22%20y%3D%228%22%3E%26%23x23AF%3B%3C%2Ftext%3E%3Ctext%20font-family%3D%22Times%20New%20Roman%22%20font-size%3D%2216%22%20font-style%3D%22italic%22%20text-anchor%3D%22middle%22%20x%3D%224.5%22%20y%3D%2217%22%3Ex%3C%2Ftext%3E%3C%2Fsvg%3E) is calculated then the distribution of the sample means,
is calculated then the distribution of the sample means, format('truetype')%3Bfont-weight%3Anormal%3Bfont-style%3Anormal%3B%7D%3C%2Fstyle%3E%3C%2Fdefs%3E%3Ctext%20font-family%3D%22horizontalbf65417dcecc7f2b0006e%22%20font-size%3D%2212%22%20text-anchor%3D%22middle%22%20x%3D%222.5%22%20y%3D%227%22%3E%26%23x23AF%3B%3C%2Ftext%3E%3Ctext%20font-family%3D%22horizontalbf65417dcecc7f2b0006e%22%20font-size%3D%2212%22%20text-anchor%3D%22middle%22%20x%3D%226.5%22%20y%3D%227%22%3E%26%23x23AF%3B%3C%2Ftext%3E%3Ctext%20font-family%3D%22horizontalbf65417dcecc7f2b0006e%22%20font-size%3D%2212%22%20text-anchor%3D%22middle%22%20x%3D%2210.5%22%20y%3D%227%22%3E%26%23x23AF%3B%3C%2Ftext%3E%3Ctext%20font-family%3D%22Times%20New%20Roman%22%20font-size%3D%2216%22%20font-style%3D%22italic%22%20text-anchor%3D%22middle%22%20x%3D%226.5%22%20y%3D%2219%22%3EX%3C%2Ftext%3E%3C%2Fsvg%3E) , is the distribution of all values that the sample mean could take
, is the distribution of all values that the sample mean could takeIf the population,
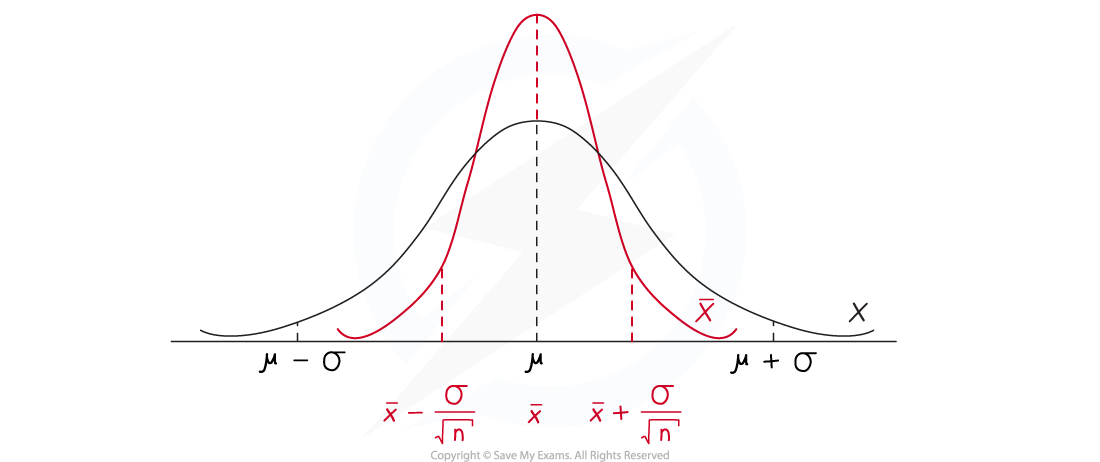
, has a normal distribution with mean, µ , and variance, σ2 , then the mean expected value of the distribution of the sample means,  would still be µ but the variance would be reduced
Taking a mean of a sample will reduce the effect of any extreme values
The greater the sample size, the less varied the distribution of the sample means would be
The distribution of the means of the samples of size taken from the population, will have a normal distribution with:
Mean,
= µVariance

Standard deviation
%22%2F%3E%3Cpolyline%20fill%3D%22none%22%20points%3D%225%2C0%202%2C-6%200%2C-5%22%20stroke%3D%22%23000%22%20stroke-linecap%3D%22square%22%20stroke-width%3D%221%22%20transform%3D%22translate(4.5%2C42.5)%22%2F%3E%3Cline%20stroke%3D%22%23000%22%20stroke-linecap%3D%22square%22%20stroke-width%3D%221%22%20x1%3D%2216.5%22%20x2%3D%2228.5%22%20y1%3D%2226.5%22%20y2%3D%2226.5%22%2F%3E%3Ctext%20font-family%3D%22Times%20New%20Roman%22%20font-size%3D%2216%22%20font-style%3D%22italic%22%20text-anchor%3D%22middle%22%20x%3D%2222.5%22%20y%3D%2241%22%3En%3C%2Ftext%3E%3C%2Fsvg%3E)
For a random variable
%3C%2Fmo%3E%3C%2Fmstyle%3E%3C%2Fmath%3E--%3E%3Cdefs%3E%3Cstyle%20type%3D%22text%2Fcss%22%3E%40font-face%7Bfont-family%3A'math1d5a744be5825ca5bd6c2e20d0f'%3Bsrc%3Aurl(data%3Afont%2Ftruetype%3Bcharset%3Dutf-8%3Bbase64%2CAAEAAAAMAIAAAwBAT1MvMi7iBBMAAADMAAAATmNtYXDEvmKUAAABHAAAADxjdnQgDVUNBwAAAVgAAAA6Z2x5ZoPi2VsAAAGUAAAAxWhlYWQQC2qxAAACXAAAADZoaGVhCGsXSAAAApQAAAAkaG10eE2rRkcAAAK4AAAADGxvY2EAHTwYAAACxAAAABBtYXhwBT0FPgAAAtQAAAAgbmFtZaBxlY4AAAL0AAABn3Bvc3QB9wD6AAAElAAAACBwcmVwa1uragAABLQAAAAUAAADSwGQAAUAAAQABAAAAAAABAAEAAAAAAAAAQEAAAAAAAAAAAAAAAAAAAAAAAAAAAAAAAAAAAAAACAgICAAAAAg1UADev96AAAD6ACWAAAAAAACAAEAAQAAABQAAwABAAAAFAAEACgAAAAGAAQAAQACACwiPP%2F%2FAAAALCI8%2F%2F%2F%2F1d3GAAEAAAAAAAAAAAFUAywAgAEAAFYAKgJYAh4BDgEsAiwAWgGAAoAAoADUAIAAAAAAAAAAKwBVAIAAqwDVAQABKwAHAAAAAgBVAAADAAOrAAMABwAAMxEhESUhESFVAqv9qwIA%2FgADq%2FxVVQMAAAEAVf9kANUAgAAKAAAzNTMVFAYHJz4BN1WALy8bHh4BgHo9URQpDjQxAAEAgACrAwACVQAHAEkYAbAIELEHA%2FaxBgP2sAE8sAcQsAPVsQkD5rECA%2FawBTwAsQAAExCxAwblsQMBExCxBgX2sQEF5rADELEHBfWxAgX2sQUF5jEwEzYANxUGAAeAgAGAgID%2BgIABq6r%2Bq6tWqgFVqwAAAAABAAAAAQAA1XjOQV8PPPUAAwQA%2F%2F%2F%2F%2F9Y6E3P%2F%2F%2F%2F%2F1joTcwAA%2FyAEgAOrAAAACgACAAEAAAAAAAEAAAPo%2F2oAABdwAAD%2FtgSAAAEAAAAAAAAAAAAAAAAAAAADA1IAVQEzAFUDVgCAAAAAAAAAACgAAABSAAAAxQABAAAAAwBeAAUAAAAAAAIAgAQAAAAAAAQAAN4AAAAAAAAAFQECAAAAAAAAAAEAEgAAAAAAAAAAAAIADgASAAAAAAAAAAMAMAAgAAAAAAAAAAQAEgBQAAAAAAAAAAUAFgBiAAAAAAAAAAYACQB4AAAAAAAAAAgAHACBAAEAAAAAAAEAEgAAAAEAAAAAAAIADgASAAEAAAAAAAMAMAAgAAEAAAAAAAQAEgBQAAEAAAAAAAUAFgBiAAEAAAAAAAYACQB4AAEAAAAAAAgAHACBAAMAAQQJAAEAEgAAAAMAAQQJAAIADgASAAMAAQQJAAMAMAAgAAMAAQQJAAQAEgBQAAMAAQQJAAUAFgBiAAMAAQQJAAYACQB4AAMAAQQJAAgAHACBAE0AYQB0AGgAIABGAG8AbgB0AFIAZQBnAHUAbABhAHIATQBhAHQAaABzACAARgBvAHIAIABNAG8AcgBlACAATQBhAHQAaAAgAEYAbwBuAHQATQBhAHQAaAAgAEYAbwBuAHQAVgBlAHIAcwBpAG8AbgAgADEALgAwTWF0aF9Gb250AE0AYQB0AGgAcwAgAEYAbwByACAATQBvAHIAZQAAAwAAAAAAAAH0APoAAAAAAAAAAAAAAAAAAAAAAAAAALkHEQAAjYUYALIAAAAVFBOxAAE%2F)format('truetype')%3Bfont-weight%3Anormal%3Bfont-style%3Anormal%3B%7D%40font-face%7Bfont-family%3A'round_brackets18549f92a457f2409'%3Bsrc%3Aurl(data%3Afont%2Ftruetype%3Bcharset%3Dutf-8%3Bbase64%2CAAEAAAAMAIAAAwBAT1MvMjwHLFQAAADMAAAATmNtYXDf7xCrAAABHAAAADxjdnQgBAkDLgAAAVgAAAASZ2x5ZmAOz2cAAAFsAAABJGhlYWQOKih8AAACkAAAADZoaGVhCvgVwgAAAsgAAAAkaG10eCA6AAIAAALsAAAADGxvY2EAAARLAAAC%2BAAAABBtYXhwBIgEWQAAAwgAAAAgbmFtZXHR30MAAAMoAAACOXBvc3QDogHPAAAFZAAAACBwcmVwupWEAAAABYQAAAAHAAAGcgGQAAUAAAgACAAAAAAACAAIAAAAAAAAAQIAAAAAAAAAAAAAAAAAAAAAAAAAAAAAAAAAAAAAACAgICAAAAAo8AMGe%2F57AAAHPgGyAAAAAAACAAEAAQAAABQAAwABAAAAFAAEACgAAAAGAAQAAQACACgAKf%2F%2FAAAAKAAp%2F%2F%2F%2F2f%2FZAAEAAAAAAAAAAAFUAFYBAAAsAKgDgAAyAAcAAAACAAAAKgDVA1UAAwAHAAA1MxEjEyMRM9XVq4CAKgMr%2FQAC1QABAAD%2B0AIgBtAACQBNGAGwChCwA9SwAxCwAtSwChCwBdSwBRCwANSwAxCwBzywAhCwCDwAsAoQsAPUsAMQsAfUsAoQsAXUsAoQsADUsAMQsAI8sAcQsAg8MTAREAEzABEQASMAAZCQ%2FnABkJD%2BcALQ%2FZD%2BcAGQAnACcAGQ%2FnAAAQAA%2FtACIAbQAAkATRgBsAoQsAPUsAMQsALUsAoQsAXUsAUQsADUsAMQsAc8sAIQsAg8ALAKELAD1LADELAH1LAKELAF1LAKELAA1LADELACPLAHELAIPDEwARABIwAREAEzAAIg%2FnCQAZD%2BcJABkALQ%2FZD%2BcAGQAnACcAGQ%2FnAAAQAAAAEAAPW2NYFfDzz1AAMIAP%2F%2F%2F%2F%2FVre7u%2F%2F%2F%2F%2F9Wt7u4AAP7QA7cG0AAAAAoAAgABAAAAAAABAAAHPv5OAAAXcAAA%2F%2F4DtwABAAAAAAAAAAAAAAAAAAAAAwDVAAACIAAAAiAAAAAAAAAAAAAkAAAAowAAASQAAQAAAAMACgACAAAAAAACAIAEAAAAAAAEAABNAAAAAAAAABUBAgAAAAAAAAABAD4AAAAAAAAAAAACAA4APgAAAAAAAAADAFwATAAAAAAAAAAEAD4AqAAAAAAAAAAFABYA5gAAAAAAAAAGAB8A%2FAAAAAAAAAAIABwBGwABAAAAAAABAD4AAAABAAAAAAACAA4APgABAAAAAAADAFwATAABAAAAAAAEAD4AqAABAAAAAAAFABYA5gABAAAAAAAGAB8A%2FAABAAAAAAAIABwBGwADAAEECQABAD4AAAADAAEECQACAA4APgADAAEECQADAFwATAADAAEECQAEAD4AqAADAAEECQAFABYA5gADAAEECQAGAB8A%2FAADAAEECQAIABwBGwBSAG8AdQBuAGQAIABiAHIAYQBjAGsAZQB0AHMAIAB3AGkAdABoACAAYQBzAGMAZQBuAHQAIAAxADgANQA0AFIAZQBnAHUAbABhAHIATQBhAHQAaABzACAARgBvAHIAIABNAG8AcgBlACAAUgBvAHUAbgBkACAAYgByAGEAYwBrAGUAdABzACAAdwBpAHQAaAAgAGEAcwBjAGUAbgB0ACAAMQA4ADUANABSAG8AdQBuAGQAIABiAHIAYQBjAGsAZQB0AHMAIAB3AGkAdABoACAAYQBzAGMAZQBuAHQAIAAxADgANQA0AFYAZQByAHMAaQBvAG4AIAAyAC4AMFJvdW5kX2JyYWNrZXRzX3dpdGhfYXNjZW50XzE4NTQATQBhAHQAaABzACAARgBvAHIAIABNAG8AcgBlAAAAAAMAAAAAAAADnwHPAAAAAAAAAAAAAAAAAAAAAAAAAAC5B%2F8AAY2FAA%3D%3D)format('truetype')%3Bfont-weight%3Anormal%3Bfont-style%3Anormal%3B%7D%3C%2Fstyle%3E%3C%2Fdefs%3E%3Ctext%20font-family%3D%22Times%20New%20Roman%22%20font-size%3D%2216%22%20font-style%3D%22italic%22%20text-anchor%3D%22middle%22%20x%3D%226.5%22%20y%3D%2216%22%3EX%3C%2Ftext%3E%3Ctext%20font-family%3D%22math1d5a744be5825ca5bd6c2e20d0f%22%20font-size%3D%2214%22%20text-anchor%3D%22middle%22%20x%3D%2221.5%22%20y%3D%2216%22%3E%26%23x223C%3B%3C%2Ftext%3E%3Ctext%20font-family%3D%22Times%20New%20Roman%22%20font-size%3D%2216%22%20text-anchor%3D%22middle%22%20x%3D%2235.5%22%20y%3D%2216%22%3EN%3C%2Ftext%3E%3Ctext%20font-family%3D%22round_brackets18549f92a457f2409%22%20font-size%3D%2216%22%20text-anchor%3D%22middle%22%20x%3D%2244.5%22%20y%3D%2216%22%3E(%3C%2Ftext%3E%3Ctext%20font-family%3D%22Times%20New%20Roman%22%20font-size%3D%2216%22%20font-style%3D%22italic%22%20text-anchor%3D%22middle%22%20x%3D%2250.5%22%20y%3D%2216%22%3E%26%23x3BC%3B%3C%2Ftext%3E%3Ctext%20font-family%3D%22math1d5a744be5825ca5bd6c2e20d0f%22%20font-size%3D%2214%22%20text-anchor%3D%22middle%22%20x%3D%2258.5%22%20y%3D%2216%22%3E%2C%3C%2Ftext%3E%3Ctext%20font-family%3D%22Times%20New%20Roman%22%20font-size%3D%2216%22%20font-style%3D%22italic%22%20text-anchor%3D%22middle%22%20x%3D%2264.5%22%20y%3D%2216%22%3E%26%23x3C3%3B%3C%2Ftext%3E%3Ctext%20font-family%3D%22Times%20New%20Roman%22%20font-size%3D%2212%22%20text-anchor%3D%22middle%22%20x%3D%2273.5%22%20y%3D%2211%22%3E2%3C%2Ftext%3E%3Ctext%20font-family%3D%22round_brackets18549f92a457f2409%22%20font-size%3D%2216%22%20text-anchor%3D%22middle%22%20x%3D%2278.5%22%20y%3D%2216%22%3E)%3C%2Ftext%3E%3C%2Fsvg%3E) the distribution of the sample mean would be
the distribution of the sample mean would be format('truetype')%3Bfont-weight%3Anormal%3Bfont-style%3Anormal%3B%7D%40font-face%7Bfont-family%3A'math1d5a744be5825ca5bd6c2e20d0f'%3Bsrc%3Aurl(data%3Afont%2Ftruetype%3Bcharset%3Dutf-8%3Bbase64%2CAAEAAAAMAIAAAwBAT1MvMi7iBBMAAADMAAAATmNtYXDEvmKUAAABHAAAADxjdnQgDVUNBwAAAVgAAAA6Z2x5ZoPi2VsAAAGUAAAAxWhlYWQQC2qxAAACXAAAADZoaGVhCGsXSAAAApQAAAAkaG10eE2rRkcAAAK4AAAADGxvY2EAHTwYAAACxAAAABBtYXhwBT0FPgAAAtQAAAAgbmFtZaBxlY4AAAL0AAABn3Bvc3QB9wD6AAAElAAAACBwcmVwa1uragAABLQAAAAUAAADSwGQAAUAAAQABAAAAAAABAAEAAAAAAAAAQEAAAAAAAAAAAAAAAAAAAAAAAAAAAAAAAAAAAAAACAgICAAAAAg1UADev96AAAD6ACWAAAAAAACAAEAAQAAABQAAwABAAAAFAAEACgAAAAGAAQAAQACACwiPP%2F%2FAAAALCI8%2F%2F%2F%2F1d3GAAEAAAAAAAAAAAFUAywAgAEAAFYAKgJYAh4BDgEsAiwAWgGAAoAAoADUAIAAAAAAAAAAKwBVAIAAqwDVAQABKwAHAAAAAgBVAAADAAOrAAMABwAAMxEhESUhESFVAqv9qwIA%2FgADq%2FxVVQMAAAEAVf9kANUAgAAKAAAzNTMVFAYHJz4BN1WALy8bHh4BgHo9URQpDjQxAAEAgACrAwACVQAHAEkYAbAIELEHA%2FaxBgP2sAE8sAcQsAPVsQkD5rECA%2FawBTwAsQAAExCxAwblsQMBExCxBgX2sQEF5rADELEHBfWxAgX2sQUF5jEwEzYANxUGAAeAgAGAgID%2BgIABq6r%2Bq6tWqgFVqwAAAAABAAAAAQAA1XjOQV8PPPUAAwQA%2F%2F%2F%2F%2F9Y6E3P%2F%2F%2F%2F%2F1joTcwAA%2FyAEgAOrAAAACgACAAEAAAAAAAEAAAPo%2F2oAABdwAAD%2FtgSAAAEAAAAAAAAAAAAAAAAAAAADA1IAVQEzAFUDVgCAAAAAAAAAACgAAABSAAAAxQABAAAAAwBeAAUAAAAAAAIAgAQAAAAAAAQAAN4AAAAAAAAAFQECAAAAAAAAAAEAEgAAAAAAAAAAAAIADgASAAAAAAAAAAMAMAAgAAAAAAAAAAQAEgBQAAAAAAAAAAUAFgBiAAAAAAAAAAYACQB4AAAAAAAAAAgAHACBAAEAAAAAAAEAEgAAAAEAAAAAAAIADgASAAEAAAAAAAMAMAAgAAEAAAAAAAQAEgBQAAEAAAAAAAUAFgBiAAEAAAAAAAYACQB4AAEAAAAAAAgAHACBAAMAAQQJAAEAEgAAAAMAAQQJAAIADgASAAMAAQQJAAMAMAAgAAMAAQQJAAQAEgBQAAMAAQQJAAUAFgBiAAMAAQQJAAYACQB4AAMAAQQJAAgAHACBAE0AYQB0AGgAIABGAG8AbgB0AFIAZQBnAHUAbABhAHIATQBhAHQAaABzACAARgBvAHIAIABNAG8AcgBlACAATQBhAHQAaAAgAEYAbwBuAHQATQBhAHQAaAAgAEYAbwBuAHQAVgBlAHIAcwBpAG8AbgAgADEALgAwTWF0aF9Gb250AE0AYQB0AGgAcwAgAEYAbwByACAATQBvAHIAZQAAAwAAAAAAAAH0APoAAAAAAAAAAAAAAAAAAAAAAAAAALkHEQAAjYUYALIAAAAVFBOxAAE%2F)format('truetype')%3Bfont-weight%3Anormal%3Bfont-style%3Anormal%3B%7D%40font-face%7Bfont-family%3A'brack_sm2882ad605b1e27be87c7468'%3Bsrc%3Aurl(data%3Afont%2Ftruetype%3Bcharset%3Dutf-8%3Bbase64%2CAAEAAAAMAIAAAwBAT1MvMi7PH4UAAADMAAAATmNtYXA3kjw6AAABHAAAADxjdnQgAQYDiAAAAVgAAAASZ2x5ZkyYQ7YAAAFsAAAAkWhlYWQLyR8fAAACAAAAADZoaGVhAq0XCAAAAjgAAAAkaG10eDEjA%2FUAAAJcAAAADGxvY2EAAEKZAAACaAAAABBtYXhwBJsEcQAAAngAAAAgbmFtZW7QvZAAAAKYAAAB5XBvc3QArQBVAAAEgAAAACBwcmVwu5WEAAAABKAAAAAHAAACDAGQAAUAAAQABAAAAAAABAAEAAAAAAAAAQEAAAAAAAAAAAAAAAAAAAAAAAAAAAAAAAAAAAAAACAgICAAAAAg9AMD%2FP%2F8AAABVAABAAAAAAACAAEAAQAAABQAAwABAAAAFAAEACgAAAAGAAQAAQACI5wjn%2F%2F%2FAAAjnCOf%2F%2F%2FcZdxjAAEAAAAAAAAAAAFUAFQBAAArAIwAgACoAAcAAAACAAAAAADVAQEAAwAHAAAxMxEjFyM1M9XVq4CAAQHWqwABAAAAAABVAVgAAwAfGAGwAy%2BwADyxAgL1sAE8ALEDAD%2BwAjx8sQAG9bABPBEzESNVVQFY%2FqgAAQDXAAABLAFUAAMAIBgBsAUvsAE8sAI8sQAC9bADPACwAy%2BwAjyxAAH1sAE8EzMRI9dVVQFU%2FqwAAAAAAQAAAAEAAIsesexfDzz1AAMEAP%2F%2F%2F%2F%2FVre5k%2F%2F%2F%2F%2F9Wt7mT%2FgP%2F%2FAdYBWAAAAAoAAgABAAAAAAABAAABVP%2F%2FAAAXcP%2BA%2F4AB1gABAAAAAAAAAAAAAAAAAAAAAwDVAAABLAAAASwA1wAAAAAAAAAhAAAAWAAAAJEAAQAAAAMACgACAAAAAAACAIAEAAAAAAAEAABlAAAAAAAAABUBAgAAAAAAAAABACYAAAAAAAAAAAACAA4AJgAAAAAAAAADAEQANAAAAAAAAAAEACYAeAAAAAAAAAAFABYAngAAAAAAAAAGABMAtAAAAAAAAAAIABwAxwABAAAAAAABACYAAAABAAAAAAACAA4AJgABAAAAAAADAEQANAABAAAAAAAEACYAeAABAAAAAAAFABYAngABAAAAAAAGABMAtAABAAAAAAAIABwAxwADAAEECQABACYAAAADAAEECQACAA4AJgADAAEECQADAEQANAADAAEECQAEACYAeAADAAEECQAFABYAngADAAEECQAGABMAtAADAAEECQAIABwAxwBCAHIAYQBjAGsAZQB0AHMAIABzAG0AYQBsAGwAIABzAGkAegBlAFIAZQBnAHUAbABhAHIATQBhAHQAaABzACAARgBvAHIAIABNAG8AcgBlACAAQgByAGEAYwBrAGUAdABzACAAcwBtAGEAbABsACAAcwBpAHoAZQBCAHIAYQBjAGsAZQB0AHMAIABzAG0AYQBsAGwAIABzAGkAegBlAFYAZQByAHMAaQBvAG4AIAAyAC4AMEJyYWNrZXRzX3NtYWxsX3NpemUATQBhAHQAaABzACAARgBvAHIAIABNAG8AcgBlAAAAAAMAAAAAAAAAqgBVAAAAAAAAAAAAAAAAAAAAAAAAAAC5B%2F8AAo2FAA%3D%3D)format('truetype')%3Bfont-weight%3Anormal%3Bfont-style%3Anormal%3B%7D%40font-face%7Bfont-family%3A'bracketse552f5417ff4680c6b50499'%3Bsrc%3Aurl(data%3Afont%2Ftruetype%3Bcharset%3Dutf-8%3Bbase64%2CAAEAAAAMAIAAAwBAT1MvMi7RIisAAADMAAAATmNtYXBi7uzYAAABHAAAAExjdnQgBAkDLgAAAWgAAAASZ2x5Zo64f%2BkAAAF8AAABSWhlYWQLniGcAAACyAAAADZoaGVhBK4XLAAAAwAAAAAkaG10eCWq%2F90AAAMkAAAAFGxvY2EAABknAAADOAAAABhtYXhwBJIESAAAA1AAAAAgbmFtZRAA8I4AAANwAAAB3nBvc3QBwwDgAAAFUAAAACBwcmVwupWEAAAABXAAAAAHAAACggGQAAUAAAQABAAAAAAABAAEAAAAAAAAAQEAAAAAAAAAAAAAAAAAAAAAAAAAAAAAAAAAAAAAACAgICAAAAAg9AMEAAAAAAADgAAAAAAAAAACAAEAAQAAABQAAwABAAAAFAAEADgAAAAKAAgAAgACI5sjnSOeI6D%2F%2FwAAI5sjnSOeI6D%2F%2F9xm3GXcZdxkAAEAAAAAAAAAAAAAAAABVABWAQAALACoA4AAMgAHAAAAAgAAACoA1QNVAAMABwAANTMRIxMjETPV1auAgCoDK%2F0AAtUAAQAAAAABgAOAAAUAJBgBsAAvsAPFsQEC%2FbADELEEBP0AsQAAP7ABPLEEBj%2BwAzwwMTEzEAEjAFUBKyv%2BqwH8AYT%2BqgABAAAAAAGAA4AABQAmGAGwAC6wA8WxBQL9sAMQsQIE%2FQB8sQAGPxiwBTyxAwb2sAI8MDEREgEzABMBAVQr%2FtMCA4D91v6qAYQB%2FAAB%2F6wAAAEsA4AABQAnGAGwAC%2BwBzywA8WxAQL9sAMQsQQE%2FQCxAAA%2FsAE8sQQGP7ADPDAxISMSATMAASxVAf7UKwFVAfwBhP6rAAH%2FrAAAASwDgAAFACkYAbABL7AHPLAExbEAAv2wBBCxAwT9AHyxAQY%2FsAA8GLEEAD%2BwAzwwMRMzEAEjANdV%2FqsrASsDgP3V%2FqsBhgAAAAABAAAAAQAAeuTcpl8PPPUAAwQA%2F%2F%2F%2F%2F9Wt7o7%2F%2F%2F%2F%2F1a3ujv%2BsAAABgAOAAAAACgACAAEAAAAAAAEAAAOAAAAAABdw%2F6z%2FrAGAAAEAAAAAAAAAAAAAAAAAAAAFANUAAAEsAAABLAAAASz%2FrAEs%2F6wAAAAAAAAAJAAAAGgAAACzAAAA%2FQAAAUkAAQAAAAUACAACAAAAAAACAIAEAAAAAAAEAAA%2BAAAAAAAAABUBAgAAAAAAAAABACQAAAAAAAAAAAACAA4AJAAAAAAAAAADAEIAMgAAAAAAAAAEACQAdAAAAAAAAAAFABYAmAAAAAAAAAAGABIArgAAAAAAAAAIABwAwAABAAAAAAABACQAAAABAAAAAAACAA4AJAABAAAAAAADAEIAMgABAAAAAAAEACQAdAABAAAAAAAFABYAmAABAAAAAAAGABIArgABAAAAAAAIABwAwAADAAEECQABACQAAAADAAEECQACAA4AJAADAAEECQADAEIAMgADAAEECQAEACQAdAADAAEECQAFABYAmAADAAEECQAGABIArgADAAEECQAIABwAwABCAHIAYQBjAGsAZQB0AHMAIABmAHUAbABsACAAcwBpAHoAZQBSAGUAZwB1AGwAYQByAE0AYQB0AGgAcwAgAEYAbwByACAATQBvAHIAZQAgAEIAcgBhAGMAawBlAHQAcwAgAGYAdQBsAGwAIABzAGkAegBlAEIAcgBhAGMAawBlAHQAcwAgAGYAdQBsAGwAIABzAGkAegBlAFYAZQByAHMAaQBvAG4AIAAyAC4AMEJyYWNrZXRzX2Z1bGxfc2l6ZQBNAGEAdABoAHMAIABGAG8AcgAgAE0AbwByAGUAAAADAAAAAAAAAcAA4AAAAAAAAAAAAAAAAAAAAAAAAAAAuQf%2FAAGNhQA%3D)format('truetype')%3Bfont-weight%3Anormal%3Bfont-style%3Anormal%3B%7D%3C%2Fstyle%3E%3C%2Fdefs%3E%3Ctext%20font-family%3D%22horizontalbf65417dcecc7f2b0006e%22%20font-size%3D%2212%22%20text-anchor%3D%22middle%22%20x%3D%222.5%22%20y%3D%2213%22%3E%26%23x23AF%3B%3C%2Ftext%3E%3Ctext%20font-family%3D%22horizontalbf65417dcecc7f2b0006e%22%20font-size%3D%2212%22%20text-anchor%3D%22middle%22%20x%3D%226.5%22%20y%3D%2213%22%3E%26%23x23AF%3B%3C%2Ftext%3E%3Ctext%20font-family%3D%22horizontalbf65417dcecc7f2b0006e%22%20font-size%3D%2212%22%20text-anchor%3D%22middle%22%20x%3D%2210.5%22%20y%3D%2213%22%3E%26%23x23AF%3B%3C%2Ftext%3E%3Ctext%20font-family%3D%22horizontalbf65417dcecc7f2b0006e%22%20font-size%3D%2212%22%20text-anchor%3D%22middle%22%20x%3D%2214.5%22%20y%3D%2213%22%3E%26%23x23AF%3B%3C%2Ftext%3E%3Ctext%20font-family%3D%22Times%20New%20Roman%22%20font-size%3D%2216%22%20font-style%3D%22italic%22%20text-anchor%3D%22middle%22%20x%3D%226.5%22%20y%3D%2227%22%3EX%3C%2Ftext%3E%3Ctext%20font-family%3D%22math1d5a744be5825ca5bd6c2e20d0f%22%20font-size%3D%2214%22%20text-anchor%3D%22middle%22%20x%3D%2225.5%22%20y%3D%2227%22%3E%26%23x223C%3B%3C%2Ftext%3E%3Ctext%20font-family%3D%22Times%20New%20Roman%22%20font-size%3D%2216%22%20font-style%3D%22italic%22%20text-anchor%3D%22middle%22%20x%3D%2239.5%22%20y%3D%2227%22%3EN%3C%2Ftext%3E%3Ctext%20font-family%3D%22bracketse552f5417ff4680c6b50499%22%20font-size%3D%2216%22%20text-anchor%3D%22start%22%20x%3D%2247.5%22%20y%3D%2216%22%3E%26%23x239B%3B%3C%2Ftext%3E%3Ctext%20font-family%3D%22brack_sm2882ad605b1e27be87c7468%22%20font-size%3D%2216%22%20text-anchor%3D%22start%22%20x%3D%2247.5%22%20y%3D%2221%22%3E%26%23x239C%3B%3C%2Ftext%3E%3Ctext%20font-family%3D%22brack_sm2882ad605b1e27be87c7468%22%20font-size%3D%2216%22%20text-anchor%3D%22start%22%20x%3D%2247.5%22%20y%3D%2226%22%3E%26%23x239C%3B%3C%2Ftext%3E%3Ctext%20font-family%3D%22bracketse552f5417ff4680c6b50499%22%20font-size%3D%2216%22%20text-anchor%3D%22start%22%20x%3D%2247.5%22%20y%3D%2240%22%3E%26%23x239D%3B%3C%2Ftext%3E%3Ctext%20font-family%3D%22bracketse552f5417ff4680c6b50499%22%20font-size%3D%2216%22%20text-anchor%3D%22start%22%20x%3D%2292.5%22%20y%3D%2216%22%3E%26%23x239E%3B%3C%2Ftext%3E%3Ctext%20font-family%3D%22brack_sm2882ad605b1e27be87c7468%22%20font-size%3D%2216%22%20text-anchor%3D%22start%22%20x%3D%2292.5%22%20y%3D%2221%22%3E%26%23x239F%3B%3C%2Ftext%3E%3Ctext%20font-family%3D%22brack_sm2882ad605b1e27be87c7468%22%20font-size%3D%2216%22%20text-anchor%3D%22start%22%20x%3D%2292.5%22%20y%3D%2226%22%3E%26%23x239F%3B%3C%2Ftext%3E%3Ctext%20font-family%3D%22bracketse552f5417ff4680c6b50499%22%20font-size%3D%2216%22%20text-anchor%3D%22start%22%20x%3D%2292.5%22%20y%3D%2240%22%3E%26%23x23A0%3B%3C%2Ftext%3E%3Ctext%20font-family%3D%22Times%20New%20Roman%22%20font-size%3D%2216%22%20font-style%3D%22italic%22%20text-anchor%3D%22middle%22%20x%3D%2257.5%22%20y%3D%2227%22%3E%26%23x3BC%3B%3C%2Ftext%3E%3Ctext%20font-family%3D%22math1d5a744be5825ca5bd6c2e20d0f%22%20font-size%3D%2214%22%20text-anchor%3D%22middle%22%20x%3D%2265.5%22%20y%3D%2227%22%3E%2C%3C%2Ftext%3E%3Cline%20stroke%3D%22%23000%22%20stroke-linecap%3D%22square%22%20stroke-width%3D%221%22%20x1%3D%2269.5%22%20x2%3D%2288.5%22%20y1%3D%2221.5%22%20y2%3D%2221.5%22%2F%3E%3Ctext%20font-family%3D%22Times%20New%20Roman%22%20font-size%3D%2216%22%20font-style%3D%22italic%22%20text-anchor%3D%22middle%22%20x%3D%2275.5%22%20y%3D%2216%22%3E%26%23x3C3%3B%3C%2Ftext%3E%3Ctext%20font-family%3D%22Times%20New%20Roman%22%20font-size%3D%2212%22%20text-anchor%3D%22middle%22%20x%3D%2284.5%22%20y%3D%2211%22%3E2%3C%2Ftext%3E%3Ctext%20font-family%3D%22Times%20New%20Roman%22%20font-size%3D%2216%22%20font-style%3D%22italic%22%20text-anchor%3D%22middle%22%20x%3D%2279.5%22%20y%3D%2238%22%3En%3C%2Ftext%3E%3C%2Fsvg%3E)
The standard deviation of the distribution of the sample means depends on the sample size,
It is inversely proportional to the square root of the sample size
This means that the greater the sample size, the smaller the value of the standard deviation and the narrower the distribution of the sample means
Worked Example
A random sample of 10 observations is taken from the population of the random variable ![]() and the sample mean is calculated as
and the sample mean is calculated as ![]() . Write down the distribution of the sample mean,
. Write down the distribution of the sample mean, ![]() .
.

Examiner Tips and Tricks
Look carefully at the distribution given to determine whether the variance or the standard deviation has been given.
Did this video help you?
Central Limit Theorem
Does the distribution of the sample means always follow a normal distribution?
If the variable
for the population follows a normal distribution then the sample mean distribution also follows a normal distributionIf the variable
for the population does not follow a normal distribution then the sample mean distribution does not necessarily follow a normal distributionIf the sample size is small then
can not be assumed to follow a normal distributionIf the sample size is big enough then we can use the Central Limit Theorem to approximate
format('truetype')%3Bfont-weight%3Anormal%3Bfont-style%3Anormal%3B%7D%3C%2Fstyle%3E%3C%2Fdefs%3E%3Ctext%20font-family%3D%22horizontalbf65417dcecc7f2b0006e%22%20font-size%3D%2216%22%20text-anchor%3D%22middle%22%20x%3D%223.5%22%20y%3D%229%22%3E%26%23x23AF%3B%3C%2Ftext%3E%3Ctext%20font-family%3D%22horizontalbf65417dcecc7f2b0006e%22%20font-size%3D%2216%22%20text-anchor%3D%22middle%22%20x%3D%229.5%22%20y%3D%229%22%3E%26%23x23AF%3B%3C%2Ftext%3E%3Ctext%20font-family%3D%22Times%20New%20Roman%22%20font-size%3D%2216%22%20font-style%3D%22italic%22%20text-anchor%3D%22middle%22%20x%3D%226.5%22%20y%3D%2220%22%3EX%3C%2Ftext%3E%3C%2Fsvg%3E) using a normal distribution
using a normal distribution
What is the central limit theorem?
If a random sample of size n is taken from a population with mean µ and variance
 then the Central Limit Theorem states that can be approximated by the normal distribution
 format('truetype')%3Bfont-weight%3Anormal%3Bfont-style%3Anormal%3B%7D%40font-face%7Bfont-family%3A'brack_sm2882ad605b1e27be87c7468'%3Bsrc%3Aurl(data%3Afont%2Ftruetype%3Bcharset%3Dutf-8%3Bbase64%2CAAEAAAAMAIAAAwBAT1MvMi7PH4UAAADMAAAATmNtYXA3kjw6AAABHAAAADxjdnQgAQYDiAAAAVgAAAASZ2x5ZkyYQ7YAAAFsAAAAkWhlYWQLyR8fAAACAAAAADZoaGVhAq0XCAAAAjgAAAAkaG10eDEjA%2FUAAAJcAAAADGxvY2EAAEKZAAACaAAAABBtYXhwBJsEcQAAAngAAAAgbmFtZW7QvZAAAAKYAAAB5XBvc3QArQBVAAAEgAAAACBwcmVwu5WEAAAABKAAAAAHAAACDAGQAAUAAAQABAAAAAAABAAEAAAAAAAAAQEAAAAAAAAAAAAAAAAAAAAAAAAAAAAAAAAAAAAAACAgICAAAAAg9AMD%2FP%2F8AAABVAABAAAAAAACAAEAAQAAABQAAwABAAAAFAAEACgAAAAGAAQAAQACI5wjn%2F%2F%2FAAAjnCOf%2F%2F%2FcZdxjAAEAAAAAAAAAAAFUAFQBAAArAIwAgACoAAcAAAACAAAAAADVAQEAAwAHAAAxMxEjFyM1M9XVq4CAAQHWqwABAAAAAABVAVgAAwAfGAGwAy%2BwADyxAgL1sAE8ALEDAD%2BwAjx8sQAG9bABPBEzESNVVQFY%2FqgAAQDXAAABLAFUAAMAIBgBsAUvsAE8sAI8sQAC9bADPACwAy%2BwAjyxAAH1sAE8EzMRI9dVVQFU%2FqwAAAAAAQAAAAEAAIsesexfDzz1AAMEAP%2F%2F%2F%2F%2FVre5k%2F%2F%2F%2F%2F9Wt7mT%2FgP%2F%2FAdYBWAAAAAoAAgABAAAAAAABAAABVP%2F%2FAAAXcP%2BA%2F4AB1gABAAAAAAAAAAAAAAAAAAAAAwDVAAABLAAAASwA1wAAAAAAAAAhAAAAWAAAAJEAAQAAAAMACgACAAAAAAACAIAEAAAAAAAEAABlAAAAAAAAABUBAgAAAAAAAAABACYAAAAAAAAAAAACAA4AJgAAAAAAAAADAEQANAAAAAAAAAAEACYAeAAAAAAAAAAFABYAngAAAAAAAAAGABMAtAAAAAAAAAAIABwAxwABAAAAAAABACYAAAABAAAAAAACAA4AJgABAAAAAAADAEQANAABAAAAAAAEACYAeAABAAAAAAAFABYAngABAAAAAAAGABMAtAABAAAAAAAIABwAxwADAAEECQABACYAAAADAAEECQACAA4AJgADAAEECQADAEQANAADAAEECQAEACYAeAADAAEECQAFABYAngADAAEECQAGABMAtAADAAEECQAIABwAxwBCAHIAYQBjAGsAZQB0AHMAIABzAG0AYQBsAGwAIABzAGkAegBlAFIAZQBnAHUAbABhAHIATQBhAHQAaABzACAARgBvAHIAIABNAG8AcgBlACAAQgByAGEAYwBrAGUAdABzACAAcwBtAGEAbABsACAAcwBpAHoAZQBCAHIAYQBjAGsAZQB0AHMAIABzAG0AYQBsAGwAIABzAGkAegBlAFYAZQByAHMAaQBvAG4AIAAyAC4AMEJyYWNrZXRzX3NtYWxsX3NpemUATQBhAHQAaABzACAARgBvAHIAIABNAG8AcgBlAAAAAAMAAAAAAAAAqgBVAAAAAAAAAAAAAAAAAAAAAAAAAAC5B%2F8AAo2FAA%3D%3D)format('truetype')%3Bfont-weight%3Anormal%3Bfont-style%3Anormal%3B%7D%40font-face%7Bfont-family%3A'bracketse552f5417ff4680c6b50499'%3Bsrc%3Aurl(data%3Afont%2Ftruetype%3Bcharset%3Dutf-8%3Bbase64%2CAAEAAAAMAIAAAwBAT1MvMi7RIisAAADMAAAATmNtYXBi7uzYAAABHAAAAExjdnQgBAkDLgAAAWgAAAASZ2x5Zo64f%2BkAAAF8AAABSWhlYWQLniGcAAACyAAAADZoaGVhBK4XLAAAAwAAAAAkaG10eCWq%2F90AAAMkAAAAFGxvY2EAABknAAADOAAAABhtYXhwBJIESAAAA1AAAAAgbmFtZRAA8I4AAANwAAAB3nBvc3QBwwDgAAAFUAAAACBwcmVwupWEAAAABXAAAAAHAAACggGQAAUAAAQABAAAAAAABAAEAAAAAAAAAQEAAAAAAAAAAAAAAAAAAAAAAAAAAAAAAAAAAAAAACAgICAAAAAg9AMEAAAAAAADgAAAAAAAAAACAAEAAQAAABQAAwABAAAAFAAEADgAAAAKAAgAAgACI5sjnSOeI6D%2F%2FwAAI5sjnSOeI6D%2F%2F9xm3GXcZdxkAAEAAAAAAAAAAAAAAAABVABWAQAALACoA4AAMgAHAAAAAgAAACoA1QNVAAMABwAANTMRIxMjETPV1auAgCoDK%2F0AAtUAAQAAAAABgAOAAAUAJBgBsAAvsAPFsQEC%2FbADELEEBP0AsQAAP7ABPLEEBj%2BwAzwwMTEzEAEjAFUBKyv%2BqwH8AYT%2BqgABAAAAAAGAA4AABQAmGAGwAC6wA8WxBQL9sAMQsQIE%2FQB8sQAGPxiwBTyxAwb2sAI8MDEREgEzABMBAVQr%2FtMCA4D91v6qAYQB%2FAAB%2F6wAAAEsA4AABQAnGAGwAC%2BwBzywA8WxAQL9sAMQsQQE%2FQCxAAA%2FsAE8sQQGP7ADPDAxISMSATMAASxVAf7UKwFVAfwBhP6rAAH%2FrAAAASwDgAAFACkYAbABL7AHPLAExbEAAv2wBBCxAwT9AHyxAQY%2FsAA8GLEEAD%2BwAzwwMRMzEAEjANdV%2FqsrASsDgP3V%2FqsBhgAAAAABAAAAAQAAeuTcpl8PPPUAAwQA%2F%2F%2F%2F%2F9Wt7o7%2F%2F%2F%2F%2F1a3ujv%2BsAAABgAOAAAAACgACAAEAAAAAAAEAAAOAAAAAABdw%2F6z%2FrAGAAAEAAAAAAAAAAAAAAAAAAAAFANUAAAEsAAABLAAAASz%2FrAEs%2F6wAAAAAAAAAJAAAAGgAAACzAAAA%2FQAAAUkAAQAAAAUACAACAAAAAAACAIAEAAAAAAAEAAA%2BAAAAAAAAABUBAgAAAAAAAAABACQAAAAAAAAAAAACAA4AJAAAAAAAAAADAEIAMgAAAAAAAAAEACQAdAAAAAAAAAAFABYAmAAAAAAAAAAGABIArgAAAAAAAAAIABwAwAABAAAAAAABACQAAAABAAAAAAACAA4AJAABAAAAAAADAEIAMgABAAAAAAAEACQAdAABAAAAAAAFABYAmAABAAAAAAAGABIArgABAAAAAAAIABwAwAADAAEECQABACQAAAADAAEECQACAA4AJAADAAEECQADAEIAMgADAAEECQAEACQAdAADAAEECQAFABYAmAADAAEECQAGABIArgADAAEECQAIABwAwABCAHIAYQBjAGsAZQB0AHMAIABmAHUAbABsACAAcwBpAHoAZQBSAGUAZwB1AGwAYQByAE0AYQB0AGgAcwAgAEYAbwByACAATQBvAHIAZQAgAEIAcgBhAGMAawBlAHQAcwAgAGYAdQBsAGwAIABzAGkAegBlAEIAcgBhAGMAawBlAHQAcwAgAGYAdQBsAGwAIABzAGkAegBlAFYAZQByAHMAaQBvAG4AIAAyAC4AMEJyYWNrZXRzX2Z1bGxfc2l6ZQBNAGEAdABoAHMAIABGAG8AcgAgAE0AbwByAGUAAAADAAAAAAAAAcAA4AAAAAAAAAAAAAAAAAAAAAAAAAAAuQf%2FAAGNhQA%3D)format('truetype')%3Bfont-weight%3Anormal%3Bfont-style%3Anormal%3B%7D%3C%2Fstyle%3E%3C%2Fdefs%3E%3Ctext%20font-family%3D%22Times%20New%20Roman%22%20font-size%3D%2216%22%20text-anchor%3D%22middle%22%20x%3D%226.5%22%20y%3D%2227%22%3EN%3C%2Ftext%3E%3Ctext%20font-family%3D%22bracketse552f5417ff4680c6b50499%22%20font-size%3D%2216%22%20text-anchor%3D%22start%22%20x%3D%2213.5%22%20y%3D%2216%22%3E%26%23x239B%3B%3C%2Ftext%3E%3Ctext%20font-family%3D%22brack_sm2882ad605b1e27be87c7468%22%20font-size%3D%2216%22%20text-anchor%3D%22start%22%20x%3D%2213.5%22%20y%3D%2221%22%3E%26%23x239C%3B%3C%2Ftext%3E%3Ctext%20font-family%3D%22brack_sm2882ad605b1e27be87c7468%22%20font-size%3D%2216%22%20text-anchor%3D%22start%22%20x%3D%2213.5%22%20y%3D%2226%22%3E%26%23x239C%3B%3C%2Ftext%3E%3Ctext%20font-family%3D%22bracketse552f5417ff4680c6b50499%22%20font-size%3D%2216%22%20text-anchor%3D%22start%22%20x%3D%2213.5%22%20y%3D%2240%22%3E%26%23x239D%3B%3C%2Ftext%3E%3Ctext%20font-family%3D%22bracketse552f5417ff4680c6b50499%22%20font-size%3D%2216%22%20text-anchor%3D%22start%22%20x%3D%2258.5%22%20y%3D%2216%22%3E%26%23x239E%3B%3C%2Ftext%3E%3Ctext%20font-family%3D%22brack_sm2882ad605b1e27be87c7468%22%20font-size%3D%2216%22%20text-anchor%3D%22start%22%20x%3D%2258.5%22%20y%3D%2221%22%3E%26%23x239F%3B%3C%2Ftext%3E%3Ctext%20font-family%3D%22brack_sm2882ad605b1e27be87c7468%22%20font-size%3D%2216%22%20text-anchor%3D%22start%22%20x%3D%2258.5%22%20y%3D%2226%22%3E%26%23x239F%3B%3C%2Ftext%3E%3Ctext%20font-family%3D%22bracketse552f5417ff4680c6b50499%22%20font-size%3D%2216%22%20text-anchor%3D%22start%22%20x%3D%2258.5%22%20y%3D%2240%22%3E%26%23x23A0%3B%3C%2Ftext%3E%3Ctext%20font-family%3D%22Times%20New%20Roman%22%20font-size%3D%2216%22%20font-style%3D%22italic%22%20text-anchor%3D%22middle%22%20x%3D%2223.5%22%20y%3D%2227%22%3E%26%23x3BC%3B%3C%2Ftext%3E%3Ctext%20font-family%3D%22math1f7177163c833dff4b38fc8d287%22%20font-size%3D%2214%22%20text-anchor%3D%22middle%22%20x%3D%2231.5%22%20y%3D%2227%22%3E%2C%3C%2Ftext%3E%3Cline%20stroke%3D%22%23000%22%20stroke-linecap%3D%22square%22%20stroke-width%3D%221%22%20x1%3D%2235.5%22%20x2%3D%2254.5%22%20y1%3D%2221.5%22%20y2%3D%2221.5%22%2F%3E%3Ctext%20font-family%3D%22Times%20New%20Roman%22%20font-size%3D%2216%22%20font-style%3D%22italic%22%20text-anchor%3D%22middle%22%20x%3D%2241.5%22%20y%3D%2216%22%3E%26%23x3C3%3B%3C%2Ftext%3E%3Ctext%20font-family%3D%22Times%20New%20Roman%22%20font-size%3D%2212%22%20text-anchor%3D%22middle%22%20x%3D%2250.5%22%20y%3D%2211%22%3E2%3C%2Ftext%3E%3Ctext%20font-family%3D%22Times%20New%20Roman%22%20font-size%3D%2216%22%20font-style%3D%22italic%22%20text-anchor%3D%22middle%22%20x%3D%2245.5%22%20y%3D%2238%22%3En%3C%2Ftext%3E%3C%2Fsvg%3E) provided n is large enough
provided n is large enoughNotice the variance is still divided by the size of the sample
We usually say n is large enough if it is at least 30
This is a powerful theorem as it allows us to use the normal distribution for even when the population itself does not follow a normal distribution
If the population follows a normal distribution then the Central Limit Theorem is not needed as
will be normal automaticallyThis is important as you might be asked whether the Central Limit Theorem was needed
Worked Example
The integers 1 to 29 are written on counters and placed in a bag. The expected value when one is picked at random is 15 and the variance is 70. Susie randomly picks 40 integers, returning the counter after each selection.
Find the probability that the mean of Susie’s 40 numbers is less than 13. Explain whether it was necessary to use the Central Limit Theorem in your calculation.

Examiner Tips and Tricks
If asked to explain whether it was necessary to use the Central Limit Theorem, check whether the population follows a normal distribution, if it does not then check the size of the sample. If your answer is yes comment on both of these things.

You've read 0 of your 5 free revision notes this week
Unlock more, it's free!
Did this page help you?