Transforming Graphs using Logs (Cambridge (CIE) AS Maths): Revision Note
Exam code: 9709

Did this video help you?
Transforming graphs using logs
What are logarithmic axes?
For graphs that increase or decrease exponentially
it can be very difficult to read specific values from the scales on the axes

Taking ln of both sides allows the equation to be rearranged into the form “y = mx + c”

Plotting ln y against t produces a straight line
The
 -axis is a logarithmic axis
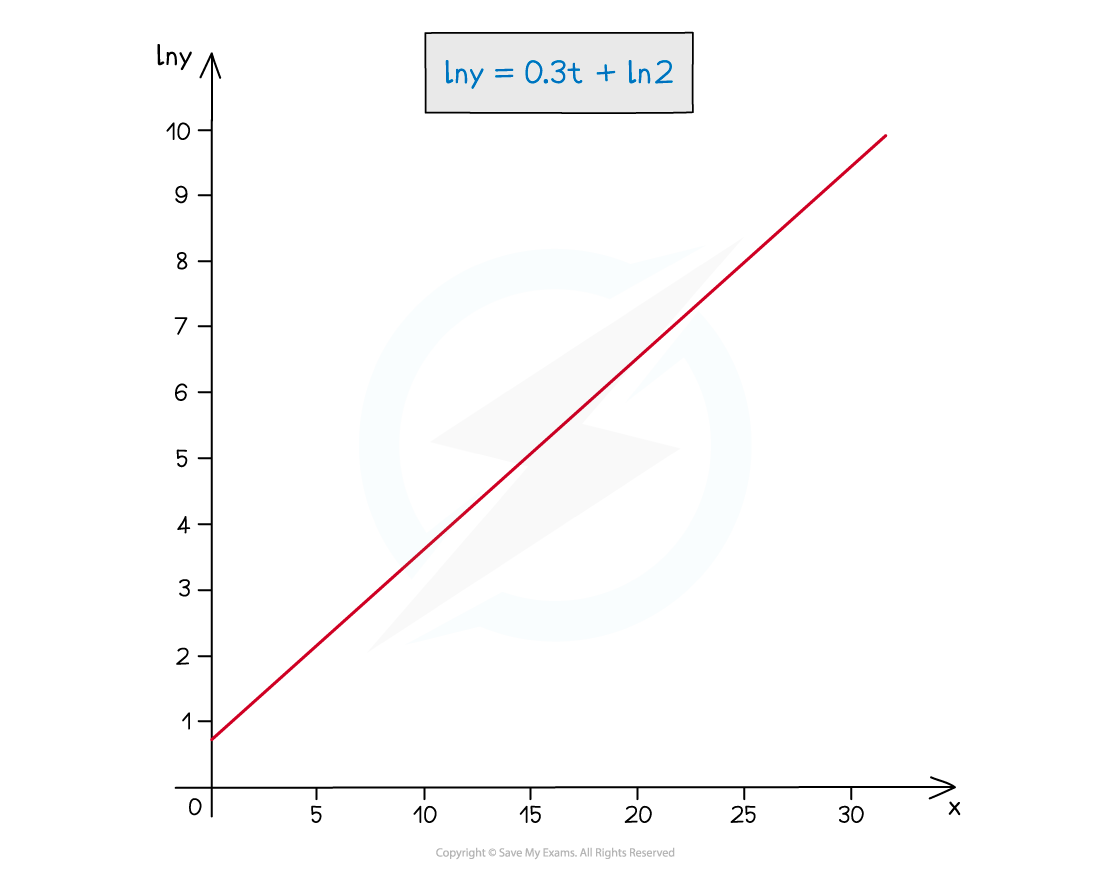
Note the second graph has ln y on the y-axis
Log graphs have at least one logarithmic axis
Reading a value for ln y at t = 20 is easier than reading the value for y
Logarithmic axes are used where a wide range of numbers can occur
it makes numbers smaller and easier to deal with
a curve can be turned into a straight line

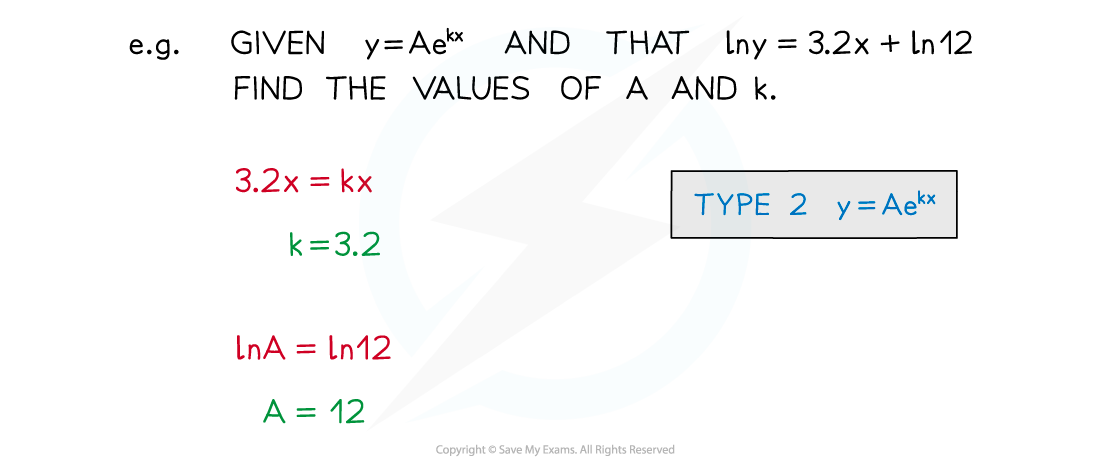
How do I transform graphs into straight lines using logs?
Exponential models are of the form
y=Abkx (growth)
y=Ab-kx (decay)
To use a model to make predictions the values of A, b and k are needed
A, b and k will usually be estimated from observed data values
A may be known exactly, as it is a starting/initial value
Estimating from a straight line graph is easier than from a curve


Worked Example


Unlock more, it's free!
Join the 100,000+ Students that ❤️ Save My Exams
the (exam) results speak for themselves:

Was this revision note helpful?