Resource Management (AQA GCSE Geography): Revision Note
Exam code: 8035

Specification links
The notes on this page cover part of 3.2.3 The challenge of resource management on the AQA GCSE specification. (opens in a new tab)
3.2.3 - Key idea: Food, water and energy are fundamental to human development.
The significance of food, water and energy to economic and social well-being.
An overview of global inequalities in the supply and consumption of resources.
Resource management
Resources are things which have value to humans
Food, water and energy are the most important resources
They are essential for people to be healthy and be secure
Resources' impact on development
Areas with plentiful resources tend to have higher levels of development
Where resources are scarce, quality of life and economic development tend to be lower
Resource security is having a reliable and affordable supply of food, water and energy
Food
A well-balanced diet is essential in maintaining health and well-being
In many high-income countries (HICs), the intake of calories is higher than people need, leading to increasing levels of obesity
In low-income countries (LICs), the intake of calories is on average lower than needed
To be able to work and be productive, people need to have a good diet
Over 800 million people are at risk from life-threatening hunger (undernourished): almost 9% of the world's population
One in four people (25%) are moderately or severely food insecure
Undernourishment particularly impacts on children
22% of children below 5 years are 'stunted', which means they are significantly shorter than the average for their age
People in Asia and Sub-Saharan Africa are most at risk

Water
Water is essential to life
It is used in all aspects of life for domestic use, agriculture, industry and energy
Supply of water varies across the world, dependent on climate
One in four (25%) of the world's population does not have access to safe drinking water
Water scarcity affects over 4 billion people globally

Water infrastructure is expensive
Many areas suffer water scarcity; this can be of two forms
Economic water scarcity is when countries cannot afford to exploit water resources by setting up infrastructure
Physical water scarcity is when there is a lack of water
Some countries have both physical and economic water scarcity
LICs and NEEs use most water for agriculture
NICs use most water for industry
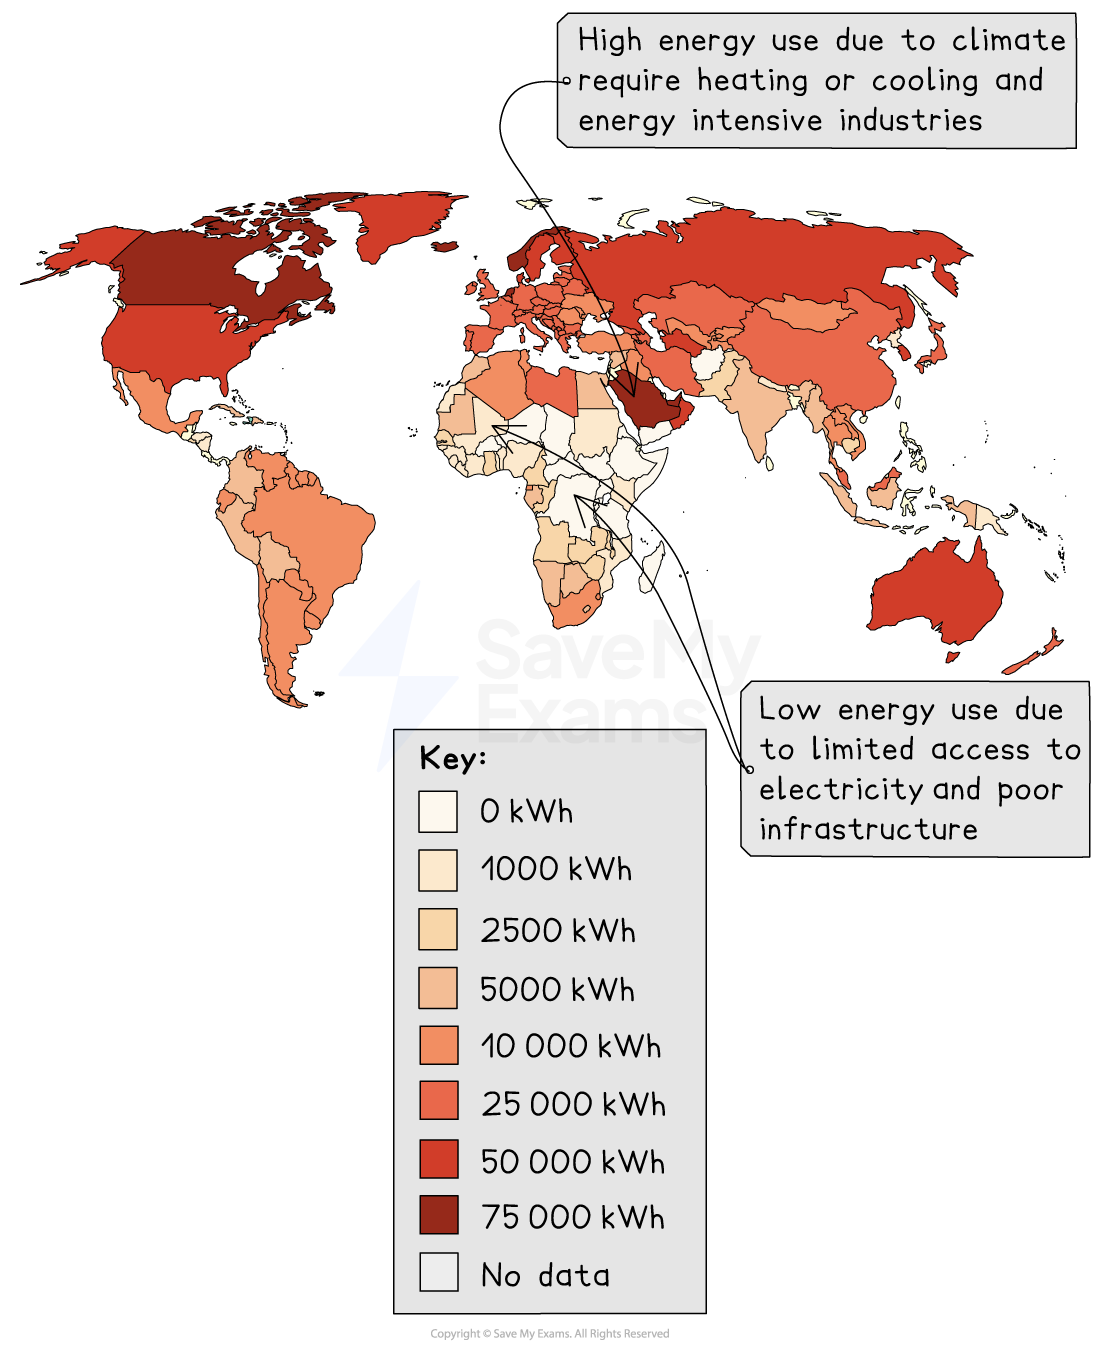
Energy
Humans need energy for light, heat and power
The agricultural and industrial revolutions, which led to huge strides in development, were driven by improvements in power
HICs consume more energy than LICs
NEEs are experiencing increased demand for energy due to domestic and industrial demand
Energy consumption is dominated by fossil fuels
The use of renewable energies are increasing
Resource management in the UK – Food
Food demand in the UK is changing
The demand for food is increasing
The types of food eaten are increasingly varied
Increasing amounts of food are imported
The demand for organic produce is increasing
As the population increases, so does the demand for food
People consume more food than they did 50 years ago in the UK
Food imports
The UK imports approximately 46% of the food the population consumes; this is the result of
Cheaper food being available from abroad
Increased demand for foods which are unavailable in the UK due to the climate
The demand for the same foods all year round: for example, salad crops, which are only grown in the UK in spring and summer

Previously in the UK the food people ate was the food in season:
Strawberries in summer, cabbages in winter
Food imports mean that people no longer need to eat seasonally; foods can be grown abroad and imported
Food imports lead to increased food miles
This increases the carbon footprint of the individuals and the UK as a whole
Organic produce
The purchase and consumption of organic food and drink has steadily increased over the last twenty years

Organic food is grown:
Without using artificial pesticides and fertilisers
Using natural predators to control pests
Using natural fertilisers such as green manures
Using crop rotation
Without the use of hormones and routine use of antibiotics
Yields on organic farms may be lower (yields improve over time)
More labour is used
Organic farms tend to be smaller
These factors lead to increased cost of organic produce
This has led to increased numbers of organic farm box schemes around the UK
Riverford Organic Farms
Coombe Farm Organic
Abel and Cole
The amount of organic produce available in supermarkets has also increased
Agribusiness
This involves applying business principles to farming
The main aim is to increase food production via any means
Increasing field size through the removal of hedgerows; this improves yields and efficiency
Combining smaller farms to create larger farms
Increased use of pesticides, herbicides and artificial fertilisers
Packaging and transporting of products also completed by the arm
Worked Example
Study Figure 1, a table showing mango imports into the UK, 2012-2016

Figure 1
Calculate the percentage increase in mango imports into the UK between 2012 and 2016.
Answer to the nearest whole percentage and show your working.
[2 marks]
Answer:
(66−38/38)×100=(38/28)×100= 73.68% [1]
Rounded up = 74% [1]
Marking guidance
Showing the correct working but the final answer incorrect [1]
A mathematically correct answer (73.68/73.7%) but have not rounded correctly to a whole number [1]
A correct answer (74%) and no working [1]
Percentage not required
Resource management in the UK - Water
The average person in the UK uses 152 litres of water a day
Less than 5% of this is used for drinking
It is estimated that the south-east of England will need an additional 1 billion litres of water by 2050 to meet the increased demand
The increases in demand in the UK are the result of:
Population growth
People showering and washing clothes more frequently
Farming systems such as greenhouses need more water for irrigation
More use of washing machines, dishwashers, power washers, hosepipes
Increasing use of water by industry and energy generation
Supply of water
The north and west of the UK have a water surplus
Levels of precipitation are higher in the north and east
Population density is lower
The south and east of the UK have a water deficit
Levels of precipitation are lower in the south and east
Population density is higher

Water stress is experienced by much of the UK

Water stress in England
Water transfer
To meet the water demand in some locations in the UK water transfer is needed
Water transfer schemes include:
Pipelines
Using canals and existing waterways
Dams and reservoirs such as Kielder Water, Northumberland, and Vyrnwy, Wales

A national water grid has been proposed but has not gone ahead due to:
Cost of installing pipelines and building transfers
Effects on local communities, as people would need to be moved
Construction of dams and reservoirs can impact on ecosystems and habitats
Water quality – pollution
Water quality in the UK is managed by the Environment Agency
Water quality in the UK has improved but only 14% of rivers meet the good ecological status criteria
Pollution comes from a variety of sources
Agriculture
Pesticides and fertilisers dissolve in rainfall and drain into water systems
Pesticides kill aquatic animals
Fertilisers can lead to eutrophication
Industry
Untreated waste from factories
Toxic waste kills animals and plants
It may also get into the food chain and be toxic to humans if they eat fish which is contaminated
Drinking water may be contaminated
Energy production
Water is used for cooling and then returned to rivers at higher temperatures
Higher water temperatures can lead to wildlife deaths
Transport
Gritting of roads leads to increased salinity of water and petrol/diesel waste from vehicles
Toxic waste kills animals and plants
It may also get into the food chain and be toxic to humans if they eat fish which is contaminated
Domestic
Sewage waste which contains bacteria
Bacteria in the water can be harmful to wildlife and cause illness in humans
Mining
Heavy metals leach into the water system
Toxic waste kills animals and plants
It may also get into the food chain and be toxic to humans if they eat fish which is contaminated
Water quality – management
Water quality in the UK is managed by the Environment Agency
There are strict water quality laws, such as the Clean Water Act, 1989 and the Water Industry Act, 1991 which:
Restrict the types and amounts of discharge from industry and domestic systems
Has standards for wildlife health
Government campaigns to educate people about not wasting water and not disposing of inappropriate waste (wet wipes, nappies) in the water system
Water treatment facilities are used to clean water supplies, removing bacteria, algae and solid waste
Investment in new pipes and sewage systems to reduce leaks
Worked Example
There is a need to transfer water in the UK to maintain supplies.
Explain how changing demand for water increases this need.
[3 marks]
Answer:
The UK’s population is growing, which means more water is needed [1 mark] much of this growth is in the southeast [1 mark], which means that there will be more unmet demand unless supplies are moved. [1 mark]
Marking guidance
The first mark will be awarded for recognition of the issue – a factor which is increasing water demand.
The second and third marks are awarded for linking the fact that the rising demand is happening in the areas of deficit
Alternative content
The answer above is just one example of a response to this question. Other information that could be used in the answer includes:
Many people now have appliances which use water, e.g., dishwashers, and these are more likely in the richer southeast, so the demand in this area goes up when they have little water.
Lots of new homes are being built in the southeast, and London is expected to be more than 10 million by 2035 so there will be more demand where there is already a deficit.
Resource management in the UK – Energy
Energy consumption has fallen in the UK since 1970 by approximately 13%
The reduction in energy consumption is the result of
Declining manufacturing industry
Reduced domestic energy consumption due to energy-efficient appliances, improved insulation, etc.
Energy mix
The UK's energy mix has changed over the last 35 years
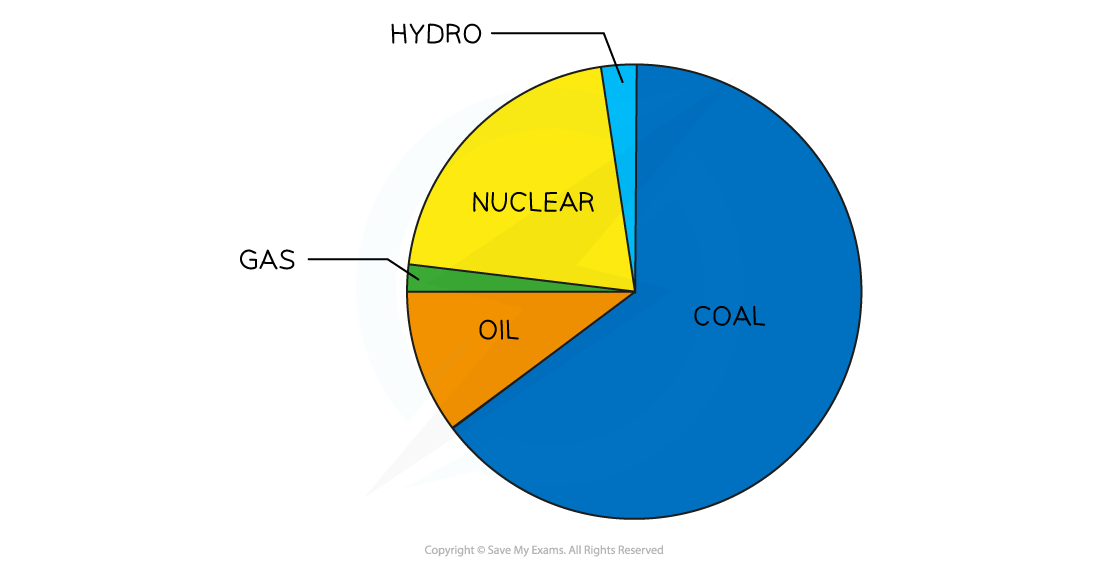
In 1990 UK electricity production relied on fossil fuels: over 75% of electricity was generated by coal, oil or gas
In 2015 the UK electricity production relied on a mix of energy sources, with the reliance on fossil fuels reduced and renewable energy sources increased
Over 50% of electricity is still produced using fossil fuels

Reliance on fossil fuels is being reduced for three main reasons:
Oil, gas and coal reserves are running out
Fossil fuels emit greenhouse gas emissions which contribute to global warming
The last coal-fired power station closed in 2024
Renewables are increasingly important because:
They do not emit greenhouse gases when generating electricity (though some greenhouse gases are emitted in the manufacture of wind turbines, solar panels etc...)
The costs of renewable energies are decreasing
Nuclear energy does not emit greenhouse gases but is non-renewable
Energy security
The UK is increasingly dependent on imported energy
Over 50% of the UK's gas supply is imported, mainly from Norway
Over 11% of oil is imported, mainly from Norway but also in the past Russia, though this has reduced since the war in Ukraine
This impacts whether the UK is energy-secure
Energy source issues
There are several environmental and economic issues with the exploitation of all energy sources
Fossil fuels
Economic issues |
|
|---|---|
Environmental issues |
|
Nuclear energy
Economic issues |
|
|---|---|
Environmental issues |
|
Renewable energy
Economic issues |
|
|---|---|
Environmental issues |
|
Worked Example
Using Figure 10 and your understanding, discuss the issues arising from the UK’s changing energy mix.

Answer:
Figure 10 shows that there has been a shift in the UK from using mainly fossil fuels as an energy source in 2006 when they made up 76% of the energy mix, to 52% in 2016 [U]. Renewable energy sources increased to 25%. [U]
This presents both opportunities and challenges for the UK. Investment in renewable energy will create jobs in some areas, such as the construction of wind turbines in the Humber estuary region [AP]. Using renewables will also reduce greenhouse gas emissions and air pollution [AP].
However, there will also be challenges for example, the loss of jobs in power stations run by fossil fuels [AP]. Additionally, renewable energy is not yet as efficient as fossil fuels so meeting the demand for energy may be more difficult, resulting in the UK having to import more energy, reducing energy security [AP].
Mark Scheme and Guidance
Mark allocation
This is a 'level of response' answer. Each point made in the answer does not equal a mark.
3 marks for understanding [U] the issues around changing the means of electricity generation
3 marks for applying [Ap] the evidence to show interpretation of the resources and discussion of the issues
The command is 'discuss', and the answer needs to show the application of understanding that changing the energy mix has both advantages and disadvantages.
When discussing the issues, it is important to use the correct keywords, such as 'energy security', 'renewables' and 'non-renewables'.
Alternative content
The answer above is just one example of a response to this question. Other information that could be used in the answer includes:
the impact on jobs in coal mining
the effects of increased nuclear energy

Unlock more, it's free!
Join the 100,000+ Students that ❤️ Save My Exams
the (exam) results speak for themselves:

Was this revision note helpful?