Geographical Skills (AQA GCSE Geography): Exam Questions

Exam code: 8035

52 mins23 questions
1a
1 mark

Coastal landscapes in the UK

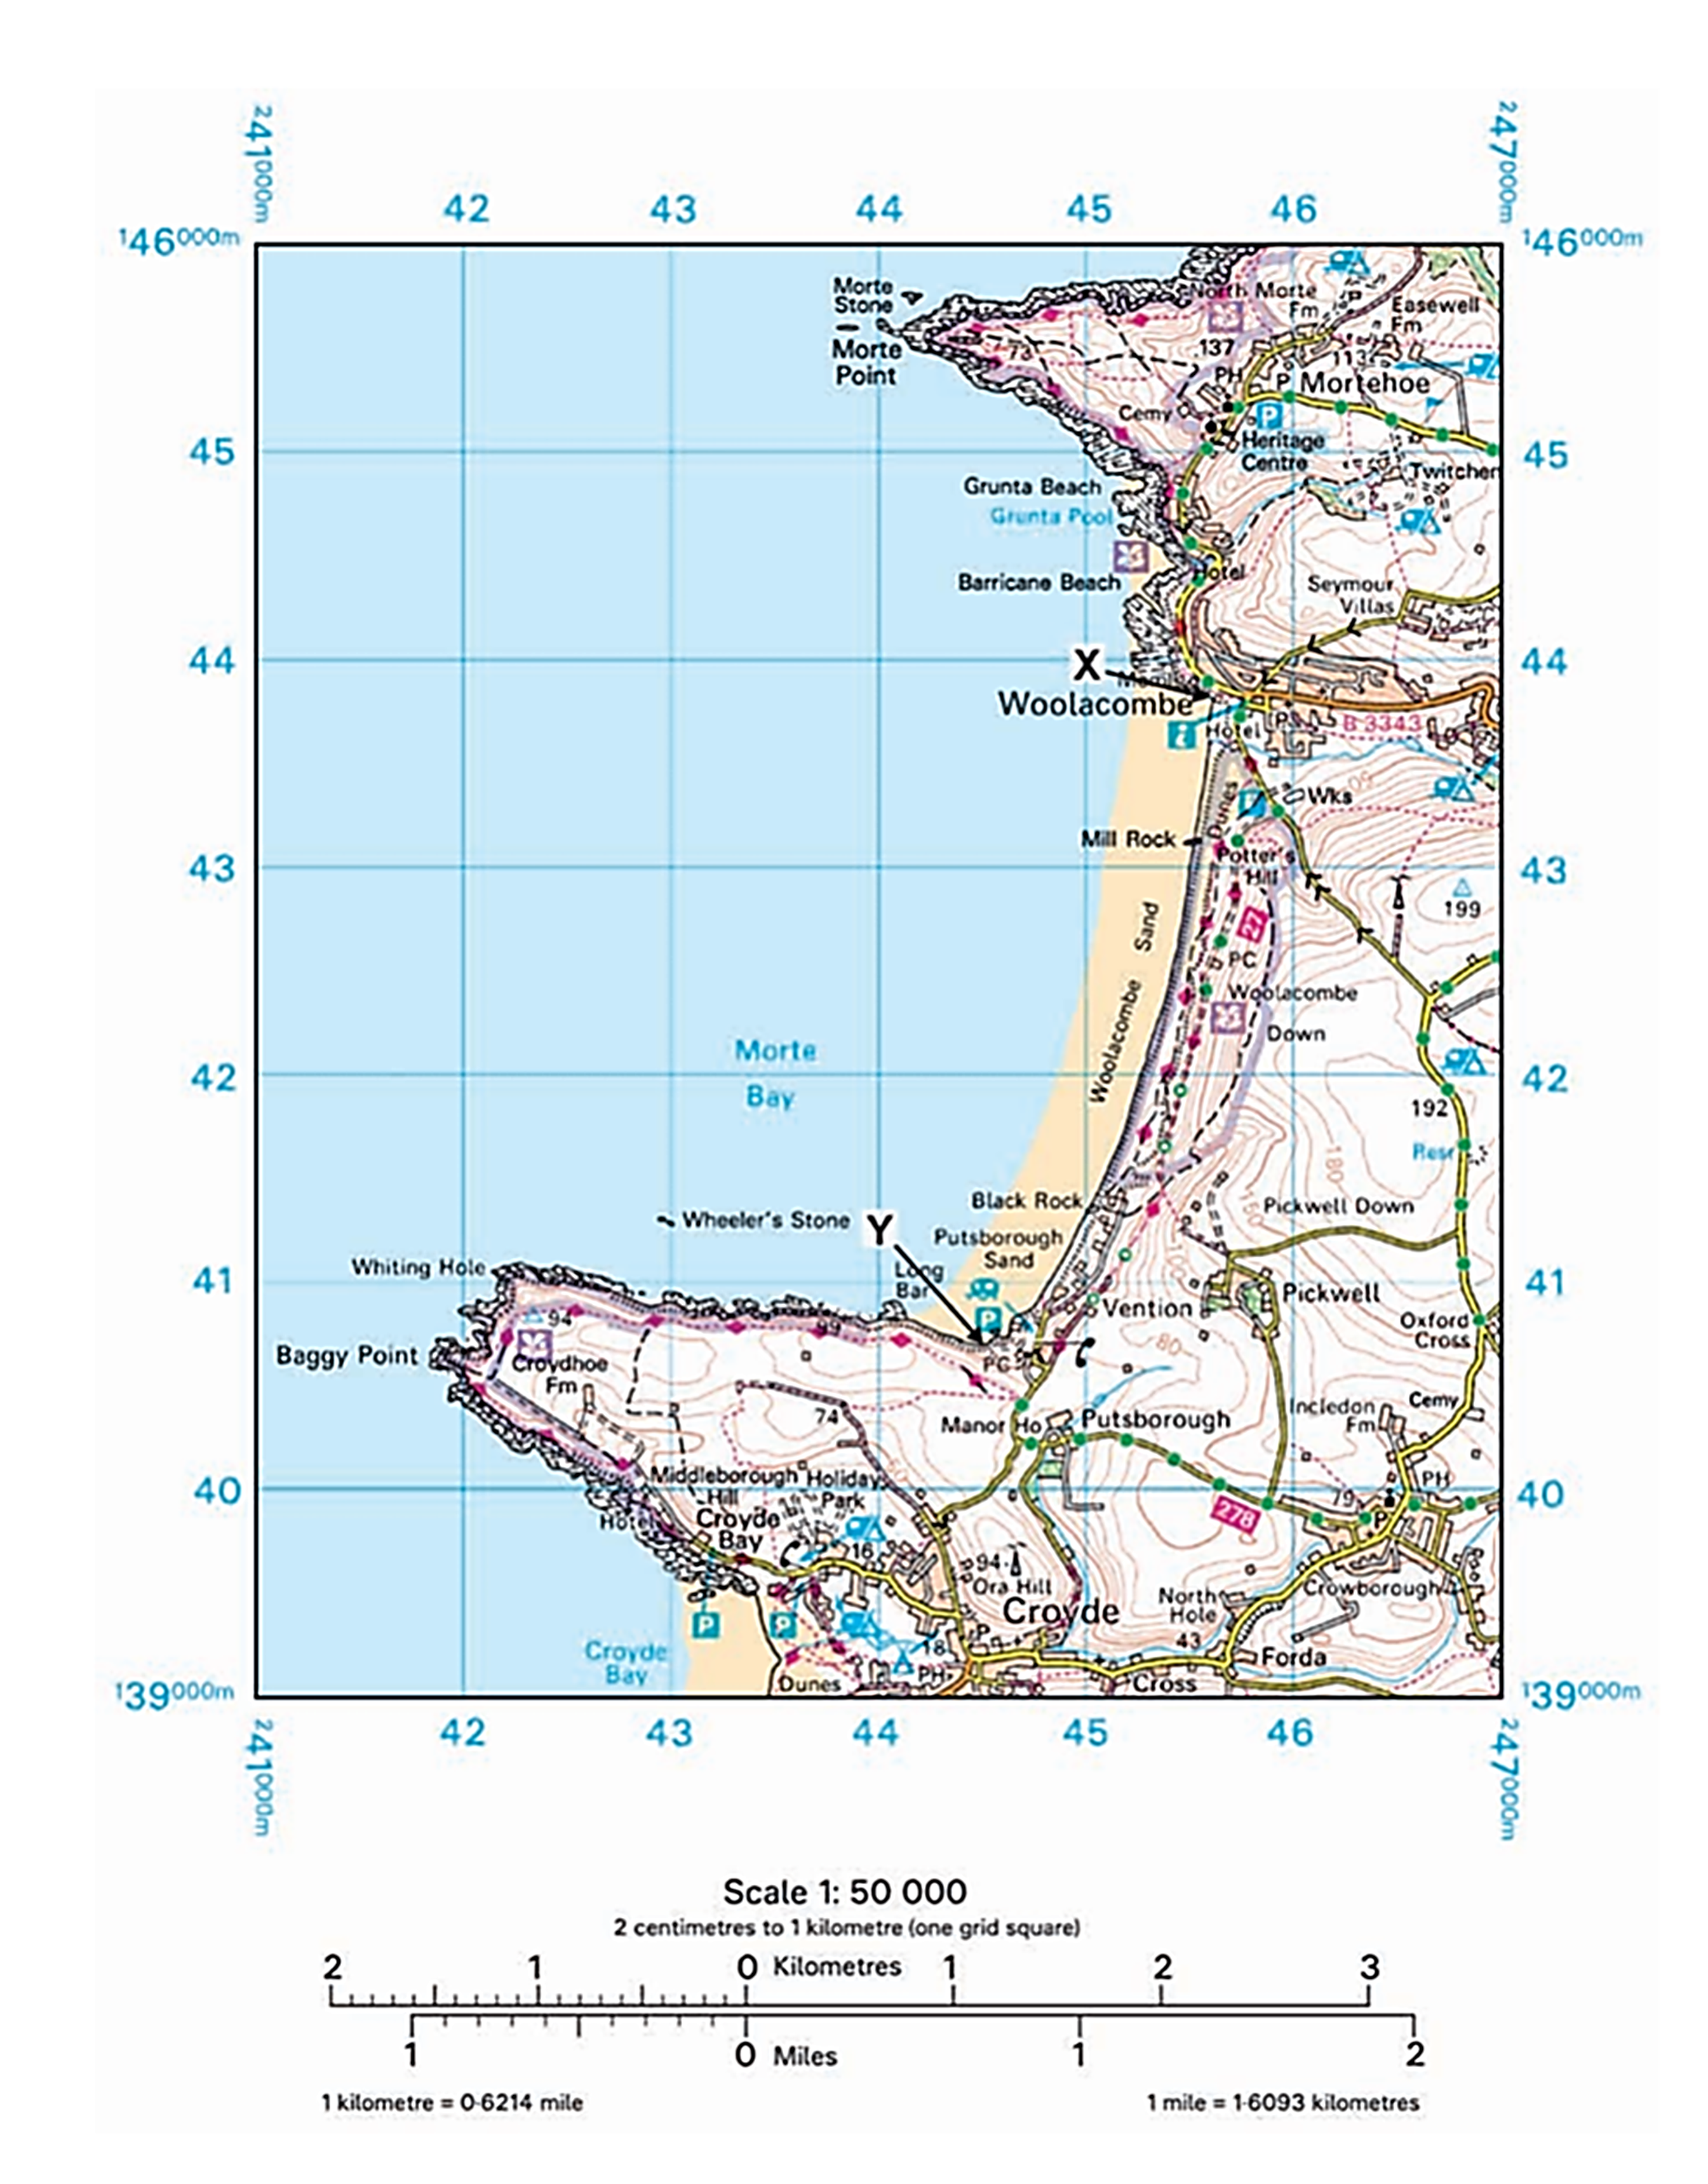
Study Figure 10 on the insert, a 1:50 000 Ordnance Survey map of the Woolacombe area in North Devon.

fig-10-june-2018-paper1-insert-gcse-aqa-geo

Using Figure 10, give the four-figure grid reference for a headland with cliffs.

Shade one circle only.

  • 4542

  • 4643

  • 4240

  • 4441

1b
1 mark

Using Figure 10, which of the following coastal features is not shown in grid square 4339?

  • An area of sand dunes

  • A rocky wave cut platform

  • A wide sandy beach

  • A coastal spit

1c
1 mark

Using Figure 10, what is the length and average width of Woolacombe beach between 456438 (labelled Y)?

Shade one circle only

  • Beach length 3.8 km, average width 0.7 km

  • Beach length 4.1 km, average width 0.2 km

  • Beach length 3.3 km, average width 0.4 km

  • Beach length 3.0 km, average width 0.9 km

2a
1 mark

Study Figure 3, a 1:25 000 Ordnance Survey map showing part of Liverpool, city in the UK.

Areas X and Y show two areas of urban regeneration.

q_qNnxXT_fig-3-june-2019-paper2-qp-gcse-aqa-geo

What is the approximate area covered by Area Y?

Shade one circle only.

  • 0.1 km2

  • 0.4 km2

  • 0.7 km2

  • 1.0 km2

2b
1 mark

Give the four-figure grid reference for the Albert Dock.

2c
2 marks

Describe the location of Area X.

3a
1 mark

Study Figure 6, a 1:50 000 Ordnance Survey map of an area to the east of Sheffield, a city in the UK.

fig-6-june-2019-paper2-qp-gcse-aqa-geo

Using Figure 6, give the six-figure grid reference for the centre of the motorway junction.
Shade one circle only.

  • 403870

  • 423884

  • 430891

  • 433 892

3b
1 mark

Using Figure 6, what is the straight line distance from the building labelled X to the railway station to the west?
Shade one circle only.

  • 200 m

  • 1 km

  • 2 km

  • 4 km

3c
1 mark

Study Figure 7, a photograph of part of the area shown in Figure 6.

fig-7-june-2019-paper2-qp-gcse-aqa-geo

Using Figure 6 and Figure 7, in which direction was the photographer facing when the photograph was taken?

Shade one circle only.

  • North west

  • North east

  • South west

  • South east

3d
1 mark

Figure 7 shows the location of Sheffield University’s Advanced Manufacturing Research Centre.
Use Figure 7 to describe one characteristic of the Centre’s location.

4a
1 mark

Coastal landscapes in the UK

Study Figure 8, a 1:50 000 Ordnance Survey map (opens in a new tab) of part of the coastline in Norfolk.

fig-8-nov-2021-paper-1-aqa-gcse-geography

Using Figure 8, how long is the coastline between points X and Y

Shade one circle only.

  • 2.4 km

  • 2.8 km

  • 3.2 km

  • 3.6 km

4b
1 mark

Using Figure 8, what direction would you be facing from the lighthouse at 676 421 to the dunes at 690 433?

4c
2 marks

Using Figure 8, describe one piece of evidence which suggests that Hunstanton is a tourist resort.

5a
1 mark

Glacial landscapes in the UK

Study Figure 15, a 1:50 000 Ordnance Survey map (opens in a new tab) showing part of Snowdonia in Wales.

fig-15-nov-2021-paper-1-aqa-gcse-geography

Using Figure 15, what is the difference in height between the spot height at 556577 and the spot height at 532577?

5b
2 marks

Using Figure 15, describe the land use shown in the highlighted grid square 5456.

5c
1 mark

Using Figure 15 and Figure 16, identify the grid square where point X is located. Shade one circle only.

  • 5555

  • 5354

  • 5654

  • 5554

5d
1 mark

Study Figure 16, a photograph looking north west across Llyn Cwellyn shown on Figure 15.

fig-16-nov-2021-paper-1-aqa-gcse-geography

Using Figure 16, suggest one piece of evidence that shows this area was glaciated.

6a
1 mark

River landscapes in the UK

Study Figure 12, a 1:50 000 Ordnance Survey map (opens in a new tab) of part of Dartmoor National Park.

fig-12-nov-2021-paper-1-aqa-gcse-geography

Using Figure 12, identify a feature of the East Dart River at 627 811.

6b
2 marks

Describe the relief (height and shape of the land) in the highlighted grid square 6082.

6c
1 mark

Study Figure 13, a photograph of the East Dart River taken looking upstream from point X on Figure 12.

fig-13-nov-2021-paper-1-aqa-gcse-geography

Using Figure 12 and Figure 13, which direction was the photographer facing when the picture was taken?
Shade one circle only.

  • North east

  • East

  • South

  • South west

6d
1 mark

Suggest one way that the river valley shown in Figure 13 may change as it goes downstream.

7
1 mark

Study Figure 2, a satellite image showing Cyclone Idai approaching Mozambique, Africa in March 2019.

-ciuXmJb_fig-2-june-2020-paper1-qp-gcse-aqa-geo

Describe the structure of Cyclone Idai shown in Figure 2.

8
1 mark

Study Figure 1, a map showing a weather forecast for the UK on 1 March 2018.

Figure 1

6f9cc53d-cd88-4901-8e48-97c440cb76aa

Using Figure 1, which one of the following statements is true?

Shade one circle only.

  • The London area has an amber snow warning.

  • The whole of the UK has a snow warning.

  • Cardiff has a red snow warning.

  • Edinburgh is not forecast to have snow.

9a
3 marks

Study Figure 3, a map showing the distribution and frequency of tropical storms.

fig-3-june-2019-paper1-qp-gcse-aqa-geo

Using Figure 3, complete the following paragraph.


Most tropical storms happen between latitudes 5 degrees and 30 degrees north and south of the ______. 
On average, three or more tropical storms per year take place in the East Pacific and ______.

In the Caribbean the main months for tropical storms are between ______.

9b
2 marks

Give two reasons why tropical storms form in the areas shown in Figure 3.

10a
1 mark

Study Figure 3, a diagram showing the global pattern of air pressure and surface winds.

q1-8-fig3-nov-2021-paper-1-qp

Using Figure 3, which one of the following statements is true?

Shade one circle only.

  • Air sinks at the Equator.

  • The southeast trade winds blow from the Equator to 30° N and S.

  • High pressure occurs where the air is sinking.

  • Polar easterlies blow from 60 °N and S towards the poles.

10b
2 marks

Using Figure 3, describe the link between air pressure and surface winds.

10c
2 marks

Suggest why areas close to the Equator usually have high rainfall.

Use Figure 3 and your own understanding.

11
2 marks

Study Figure 4 , a table listing some of the most severe tropical storms over the past 50 years .

Figure 4

Tropical storm

Number of
deaths

Max wind speed
(km per hour)

1970 Bhola cyclone, Bangladesh

350 000

205

1975 Typhoon Nina, China

230 000

250

2008 Cyclone Nargis, Myanmar

138 000

215

1998 Hurricane Mitch, Caribbean

19 300

295

2013 Typhoon Haiyan, Philippines

7 300

310

1980 Hurricane Allen, Caribbean, Mexico and USA

260

305

2017 Hurricane Irma, Caribbean and USA

134

298

‘As maximum wind speeds increase, so does the number of deaths linked to tropical storms.’
Do you agree?
Use evidence from Figure 4 to support your answer.

12
1 mark

Study Figure 7, a typical climate graph for one global ecosystem.

fig-7-june-2018-paper1-qp-gcse-aqa-geo

Which global ecosystem is most likely to have the temperature and precipitation pattern shown in Figure 7?
Shade one circle only.

  • Temperate deciduous forest.

  • Tundra.

  • Hot desert.

  • Savanna.

13
2 marks

Study Figure 1, a table showing the population of selected megacities in 2000 and 2020.

Megacity

Population in 2000 (millions)

Population in 2020 (millions)

Lagos

7.3

14.9

Mumbai

16.1

20.7

London

7.6

9.3

Rio de Janeiro

10.8

13.5

Tokyo

34.5

37.4

Calculate the percentage increase in population for Lagos between 2000 and 2020.

14
1 mark

Using Figure 1, a table showing the population of selected megacities in 2000 and 2020.

Megacity

Population in 2000 (millions)

Population in 2020 (millions)

Lagos

7.3

14.9

Mumbai

16.1

20.7

London

7.6

9.3

Rio de Janeiro

10.8

13.5

Tokyo

34.5

37.4

Which one of the following statements is true?

  • Tokyo had the smallest population increase between 2000 and 2020

  • Mumbai had a greater population increase than Rio de Janeiro

  • London had the largest percentage increase of all the cities shown

  • Lagos had a smaller population than London in both years

15
1 mark

Using the Ordnance Survey map in Figure 2, in which direction is Tonbridge from the proposed Tudeley Village development site?

Map showing the proposed Tudeley Village development near Tonbridge, featuring a highlighted area for a new railway station and key local roads.
  • North east

  • North west

  • South east

  • South west

16
1 mark

Using the OS map in Figure 2, which of the following best describes the land use immediately to the south of the Tudeley Village development boundary?

Map showing the proposed Tudeley Village development near Tonbridge, featuring a highlighted area for a new railway station and key local roads.
  • Urban residential area

  • Industrial and commercial land

  • Predominantly rural farmland and woodland

  • River floodplain with no land use

17
1 mark

A student investigated footfall patterns in their local town center by testing the following hypothesis:

'Pedestrian footfall is highest closest to the main shopping street.'

The student counted the number of pedestrians passing a fixed point over a five-minute period at six different sites, each 100 metres apart along a transect from the main shopping street to the edge of the town centre.

Figure 4 shows the results collected at each site.

Pedestrian footfall survey — number of pedestrians counted in five minutes

Site

Distance (m)

Count 1

Count 2

Count 3

Mean

A

0

68

72

70

70

B

100

54

58

56

56

C

200

41

37

42

40

D

300

29

31

30

30

E

400

18

22

F

500

12

14

11

12

Calculate the mean pedestrian count for Site E.

Show your working.

18
1 mark

Study Figure 7, a 1:50 000 Ordnance Survey map of the Woolacombe area in North Devon.

Topographic map showing Woolacombe and Croyde Bay in North Devon, featuring coastal paths, roads, landmarks, and grid references. Scale 1:50000.
Figure 7

Give the four-figure grid reference for a headland with cliffs

  • 4445

  • 4544

  • 4242

  • 4644

19
1 mark

Study Figure 7, a 1:50 000 Ordnance Survey map of the Woolacombe area in North Devon.

Topographic map showing Woolacombe and Croyde Bay in North Devon, featuring coastal paths, roads, landmarks, and grid references. Scale 1:50000.
Figure 7

Give the four-figure grid reference for a headland with cliffs

  • 4445

  • 4544

  • 4242

  • 4644

20
1 mark

Which of the following would be an appropriate way to present the 'mean pedestrian footfall' shown in Figure 4?

  • Compound chart

  • Bar graph

  • Line graph

  • Histogram

21
1 mark

Using Figure 7, which of the following coastal features is not shown in grid square 4445?

Topographic map showing Woolacombe and Croyde Bay in North Devon, featuring coastal paths, roads, landmarks, and grid references. Scale 1:50000.
Figure 7
  • A rocky wave-cut platform

  • A sandy beach

  • Steep cliffs

  • Headland

22
1 mark

Using Figure 7, which of the following coastal features is not shown in grid square 4445?

Topographic map showing Woolacombe and Croyde Bay in North Devon, featuring coastal paths, roads, landmarks, and grid references. Scale 1:50000.
Figure 7
  • A rocky wave-cut platform

  • A sandy beach

  • Steep cliffs

  • Headland

23
1 mark

A group of students carried out a physical geography investigation to test the hypothesis:

'Pebble size decreases with distance downstream along a beach.'

The students measured the intermediate (middle) axis of ten pebbles at five sites along a beach, each 50 metres apart. The sites were numbered 1 to 5, with Site 1 nearest to the river mouth where sediment entered the beach and Site 5 furthest away.

Figure 6 shows the results of the investigation.

Pebble intermediate axis measurements (mm) at each site

Pebble

Site 1

Site 2

Site 3

Site 4

Site 5

1

62

54

45

38

24

2

58

49

41

32

21

3

71

57

48

35

27

4

65

52

44

40

22

5

60

61

39

33

19

6

68

55

50

37

25

7

55

47

43

29

20

8

72

58

46

36

28

9

63

53

42

31

23

10

66

54

47

39

21

Mean (mm)

64

54

44.5

35

Calculate the mean pebble size for Site 6.

Show your working.