Critical Analysis (A Level Only) (AQA A Level Biology): Exam Questions

Exam code: 7402

2 hours9 questions
1a5 marks

A group of scientists studied a nitrate-rich fertiliser to determine its effect on the rate of photosynthesis in tomato plants. They measured the mean oxygen production rate in two groups of 20 plants after 10 days. Plants were grown in a greenhouse where light intensity, water and CO2 levels were controlled. Their results are shown in Table 1 below.

Table 1

Group

Mean O₂ production rate (cm³ / hour)

Standard deviation

Plants with standard fertiliser

4.3

±0.8

Plants with nitrate-rich fertiliser

5.6

±1.5

A scientist concluded that the new fertiliser increased the rate of photosynthesis and should be used to improve crop yield in farming.

Evaluate the scientist's conclusion.

1b4 marks

One scientist suggested that nitrate-rich fertiliser increases photosynthesis by increasing the production of rubisco.

(i) Explain how nitrate could increase photosynthesis by increasing the production of Rubisco.

[3]

(ii) Suggest one way that the scientists could determine levels of Rubisco production.

[1]

1c2 marks

A second group of researchers investigated the effect of a pesticide (Spinosad) on tomato plant growth and tomato pest populations. Tomato plants were grown in identical greenhouse conditions and split into two groups:

  • Group A: plants treated weekly with Spinosad

  • Group B: control group — no pesticide applied

Both groups were exposed to the same number of whiteflies, a common tomato pest.

Table 2 shows the measured outcomes after 30 days.

Table 2

Variable

Group A

Group B

Mean whitefly count per plant

25 ± 5

78 ± 12

Mean number of leaves per plant

24 ± 3

19 ± 4

Mean fresh mass of fruit per plant (g)

360 ± 20

310 ± 25

Mean chlorophyll concentration (mg / cm3)

1.95 ± 0.10

1.65 ± 0.12

Calculate the percentage increase in fruit mass in plants treated with Spinosad compared to untreated plants.

Give your answer to two significant figures.

1d4 marks

Use the data in Table 1 to explain how Spinosad may have affected the photosynthesis and fruit production of the tomato plants.

2a3 marks

A group of scientists developed a monoclonal antibody treatment for cancer. The monoclonal antibodies were designed to bind to a protein found only on the surface of cancer cells. The scientists hypothesised that once bound, these antibodies would trigger the destruction of the cancer cells by the immune system.

To test the effectiveness of the treatment, they injected cancer cells into two groups of mice to induce tumour growth. After 10 days, all mice had developed tumours of similar size. Each group consisted of 20 mice.

  • Group A received monoclonal antibodies

  • Group B received a placebo (injection containing no active ingredients)

The scientists measured the average tumour size in each group every 5 days over 40 days.

(i) State the role of the placebo in this experiment.

[2]

(ii) Name one variable, other than treatment type, that should be controlled in this experiment.

[1]

2b3 marks

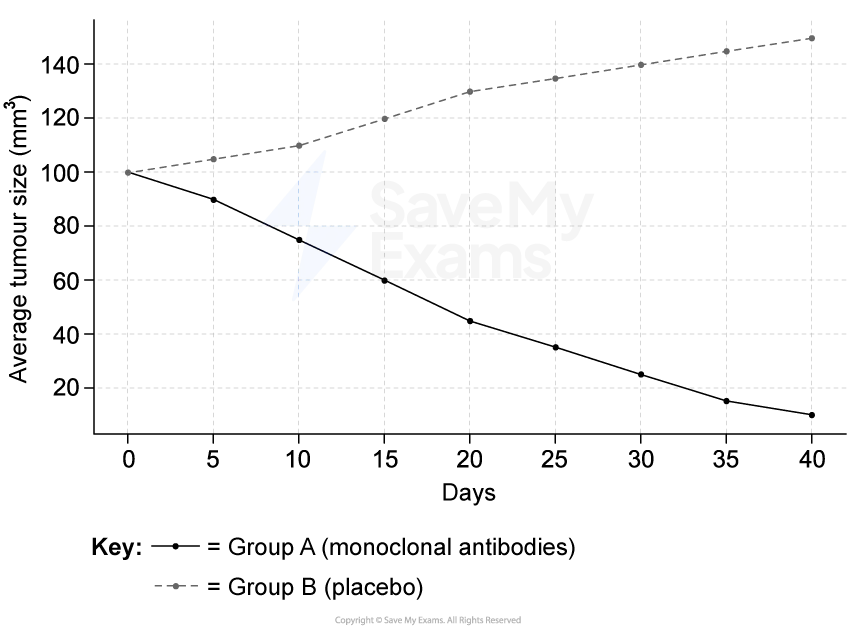
Figure 1 below shows the average tumour size in two groups of mice over 40 days.

Figure 1

Line graph showing tumour size in mice over 40 days; Group A (yellow) decreases, Group B (orange, dashed) increases. Title: Monoclonal Antibody Treatment.

(i) Describe the effect of the monoclonal antibody treatment on tumour growth.

[2]

(ii) At diagnosis, a mouse was found to have a tumour of 130 mm³.

Use the data in Figure 1 to estimate the age of the tumour at diagnosis.

[1]

2c3 marks

Assess the extent to which the data support the conclusion that:

“monoclonal antibodies inhibit tumour growth by preventing cell division.”

In your answer, use the data provided and relevant biological knowledge.

2d3 marks

Explain why further research is needed before these monoclonal antibodies can be used as a cancer treatment in humans.

2e2 marks

The researchers measured tumour volume again after 40 days.

Group

Starting tumour volume (mm³)

Final tumour volume (mm³)

A

100

10

B

100

160

Calculate the average daily percentage increase in tumour size for group B over the 40 days.

Give your answer to two significant figures.

2f1 mark

Identify one ethical issues that could arise from the use of monoclonal antibodies to treat human diseases.

3a
Sme Calculator
4 marks

Myoglobin is a protein found in muscle tissue that binds and stores oxygen. Researchers investigated the oxygen-binding capacity of myoglobin in three mammals: the bottlenose dolphin, the elephant seal and the domestic dog.

The scientists hypothesised that the dolphin and elephant seal would have adaptations allowing them to store more oxygen in their muscles, helping them remain underwater for extended periods.

They extracted and analysed muscle tissue samples from 20 dolphins, 20 elephant seals and 20 dogs. Table 1 shows their results.

Table 1

Species

Mean myoglobin concentration (mg/g) ± SD

% of body mass that is muscle

Mean dive time (min)

Mean muscle fibre diameter (μm)

Dog

4.0 ± 0.6

40%

0.5

32

Dolphin

35.0 ± 2.8

55%

8.5

40

Elephant seal

55.0 ± 3.2

60%

25.0

65

(i) Calculate the mean total mass of myoglobin in a 150 kg dolphin.

Give your answer in grams.

[2]

(ii) Comment on the variability in myoglobin concentrations within each species.

[2]

3b3 marks

Describe and explain how myoglobin concentration might contribute to the dolphin’s ability to stay underwater for extended periods.

3c3 marks

The elephant seal has both the largest muscle fibre diameter and the highest percentage of body mass made up of muscle of the three species.

(i) Suggest why these two features could make it more difficult for oxygen to reach mitochondria during a dive.

[2]

(ii) Suggest one adaptation of the muscle cells that could help overcome this difficulty.

[1]

3d2 marks

Suggest two limitations of the evidence presented in this study in demonstrating the oxygen-binding capacity of myoglobin.

3e3 marks

The amino acid sequence of the dolphin myoglobin was also compared to that of the dog. It showed multiple substitutions, particularly at surface-exposed regions which increased the capacity of cells to store the protein due to increased solubility which prevents aggregation of myoglobin within the cytoplasm.

Explain how these substitutions resulted in increased solubility of myoglobin in muscle cells of dolphins.

4a3 marks

Mitochondrial uncoupling occurs when protons move across the inner mitochondrial membrane without producing ATP.

Scientists investigated whether activating a protein called UCP1 (Uncoupling Protein 1) in skeletal muscle could protect against obesity and type 2 diabetes. They genetically modified mice to express UCP1 in their muscles (F1-tg) and compared them to control mice (F1-wt). All mice were fed a high-fat diet.

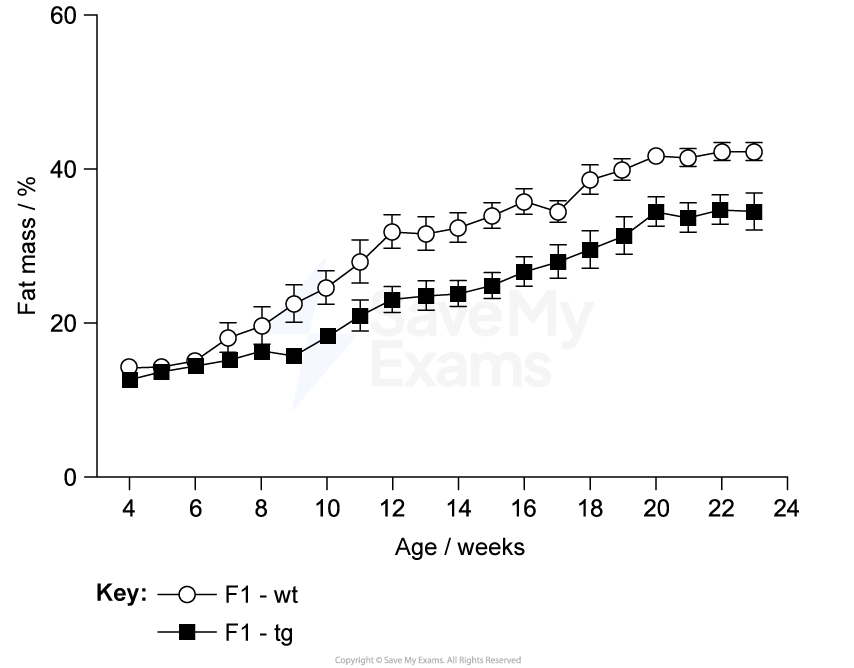
Figure 1 shows how the fat mass of the two groups of mice changed over time.

Figure 1

Line graph showing fat mass percentage by age in weeks for F1-wt and F1-tg groups. F1-wt increases steadily, peaking higher than F1-tg.

Compare the changes in fat mass of F1-wt and F1-tg mice between weeks 4 and 24.

4b3 marks

UCP1 protein acts as a proton channel in the inner mitochondrial membrane.

Suggest how activation of UCP1 in F1-tg mice could lead to the results shown in Figure 1.

4c3 marks

The scientists performed a glucose tolerance test on the two groups of mice. The test measures how quickly blood glucose levels return to normal after a known dose of glucose is given. The results are shown in Table 1 below.

Table 1

Time after glucose consumed / mins

F1-wt

Blood glucose level/ mg dl-1

F1-tg

Blood glucose level/ mg dl-1

0

120

110

15

220

180

30

260

170

60

190

130

120

140

100

240

110

90

Explain the changes in blood glucose levels taking place in F1-wt mice over the testing period.

4d
Sme Calculator
2 marks

Use Table 1 to calculate the difference in average rate of blood glucose change from 30 minutes onwards between F1-wt mice and F1-tg mice.

4e4 marks

A student read the results of the study on UCP1 activation and concluded that uncoupling in muscles could reduce obesity and diabetes.

Evaluate this conclusion using all of the data provided.

5a2 marks

Changes in land use can affect the extent to which ecosystems store carbon in organic matter. Scientists investigated whether plant species richness in restored North American grasslands affects the rate of soil carbon accumulation.

They set up an experiment on former farmland that had been cleared, exposed to herbicides, and then abandoned. Across 168 plots, they sowed 1, 2, 4, 8 or 16 species of native perennial grassland plants. The same total number of seeds was sown in each plot, and all plots were weeded annually throughout the study to remove additional species.

Soil carbon storage in the top 20 cm of soil was measured at regular intervals for 22 years; the results are shown in Table 1 below.

Table 1

Number of species originally planted on the plot

Carbon storage rate during years 1-13 / Mg ha-1 yr-1

Carbon storage rate during years 14-22 / Mg ha-1 yr-1

1

0.09 (± 0.06)

0.28 (± 0.08)

2

0.14 (± 0.06)

0.31 (± 0.08)

4

0.15 (± 0.07)

0.36 (± 0.07)

8

0.11 (± 0.07)

0.45 (± 0.07)

16

0.19 (± 0.06)

0.51 (± 0.06)

Calculate the ratio of carbon storage rate during the first 13 years to the storage rate during years 14-22 for plots that had the highest species richness.

5b4 marks

Describe the results shown in Table 1.

5c3 marks

The scientists found that the rate of carbon storage at sites undergoing natural succession was 0.17 (±0.05) Mg ha−1 y−1 .

Compare and contrast the naturally occurring process of succession with the process taking place on the experimental plots described in part (a).

5d4 marks

The scientists concluded that, when compared with natural succession, high-diversity planting of late-successional plants may increase the ability of abandoned agricultural land to store carbon.

Evaluate this conclusion.

5e2 marks

Explain how carbon can be stored in plant biomass.

6a2 marks

The whitefly Bemisia tabaci is an invasive agricultural pest that has spread successfully into many different regions of the world. One factor in its success appears to be its ability to tolerate heat. This tolerance is thought to involve the activity of heat shock proteins (HSPs). These proteins help protect other cellular proteins from heat stress.

Suggest how HSPs might aid heat tolerance in whiteflies.

6b2 marks

Scientists investigated how the expression of a series of genes that code for heat shock proteins (Hsp70, Hsp40 and Hsp90), changed in response to temperature stress.

Groups of 50 adult whiteflies were placed in gauze-sealed tubes and exposed to one of four temperatures (12 °C, 18 °C, 26 °C or 44 °C) for 3 hours in controlled temperature incubators. The 26 °C group was used as a control. After treatment, total RNA was extracted from each group before being converted to cDNA and amplified for analysis.

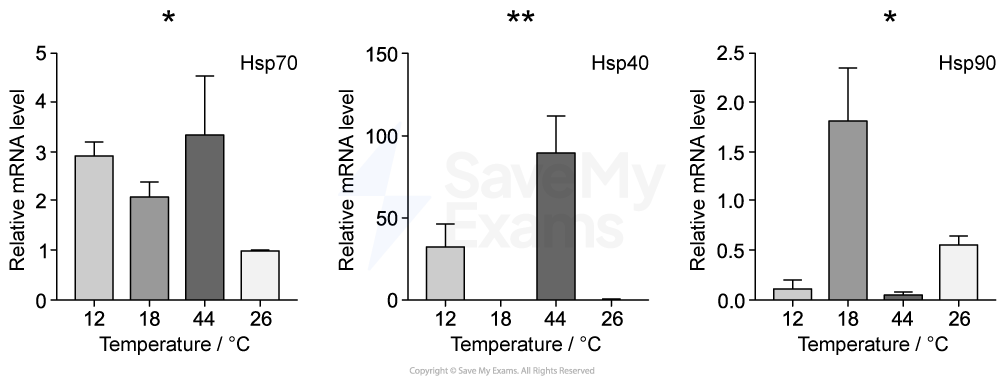
The results are shown in Figure 1 below.

Note that:

  • * = differs from control at a probability level of 0.05

  • ** differs from control at a probability level of 0.01

Figure 1

Bar charts showing relative mRNA levels of Hsp70, Hsp40, and Hsp90 at temperatures 12°C, 18°C, 44°C, and 26°C, with significant differences marked.

(i) State how the total RNA could have been converted to cDNA

[1]

(ii) Name the technique that would have been used to amplify the cDNA

[1]

6c3 marks

The scientists concluded from Figure 1 that Hsp70 and Hsp 40 were likely to be involved in heat regulation, while Hsp90 might have a different role.

Use information from Figure 1 to justify this conclusion.

6d2 marks

With reference to Figure 1, determine the probability that the difference in gene expression between control and experimental temperatures is due to chance alone.

6e
Sme Calculator
4 marks

In a related study, scientists used RNA interference (RNAi) to reduce, or knock out, expression of Hsp70. Groups of approximately 150 adult whiteflies were assigned to either the control or knockout group. After 10 days, mortality was measured and the number of eggs laid per female (fecundity) was recorded. The experiment was repeated in three independent replicates. Results are shown in Table 1 below.

Table 1

Mortality / %

Fecundity / eggs per female

Control

16.0

157

Hsp70 knockout

85.6

109

(i) Calculate the percentage reduction in fecundity when Hsp70 function is removed

[1]

(ii) A student concluded that the protein coded for by Hsp70 plays an important role in white fly reproduction.

Evaluate this conclusion.

[3]

6f2 marks

Describe how RNA interference could knock out the function of the Hsp70 gene.

7a3 marks

An action potential can be generated when a neurone is stimulated.

Describe how an action potential is generated after stimulation of a neurone.

7b
Sme Calculator
6 marks

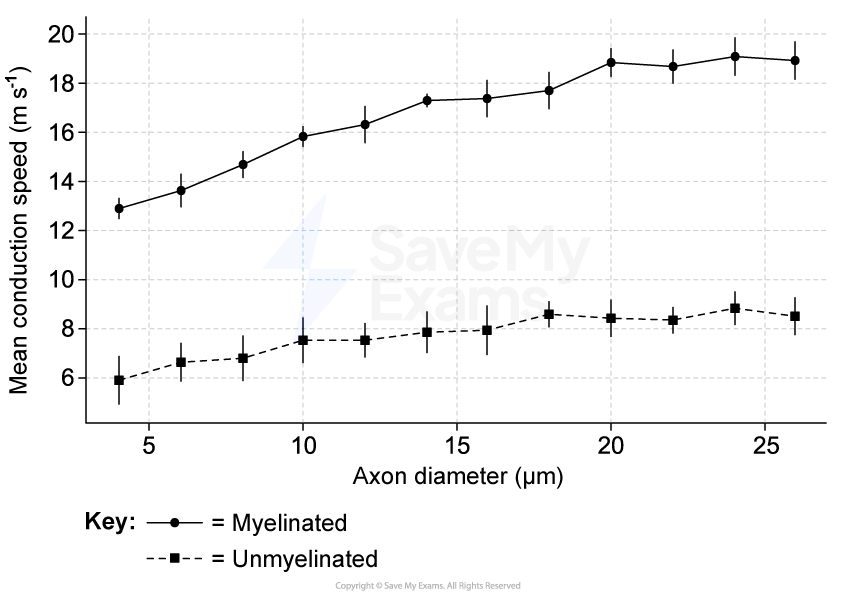
Scientists investigated the effect of axon diameter and myelination on conduction speed in neurones. They measured the mean conduction speed of action potentials in axons of different diameters, with and without myelin sheaths. The results are shown in Figure 1 below.

Figure 1

Line graph showing the effect of axon diameter on conduction speed. Myelinated axons (solid line) increase speed more than unmyelinated (dashed line).

(i) Describe and explain the effect of myelination on conduction speed as axon diameter increases.

[4]

(ii) Calculate the percentage increase in the speed of conduction in the myelinated axon compared to the unmyelinated axon at 20 μm.

[2]

7c2 marks

Identify one variable that should be kept constant when comparing conduction speed between myelinated and unmyelinated axons in this investigation.

Explain why controlling this variable is important.

7d2 marks

Explain why it is good practice to carry out several repeat measurements for each axon diameter.

7e3 marks

Multiple sclerosis (MS) is a condition in which the immune system damages the myelin sheaths surrounding neurones. A symptom of multiple sclerosis (MS) is slowed or uncoordinated muscle movement.

Use information given and the data in Figure 1 to suggest an explanation for this symptom.

8a
Sme Calculator
2 marks

In 2022 country X recorded 712 000 deaths. Heart disease accounted for 27.5% of these deaths. Of those dying due to heart disease, coronary artery disease was responsible for 40%.

Calculate the mean number of people who died from coronary artery disease per month in 2022.

8b2 marks

A high level of saturated fat in the diet is a risk factor associated with coronary artery disease. One type of saturated fat, palmitic acid, can lead to increased expression of a gene called NF-κB. This gene codes for a transcription factor that promotes inflammation in blood vessels.

A compound found in oats, called avenanthramide, reduces the activity of NF-κB by preventing its transcription.

Suggest how avenanthramide reduces the activity of NF-κB.

8c4 marks

Scientists investigated the effects of avenanthramide on inflammation using cultured human blood vessel cells grown in vitro. They applied different concentrations of avenanthramide and measured the production of an inflammatory marker. Their results are shown in Table 1 below.

Table 1

Avenanthramide concentration / μmol dm⁻³

Mean inflammatory marker level / arbitrary units

Standard deviation

0 (control)

112

± 4.2

5

98

± 5.0

10

79

± 3.8

20

64

± 4.1

40

47

± 4.5

80

48

± 4.0

Use the data to evaluate the effectiveness of avenanthramide as a treatment to reduce inflammation.

8d3 marks

A journalist reviewed the study and concluded that:

"eating oats every day will prevent coronary artery disease."

Suggest three reasons, other than any that are related to the data itself, why this conclusion might not be valid.

8e
Sme Calculator
3 marks

Oats contain 0.875 mg of avenanthramide per gram. A person needs 20 mg of avenanthramide in their bloodstream to have a measurable anti-inflammatory effect. Previous studies show that 57.1% of consumed avenanthramide is absorbed into the blood.

Calculate how many grams of oats a person would need to consume to deliver 20 mg of avenanthramide to the bloodstream.

Give your final answer to 1 decimal place.

9a2 marks

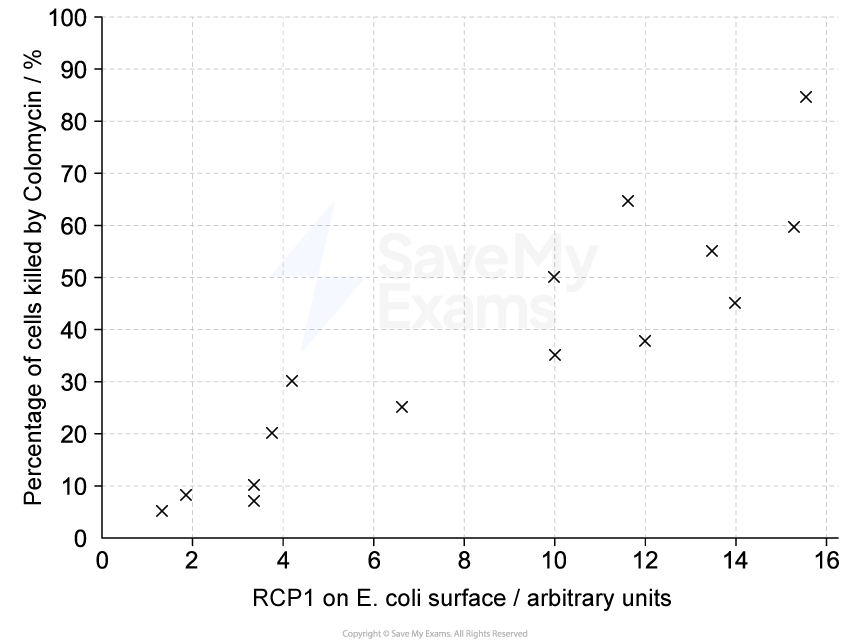
Some strains of E. coli bacteria have developed resistance to the antibiotic Colomycin. This antibiotic binds to a surface protein called RCP1. If enough Colomycin binds to RCP1 on a bacterial cell, the cell is killed.

A team of researchers studied the relationship between the amount of RCP1 on the surface of E. coli and the percentage of cells killed by Colomycin. Their results are shown in Figure 1.

Figure 1

Scatter plot showing the positive correlation between RCP1 levels on E. coli and percentage of cells killed by Colimycin, with data points increasing.

(i) Identify an appropriate statistical test that the researchers could use to determine whether there is a significant correlation between the amount of RCP1 on the surface of E. coli cells and the percentage of cells killed by Colomycin.

Explain your answer.

[1]

(ii) State a suitable null hypothesis for this investigation.

[1]

9b3 marks

Describe the results shown in Figure 1.

9c
Sme Calculator
3 marks

Some E. coli strains carry a mutation in the rcmR gene which affects the production of RCP1. The researchers compared the effect of Colomycin in strains with and without the rcmR mutation.

The researchers found that:

  • the median percentage of E. coli cells killed in a strain with the rcmR mutation (strain A) was 5%

  • the median percentage of E. coli cells killed in a strain without the rcmR mutation (strain B) was 46%

Sample blood was inoculated with either strain A or strain B until each sample contained 2.0 × 10⁶ E.coli cells per cm³. Each blood sample was then treated with a dose of Colomycin.

Use the median values above to calculate the difference in the number of bacterial cells likely to be destroyed per cm³ of blood between the two strains.

Express your answer in standard form.

9d2 marks

Use all of the information provided to suggest how the rcmR mutation leads to the difference in the percentage of E. coli cells killed by Colomycin.

9e4 marks

Describe how gene probes could be used to determine whether the rcmR mutation is present in a bacterial population.