Break-Even Analysis (AQA A Level Business): Revision Note
Exam code: 7132

The value of break-even analysis
Break-even analysis is a financial tool used to determine the point at which the business revenue equals its expenses, resulting in neither profit nor loss
It helps businesses understand the minimum level of sales or output they need to achieve to cover all costs
This helps managers make informed decisions about pricing and production volumes
It is particularly useful for communicating with stakeholders, including investors or lenders
It demonstrates the financial viability of the business and gives an insight into potential return on investment
Revenue and costs
Break-even analysis takes into account three main components
The components of break-even analysis
Sales revenue
Sales revenue is the value of the units sold by a business over a period of time
E.g. the revenue earned by Apple Music from sales of music downloads
Sales revenue is a key business performance measure and must be calculated to identify profit
Sales revenue is calculated using the formula
format('truetype')%3Bfont-weight%3Anormal%3Bfont-style%3Anormal%3B%7D%3C%2Fstyle%3E%3C%2Fdefs%3E%3Ctext%20font-family%3D%22Arial%22%20font-size%3D%2214%22%20text-anchor%3D%22middle%22%20x%3D%2217.5%22%20y%3D%2214%22%3ESales%3C%2Ftext%3E%3Ctext%20font-family%3D%22Arial%22%20font-size%3D%2214%22%20text-anchor%3D%22middle%22%20x%3D%2264.5%22%20y%3D%2214%22%3Erevenue%3C%2Ftext%3E%3Ctext%20font-family%3D%22math17f39f8317fbdb1988ef4c628eb%22%20font-size%3D%2214%22%20text-anchor%3D%22middle%22%20x%3D%22102.5%22%20y%3D%2214%22%3E%3D%3C%2Ftext%3E%3Ctext%20font-family%3D%22Arial%22%20font-size%3D%2214%22%20text-anchor%3D%22middle%22%20x%3D%22140.5%22%20y%3D%2214%22%3EQuantity%3C%2Ftext%3E%3Ctext%20font-family%3D%22Arial%22%20font-size%3D%2214%22%20text-anchor%3D%22middle%22%20x%3D%22183.5%22%20y%3D%2214%22%3Esold%3C%2Ftext%3E%3Ctext%20font-family%3D%22Arial%22%20font-size%3D%2214%22%20text-anchor%3D%22middle%22%20x%3D%22203.5%22%20y%3D%2214%22%3Ex%3C%2Ftext%3E%3Ctext%20font-family%3D%22Arial%22%20font-size%3D%2214%22%20font-style%3D%22italic%22%20text-anchor%3D%22middle%22%20x%3D%22215.5%22%20y%3D%2214%22%3ES%3C%2Ftext%3E%3Ctext%20font-family%3D%22Arial%22%20font-size%3D%2214%22%20text-anchor%3D%22middle%22%20x%3D%22237.5%22%20y%3D%2214%22%3Eelling%3C%2Ftext%3E%3Ctext%20font-family%3D%22Arial%22%20font-size%3D%2214%22%20text-anchor%3D%22middle%22%20x%3D%22273.5%22%20y%3D%2214%22%3Eprice%3C%2Ftext%3E%3C%2Fsvg%3E)
Sales revenue increases as the sales volume increases
Costs
In preparing goods and services for sale, businesses incur a range of costs
Some examples of these costs include purchasing raw materials, paying staff salaries and wages and paying utility bills, such as electricity
These costs can be broken into different categories
Fixed costs (FC) are costs that do not change as the level of output changes
These have to be paid whether the output is zero or 5,000
Variable costs (VC) are costs that vary directly with the output
These increase as output increases and vice versa
Total costs (TC) are the sum of the fixed and variable costs
Fixed costs
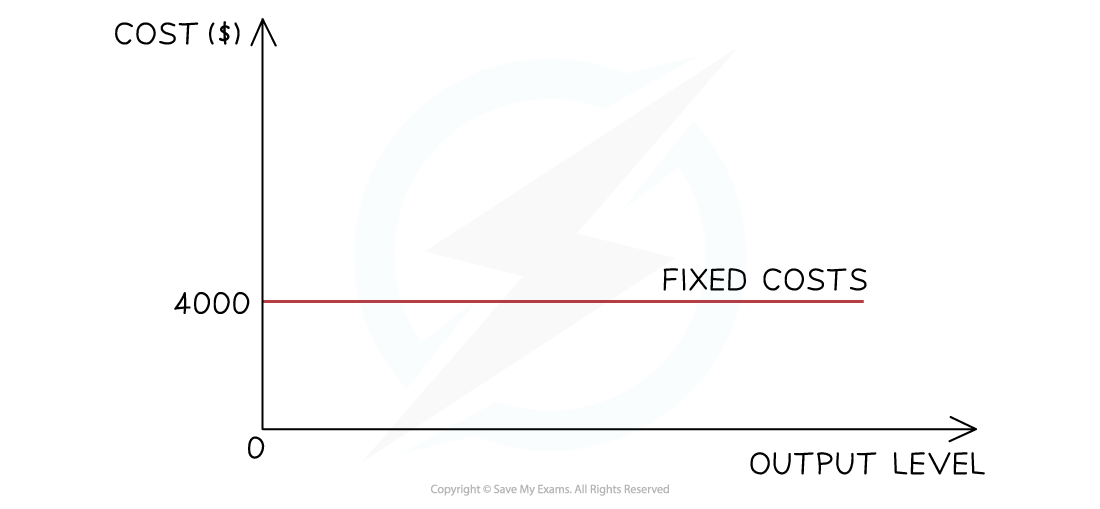
The firm has to pay its fixed costs, which do not change, irrespective of whether the output is zero or 100,000 units
The fixed costs for this firm are $4,000
Variable costs
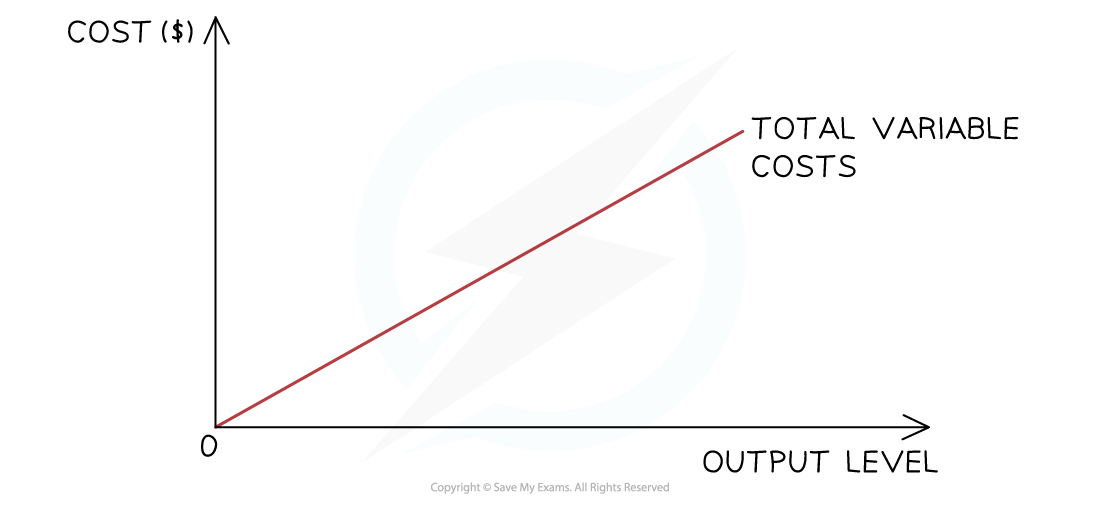
The variable costs initially rise proportionally with output, as shown in the diagram
At some point, the firm will benefit from a purchasing economy of scale, and the rise will no longer be proportional
Total costs
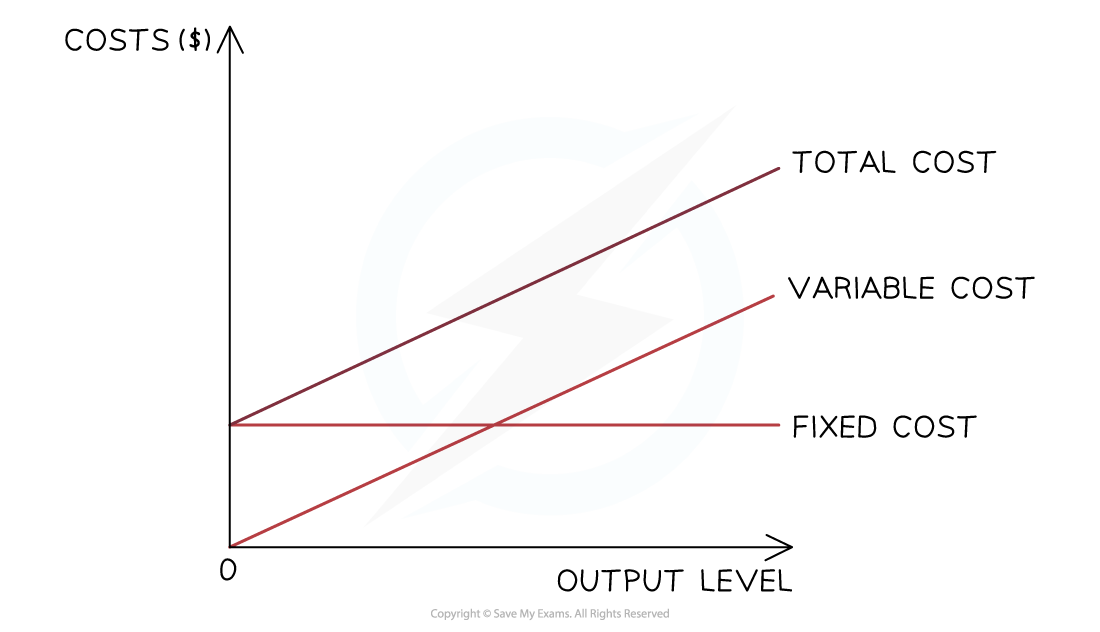
The total costs are the sum of the variable and fixed costs at each level of output
Total costs cannot be zero, as all firms have some level of fixed costs
Constructing and interpreting breakeven charts
A breakeven chart is a visual representation of the breakeven point and is used to identify the following:
Fixed costs, total costs and revenue over a range of output
The breakeven point — where total costs are equal to revenue
Profit or loss made at each level of output
The margin of safety
Diagram: Breakeven chart
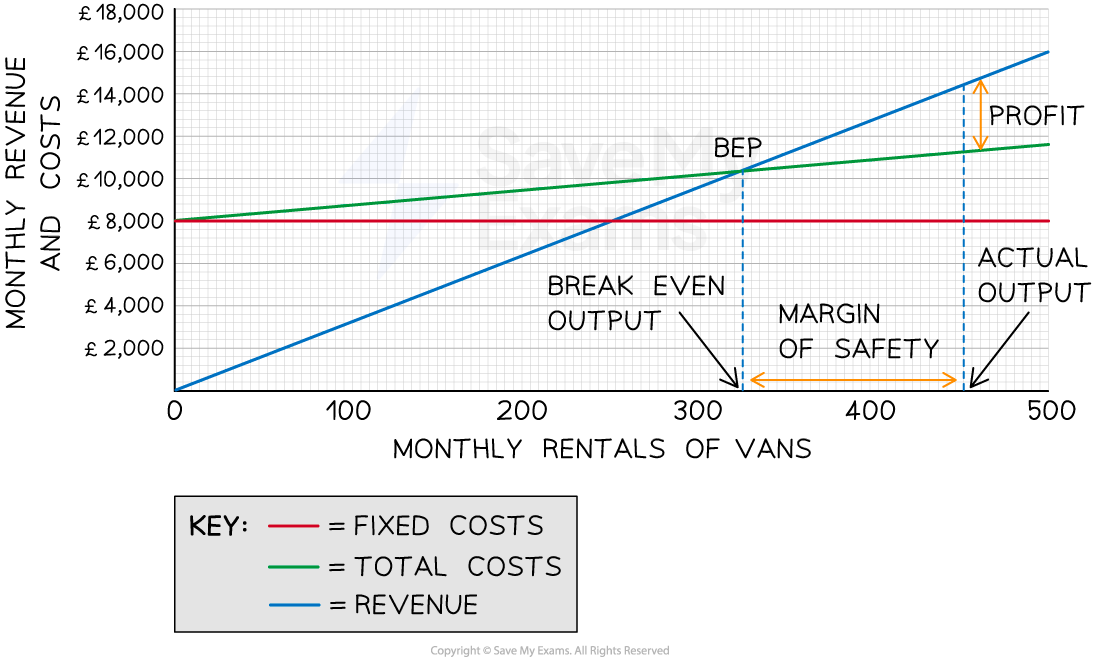
Diagram analysis
Fixed costs do not change as output increases
A2B Limited's fixed costs are £8,000, and these do not change, whether the business produces zero units or 500 units
Total costs are made up of fixed and variable costs
At zero units of output, they are made up exclusively of fixed costs
At 500 units, the total variable costs equate to £11,800
This line slopes upwards because total variable costs increase as output increases
The revenue line also slopes upwards
At zero units of output, the revenue is £0
At 500 units, the total revenue equates to £11,800
Revenue will increase with the output
The line will slope more steeply than the total costs and will cross the total costs line at some point
The breakeven point is the point at which the total costs and the revenue lines cross each other
The breakeven level of output for A2B Limited is 324 units
The margin of safety can be identified as the difference on the x-axis between the actual level of output (in this case, 450 units) and the breakeven point (324 units)
The profit made at a specific level of output can be identified as the space between the revenue and total costs lines
In this instance, the profit made at 450 units of output is £14,400 - £11,250 = £3,150
Illustrating changes to price, output and costs on the breakeven chart
Changing any of the variables of breakeven (selling price, variable cost per unit or total fixed costs) changes the breakeven point and level of profit the business can expect to achieve
Changes in variables and the breakeven point
Increased selling price

An increase in the selling price increases revenue at each level of output from R1 to R2
The breakeven point falls from BEP1 to BEP2
The profit on each unit of output is greater than the amount the breakeven point increases by
Increased variable costs

An increase in variable costs increases total costs at each level of output from TC1 to TC2
The breakeven point rises from BEP1 to BEP2
The profit on each unit of output is greater than the amount the breakeven point reduces by
Decreased variable costs

A decrease in variable costs reduces total costs at each level of output from TC1 to TC2
The breakeven point falls from BEP1 to BEP2
The profit on each unit of output is greater than the amount the breakeven point increases by
Increased fixed costs

An increase in fixed costs increases total costs at each level of output from TC1 to TC2
The breakeven point increases from BEP1 to BEP2
The profit on each unit of output is greater than the amount the breakeven point decreases by
Decreased fixed costs

A decrease in fixed costs reduces total costs at each level of output from TC1 to TC2
The breakeven point falls from BEP1 to BEP2
The profit on each unit of output is greater than the amount the breakeven point reduces by
The benefits and limitations of break-even analysis
Benefits of break-even analysis
Use | Explanation |
|---|---|
Profitability assessment |
|
Cost control |
|
Pricing decisions |
|
Financial planning |
|
Sensitivity analysis |
|
Decision-making |
|
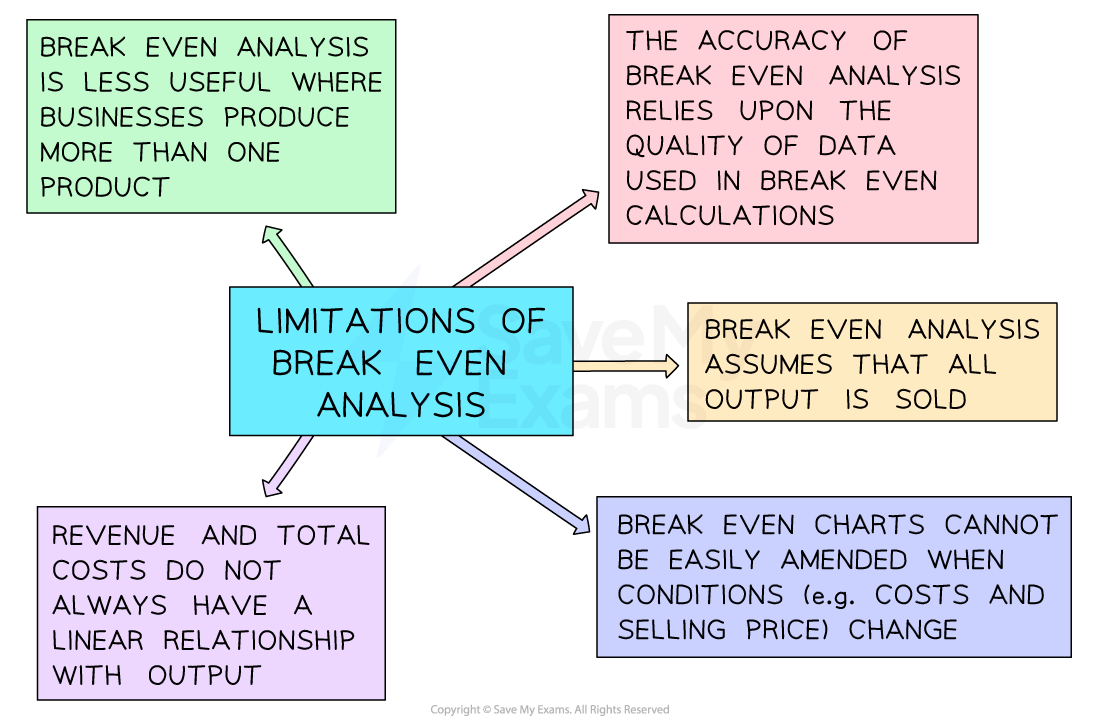
Limitations of break-even analysis
Using break-even analysis to inform decisions
Use in decision-making | Why breakeven helps | Example |
|---|---|---|
Pricing |
|
|
Product launch or withdrawal |
|
|
Cost-saving decisions |
|
|

Unlock more, it's free!
Join the 100,000+ Students that ❤️ Save My Exams
the (exam) results speak for themselves:

Was this revision note helpful?
