Velocity & Acceleration (AQA Level 3 Mathematical Studies (Core Maths)): Revision Note
Exam code: 1350

Distance-time Graphs
How do I use a distance-time graph?
Distance-time graphs show the distance travelled at different times
Distance is on the vertical axis
Time is on the horizontal axis
The gradient of the graph is the speed
format('truetype')%3Bfont-weight%3Anormal%3Bfont-style%3Anormal%3B%7D%3C%2Fstyle%3E%3C%2Fdefs%3E%3Ctext%20font-family%3D%22Times%20New%20Roman%22%20font-size%3D%2218%22%20text-anchor%3D%22middle%22%20x%3D%2220.5%22%20y%3D%2230%22%3Espeed%3C%2Ftext%3E%3Ctext%20font-family%3D%22math17f39f8317fbdb1988ef4c628eb%22%20font-size%3D%2216%22%20text-anchor%3D%22middle%22%20x%3D%2253.5%22%20y%3D%2230%22%3E%3D%3C%2Ftext%3E%3Cline%20stroke%3D%22%23000000%22%20stroke-linecap%3D%22square%22%20stroke-width%3D%221%22%20x1%3D%2268.5%22%20x2%3D%22197.5%22%20y1%3D%2223.5%22%20y2%3D%2223.5%22%2F%3E%3Ctext%20font-family%3D%22Times%20New%20Roman%22%20font-size%3D%2218%22%20text-anchor%3D%22middle%22%20x%3D%2299.5%22%20y%3D%2216%22%3Edistance%3C%2Ftext%3E%3Ctext%20font-family%3D%22Times%20New%20Roman%22%20font-size%3D%2218%22%20text-anchor%3D%22middle%22%20x%3D%22164.5%22%20y%3D%2216%22%3Etravelled%3C%2Ftext%3E%3Ctext%20font-family%3D%22Times%20New%20Roman%22%20font-size%3D%2218%22%20text-anchor%3D%22middle%22%20x%3D%22133.5%22%20y%3D%2241%22%3Etime%3C%2Ftext%3E%3Ctext%20font-family%3D%22math17f39f8317fbdb1988ef4c628eb%22%20font-size%3D%2216%22%20text-anchor%3D%22middle%22%20x%3D%22212.5%22%20y%3D%2230%22%3E%3D%3C%2Ftext%3E%3Cline%20stroke%3D%22%23000000%22%20stroke-linecap%3D%22square%22%20stroke-width%3D%221%22%20x1%3D%22227.5%22%20x2%3D%22256.5%22%20y1%3D%2223.5%22%20y2%3D%2223.5%22%2F%3E%3Ctext%20font-family%3D%22Times%20New%20Roman%22%20font-size%3D%2218%22%20text-anchor%3D%22middle%22%20x%3D%22242.5%22%20y%3D%2216%22%3Erise%3C%2Ftext%3E%3Ctext%20font-family%3D%22Times%20New%20Roman%22%20font-size%3D%2218%22%20text-anchor%3D%22middle%22%20x%3D%22242.5%22%20y%3D%2241%22%3Erun%3C%2Ftext%3E%3C%2Fsvg%3E)
The units for speed are usually metres per second
Or m/s or ms-1
The steeper the line or curve, the faster the object is moving
Lines or curves with positive gradients represent objects moving away from the start point
Lines or curves with negative gradients represent objects moving towards the start point
Lines that are horizontal represent rest
The object is stationary (not moving)
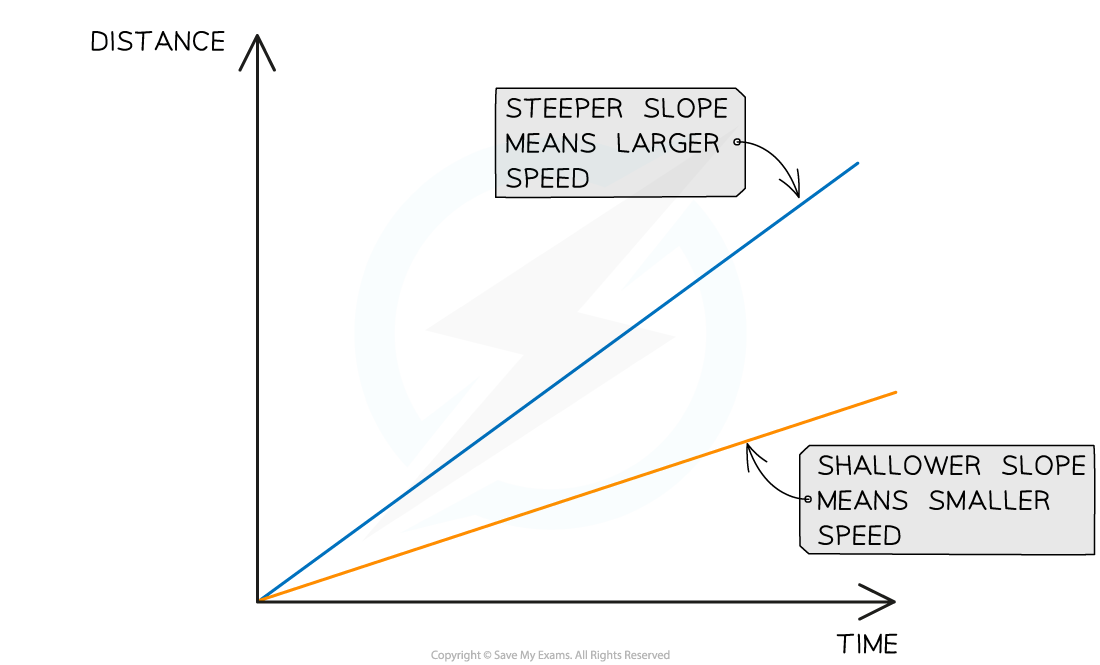
Remember that the gradient of a distance-time graph is equal to the speed
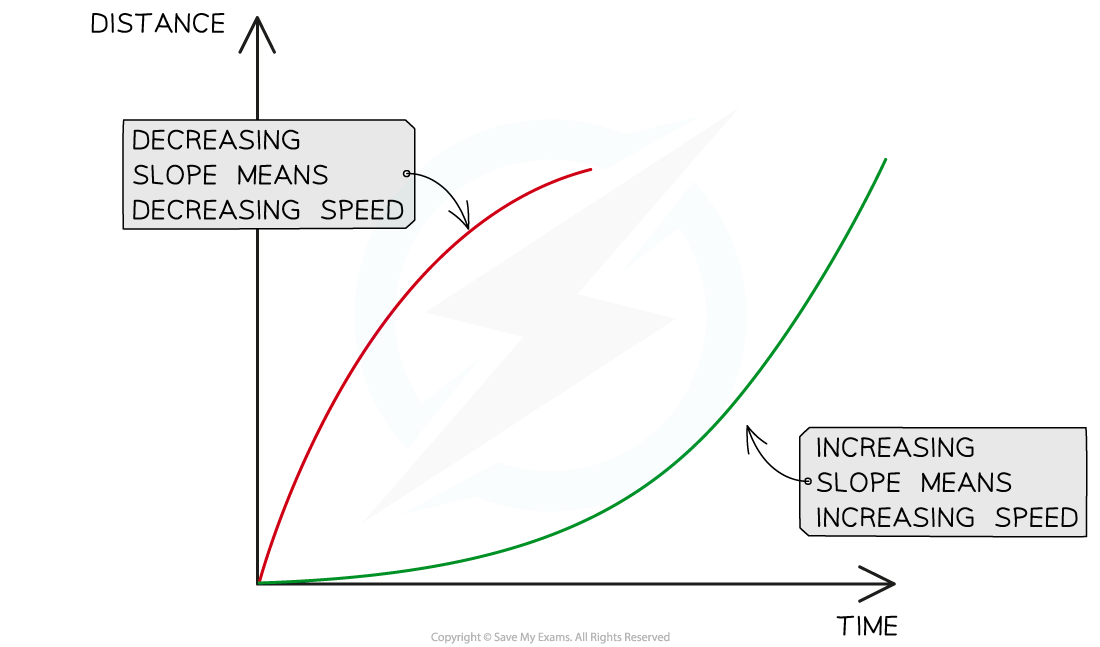
If the gradient decreases (becomes less steep) the speed is decreasing
If the gradient increase (becomes more steep) the speed is increasing
How do I work out the overall average speed?
The overall average speed for the whole journey is

The total time includes any rests
This can be applied to journeys with multiple parts
How do I work with curved distance-time graphs?
The gradient of a linear distance-time graph is constant
This means the speed is constant throughout
It is equal to the average speed for the journey
A curved distance-time graph has a gradient which is constantly changing
This means the speed is constantly changing
The gradient can be estimated at a point to find the speed at that point in time
This is done by drawing a tangent at that point and finding its gradient
The gradient can also be estimated between two points (using a chord) to find the average speed between those two points
See Gradients & Rates of Change for how to do this

If a curve has a point where the tangent is horizontal (a stationary point) it may be referred to as "instantaneously at rest"
At a stationary point, the object will be changing direction
This is because the gradient (speed) will be changing from positive to negative, or vice-versa
Worked Example
The distance-time graph below shows the distance of a particle from its starting point during three different stages of motion.

(a) Describe the motion of the particle for each of the three stages. You do not need to perform any calculations.
Between A and B, the gradient of the graph is decreasing, therefore the speed is decreasing
Between A and B, the particle is moving away from its starting point, and its speed is decreasing
Between B and C the gradient is negative, so it is moving back towards its starting point
The line is linear, so the gradient, and therefore speed, is constant
Between B and C the object is moving back towards its starting point at a constant speed
Between C and D the distance from the starting point does not change
Between C and D the object is at rest
(b) Estimate the speed of the particle at 3 seconds.
Draw a tangent to the graph at time 3 seconds
A tangent should touch the curve, not intersect it

Select two points on the tangent line and find the gradient of the tangent

![]()
The gradient of the tangent is equal to the speed at that point in time
Round the answer to 3 significant figures, and add the units
At 3 seconds, the speed is 1.93 ms-1 (to 3.s.f)
(c) Find the average speed between point B and point D.
Average speed is found by: ![]()
Apply this between points B and D
The distance at point B is 12 m from the start, and at point D the distance is 6 m from the start.
The time elapsed between B and D is 7 seconds (14 - 7)
![]()
Round to 3 significant figures and write the units
The average speed between B and D is 0.857 ms-1
Velocity-time Graphs
What is a velocity-time graph?
Velocity describes the speed and direction of an object
E.g. A velocity of -3 ms-1 is equivalent to a speed of 3 ms-1
You may see speed-time graphs or velocity-time graphs
The direction that an object is travelling in does not matter for a speed-time graph
Speed-time graphs and velocity-time graphs follow the same principles
Velocity-time graphs show the velocity of an object at different times
Velocity is on the vertical axis
Time is on the horizontal axis
The gradient of the graph is the acceleration
format('truetype')%3Bfont-weight%3Anormal%3Bfont-style%3Anormal%3B%7D%3C%2Fstyle%3E%3C%2Fdefs%3E%3Ctext%20font-family%3D%22Times%20New%20Roman%22%20font-size%3D%2218%22%20text-anchor%3D%22middle%22%20x%3D%2243.5%22%20y%3D%2230%22%3Eacceleration%3C%2Ftext%3E%3Ctext%20font-family%3D%22math17f39f8317fbdb1988ef4c628eb%22%20font-size%3D%2216%22%20text-anchor%3D%22middle%22%20x%3D%2299.5%22%20y%3D%2230%22%3E%3D%3C%2Ftext%3E%3Cline%20stroke%3D%22%23000000%22%20stroke-linecap%3D%22square%22%20stroke-width%3D%221%22%20x1%3D%22114.5%22%20x2%3D%22248.5%22%20y1%3D%2223.5%22%20y2%3D%2223.5%22%2F%3E%3Ctext%20font-family%3D%22Times%20New%20Roman%22%20font-size%3D%2218%22%20text-anchor%3D%22middle%22%20x%3D%22141.5%22%20y%3D%2216%22%3Echange%3C%2Ftext%3E%3Ctext%20font-family%3D%22Times%20New%20Roman%22%20font-size%3D%2218%22%20text-anchor%3D%22middle%22%20x%3D%22178.5%22%20y%3D%2216%22%3Ein%3C%2Ftext%3E%3Ctext%20font-family%3D%22Times%20New%20Roman%22%20font-size%3D%2218%22%20text-anchor%3D%22middle%22%20x%3D%22218.5%22%20y%3D%2216%22%3Evelocity%3C%2Ftext%3E%3Ctext%20font-family%3D%22Times%20New%20Roman%22%20font-size%3D%2218%22%20text-anchor%3D%22middle%22%20x%3D%22182.5%22%20y%3D%2241%22%3Etime%3C%2Ftext%3E%3Ctext%20font-family%3D%22math17f39f8317fbdb1988ef4c628eb%22%20font-size%3D%2216%22%20text-anchor%3D%22middle%22%20x%3D%22263.5%22%20y%3D%2230%22%3E%3D%3C%2Ftext%3E%3Cline%20stroke%3D%22%23000000%22%20stroke-linecap%3D%22square%22%20stroke-width%3D%221%22%20x1%3D%22278.5%22%20x2%3D%22307.5%22%20y1%3D%2223.5%22%20y2%3D%2223.5%22%2F%3E%3Ctext%20font-family%3D%22Times%20New%20Roman%22%20font-size%3D%2218%22%20text-anchor%3D%22middle%22%20x%3D%22293.5%22%20y%3D%2216%22%3Erise%3C%2Ftext%3E%3Ctext%20font-family%3D%22Times%20New%20Roman%22%20font-size%3D%2218%22%20text-anchor%3D%22middle%22%20x%3D%22293.5%22%20y%3D%2241%22%3Erun%3C%2Ftext%3E%3C%2Fsvg%3E)
The units for acceleration are usually metres per second squared
Or m/s2 or ms-2
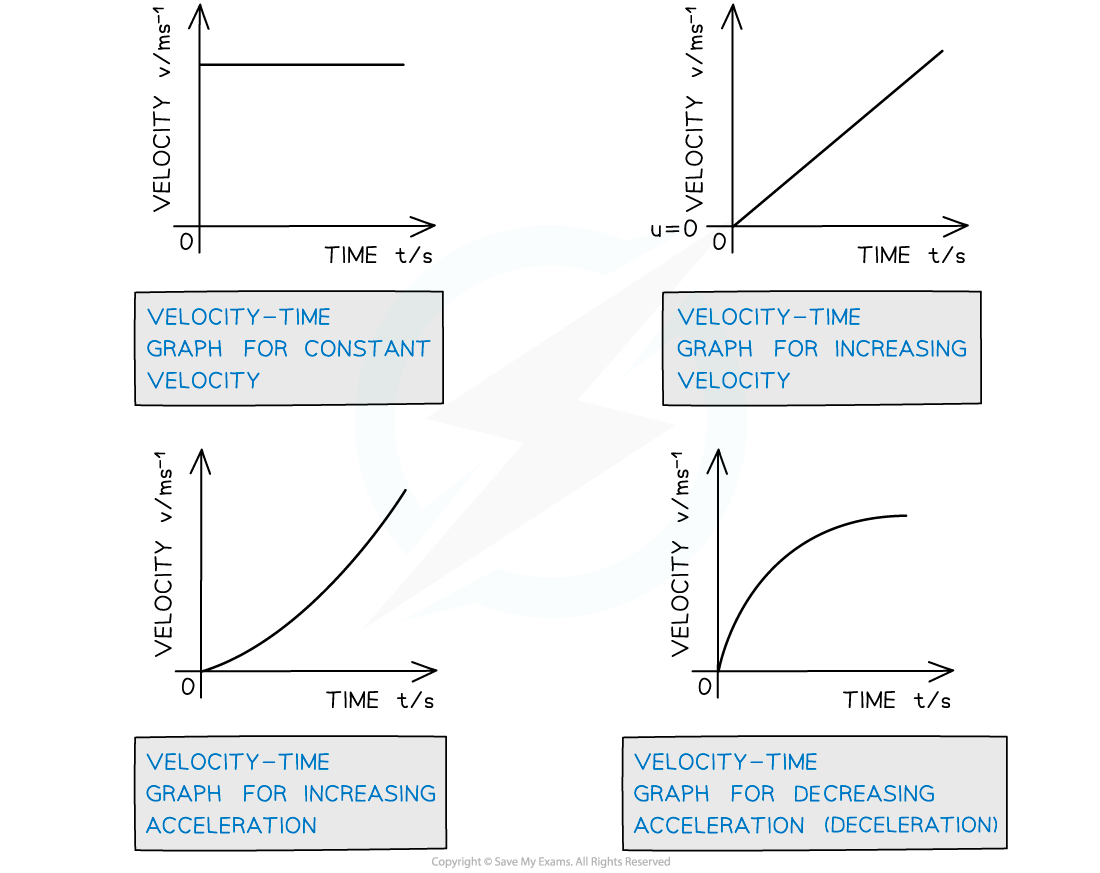
The steeper the line or curve, the faster the object is accelerating
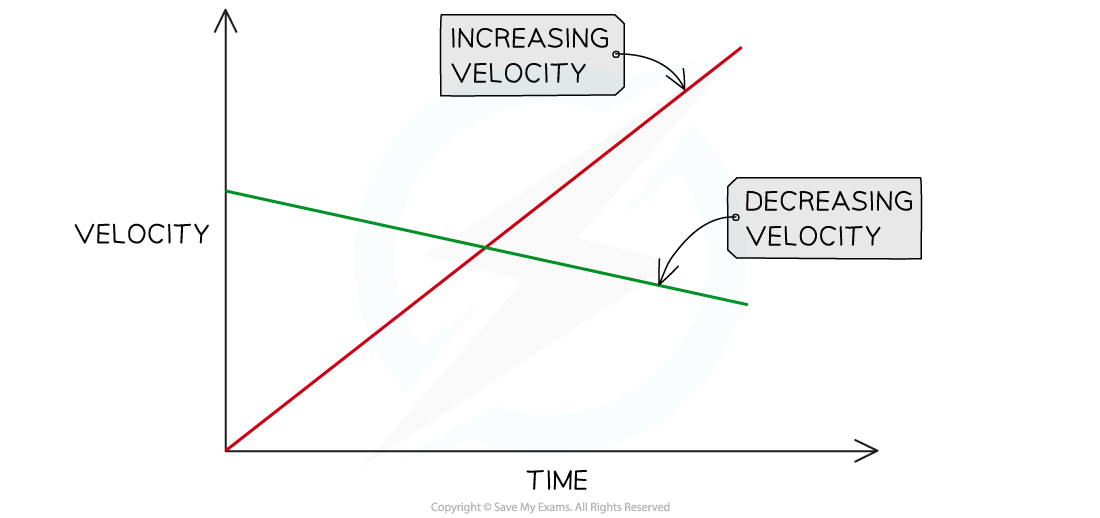
Lines or curves with positive gradients above the x-axis, represent objects increasing their velocity (accelerating)
Lines or curves with negative gradients above the x-axis, represent objects decreasing their velocity (decelerating)
Lines that are horizontal represent constant speed
The object is at rest at points on the horizontal axis (where speed is zero)

How do I work with curved velocity-time graphs?
The gradient of a linear velocity-time graph is constant
This means the acceleration is constant throughout
It is equal to the average acceleration for the journey
A curved velocity-time graph has a gradient which is constantly changing
This means the acceleration is constantly changing
The gradient can be estimated at a point to find the acceleration at that point in time
This is done by drawing a tangent at that point and finding its gradient
The gradient can also be estimated between two points (using a chord) to find the average acceleration between those two points
See Gradients & Rates of Change for how to do this
Worked Example
A skydiver jumps from a plane and their velocity is tracked for 10 seconds.
A graph of her motion is shown below.
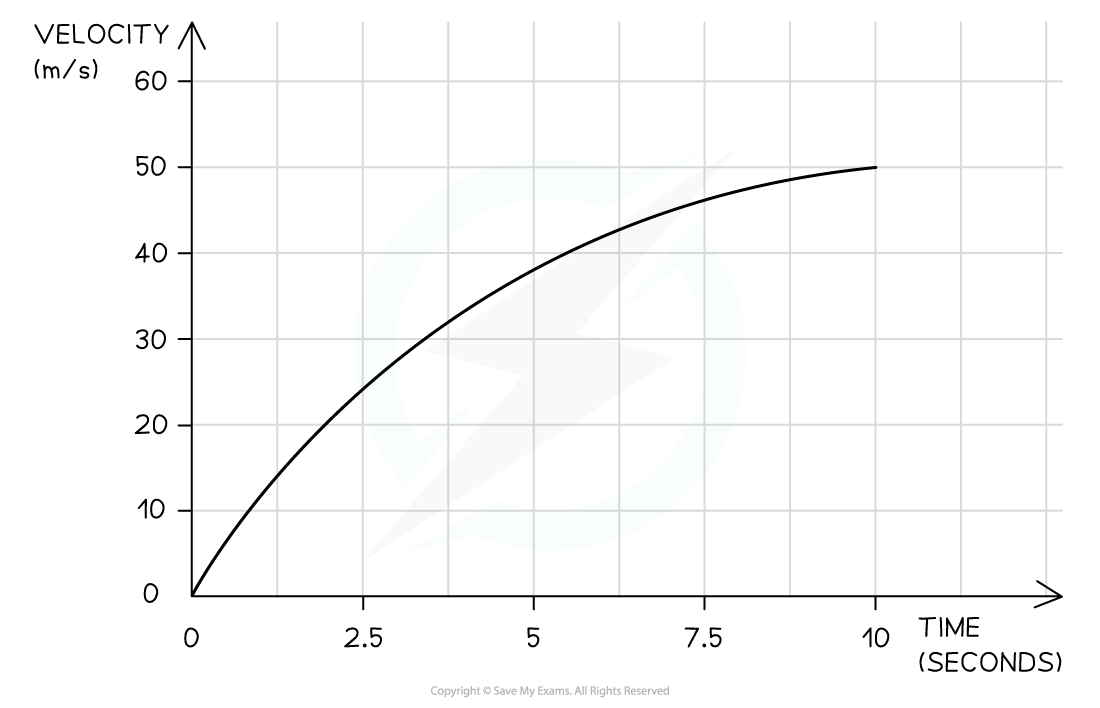
(a) Use the graph to estimate her acceleration at 2.5 seconds.
Draw a tangent to the graph at time 2.5 seconds
A tangent should touch the curve, not intersect it

Select two points on the tangent line and find the gradient of the tangent

![]()
The gradient of the tangent is equal to the acceleration at that point in time
Round the answer to 3 significant figures and add the units
At 2.5 seconds, the acceleration is 6.93 ms-2 (to 3.s.f)
(b) Use the graph to estimate her average acceleration between 0 and 10 seconds.
The average acceleration is given by ![]() between the two points
between the two points
At 0 seconds, the velocity is zero, and the time is zero
At 10 seconds, the velocity is 50 ms-1 and the time elapsed is 10 seconds
![]()
The average acceleration between 0 and 10 seconds is 5 ms-2

Unlock more, it's free!
Did this page help you?
