11 mark
Part of a thermometer is shown below.

What is the correct reading on the thermometer and the uncertainty in this reading?
| reading / °C | uncertainty in reading / °C |
A. | 34 | ±0.5 |
B. | 34 | ±0.1 |
C. | 34.0 | ±1.0 |
D. | 34.0 | ±0.5 |
Did this page help you?
Part of a thermometer is shown below.
What is the correct reading on the thermometer and the uncertainty in this reading?
| reading / °C | uncertainty in reading / °C |
A. | 34 | ±0.5 |
B. | 34 | ±0.1 |
C. | 34.0 | ±1.0 |
D. | 34.0 | ±0.5 |
Did this page help you?
A student carries out a series of determinations of the acceleration of free fall, g. The table shows the results.
g1 / m s–2 | g2 / m s–2 | g3 / m s–2 | g4 / m s–2 | g5 / m s–2 | g6 / m s–2 |
4.91 | 4.89 | 4.88 | 4.90 | 4.93 | 4.92 |
What can be said about the results obtained in this experiment?
The results are accurate and precise
The results are accurate but not precise
The results are not accurate and not precise
The results are precise but not accurate
Did this page help you?
Four people participate in a shooting competition. Each person gets four shots. The diagram shows the target boards of each participant after their turn.
Which target has a low precision and a high accuracy?

Did this page help you?
An ammeter has a systematic error of –0.05 A. The ammeter is then connected to a circuit and shows a reading of 2.45 A.
What should the real reading be?
2.35 A
2.40 A
2.50 A
2.55 A
Did this page help you?
What is the absolute uncertainty for the following measurements?
16.8 cm | 16.6 cm | 16.7 cm | 16.4 cm | 16.4 cm | 16.6 cm |
0.012
0.024
0.2 cm
0.4 cm
Did this page help you?
A micrometer is used to measure the diameters of two spheres.
Diameter of first sphere | 15.01 ± 0.01 mm |
Diameter of second sphere | 17.38 ± 0.02 mm |
The difference in the diameters is calculated.
What is the uncertainty in this difference?
± 0.01 mm
± 0.02 mm
± 0.03 mm
± 0.06 mm
Did this page help you?
A student carries out an experiment and reaches a result which is far from the true value. They carry out an evaluation of the experiment to identify potential sources of systematic and random errors.
Which of the following would not eliminate any systematic errors?
Performing more trials with the same equipment and using the same techniques
Performing more trials with the same equipment but using different techniques
Performing more trials with different equipment but using the same techniques
Checking the calibration of the equipment
Did this page help you?
A fixed quantity ![]() is measured many times in an experiment that has experimental uncertainty. A graph is plotted to show the number, n, of times that a particular value of x is obtained.
is measured many times in an experiment that has experimental uncertainty. A graph is plotted to show the number, n, of times that a particular value of x is obtained.
Which graph could be obtained if the measurement of ![]() has a high precision and a low accuracy?
has a high precision and a low accuracy?

Did this page help you?
The diagram shows the stem of a Celsius thermometer marked to show initial and final temperature values.

What is the temperature change with its absolute uncertainty?
20.5 ± 0.25 °C
20.5 ± 0.5 °C
21 ± 1 °C
22.0 ± 0.5 °C
Did this page help you?
A student plots a graph of height h against time t to show the motion of an object in a fluid. They include the error bars on their plotted points and maximum and minimum lines with their associated equations.

Which of the following equations would correctly calculate the absolute uncertainty in the gradient of the graph?
![]()
![]()
![]()
![]()
Did this page help you?
Systematic and random errors can be compared.
What are the properties that apply to random errors?
The error is consistently too high or too low and by different amounts
The error is constantly too high or low and by the same amount each time
The error can be fully eliminated
The error cannot be fully eliminated
The error can be reduced by averaging repeated measurements
The error cannot be reduced by averaging repeated measurements
1, 3 and 6
2, 4 and 6
2, 3 and 6
1, 4 and 5
Did this page help you?
The measurement of a physical quantity may be subject to random errors and systematic errors.
Which statement is correct?
random errors can be reduced by taking the average of several measurements
random errors are always caused by the person taking the measurement
a systematic error cannot be reduced by adjusting the apparatus
a systematic error results in a different reading each time the measurement is taken
Did this page help you?
A stone falls from rest to the bottom of a water well of depth d. The time t taken to fall is 3.0 ± 0.3 s. The depth of the well is calculated to be 30 m using the equation:
![]()
The uncertainty in a is negligible.
What is the absolute uncertainty in d?
± 0.6 m
± 3 m
± 24 m
± 6 m
Did this page help you?
The diagram shows an experiment to measure the speed of a small ball falling at constant speed through a clear liquid in a glass tube.

There are two marks on the tube. The top mark is positioned at 15 ± 1 mm on the adjacent rule and the lower mark at 285 ± 1 mm. The ball passes the top mark at 2.50 ± 0.02 s and passes the lower mark at 4.50 ± 0.02 s.
The constant speed of the ball is calculated to be 135 mm s–1.
Which expression calculates the fractional uncertainty in the value of this speed?
![]()
![]()
![]()
![]()
Did this page help you?
The strain energy W of a spring is determined from its spring constant k and extension x. The spring obeys Hooke’s law, and the value of W is calculated using the equation shown.
![]()
The spring constant k is 200 ± 1 N m–1 and the extension x is 0.040 ± 0.004 m.
What is the percentage uncertainty in the calculated value of W?
20%
20.5%
10%
10.5%
Did this page help you?
In an experiment investigating the electrolysis of copper, a student sets out to find the electrochemical equivalent, Z.
The electrochemical equivalent of a substance is the amount of substance deposited on a cathode per Coulomb of charge.
This can be determined using the equation:
format('truetype')%3Bfont-weight%3Anormal%3Bfont-style%3Anormal%3B%7D%3C%2Fstyle%3E%3C%2Fdefs%3E%3Ctext%20font-family%3D%22Times%20New%20Roman%22%20font-size%3D%2218%22%20font-style%3D%22italic%22%20text-anchor%3D%22middle%22%20x%3D%225.5%22%20y%3D%2236%22%3EZ%3C%2Ftext%3E%3Ctext%20font-family%3D%22math143f4d31b04031e49f5eb18baba%22%20font-size%3D%2216%22%20text-anchor%3D%22middle%22%20x%3D%2224.5%22%20y%3D%2236%22%3E%3D%3C%2Ftext%3E%3Cline%20stroke%3D%22%23000000%22%20stroke-linecap%3D%22square%22%20stroke-width%3D%221%22%20x1%3D%2239.5%22%20x2%3D%22111.5%22%20y1%3D%2229.5%22%20y2%3D%2229.5%22%2F%3E%3Ctext%20font-family%3D%22Times%20New%20Roman%22%20font-size%3D%2218%22%20font-style%3D%22italic%22%20text-anchor%3D%22middle%22%20x%3D%2248.5%22%20y%3D%2216%22%3Em%3C%2Ftext%3E%3Ctext%20font-family%3D%22Times%20New%20Roman%22%20font-size%3D%2213%22%20text-anchor%3D%22middle%22%20x%3D%2259.5%22%20y%3D%2224%22%3E1%3C%2Ftext%3E%3Ctext%20font-family%3D%22math143f4d31b04031e49f5eb18baba%22%20font-size%3D%2216%22%20text-anchor%3D%22middle%22%20x%3D%2275.5%22%20y%3D%2216%22%3E%26%23x2212%3B%3C%2Ftext%3E%3Ctext%20font-family%3D%22Times%20New%20Roman%22%20font-size%3D%2218%22%20font-style%3D%22italic%22%20text-anchor%3D%22middle%22%20x%3D%2295.5%22%20y%3D%2216%22%3Em%3C%2Ftext%3E%3Ctext%20font-family%3D%22Times%20New%20Roman%22%20font-size%3D%2213%22%20text-anchor%3D%22middle%22%20x%3D%22106.5%22%20y%3D%2224%22%3E2%3C%2Ftext%3E%3Ctext%20font-family%3D%22Times%20New%20Roman%22%20font-size%3D%2218%22%20font-style%3D%22italic%22%20text-anchor%3D%22middle%22%20x%3D%2273.5%22%20y%3D%2247%22%3EI%3C%2Ftext%3E%3Ctext%20font-family%3D%22Times%20New%20Roman%22%20font-size%3D%2218%22%20font-style%3D%22italic%22%20text-anchor%3D%22middle%22%20x%3D%2278.5%22%20y%3D%2247%22%3Et%3C%2Ftext%3E%3C%2Fsvg%3E)
Where:
Mass of cathode before passing current, ![]() = (54.39 ± 0.01) × 10–3 kg
= (54.39 ± 0.01) × 10–3 kg
Mass of cathode after passing current, ![]() = (52.06 ± 0.01) × 10–3 kg
= (52.06 ± 0.01) × 10–3 kg
Current, ![]() = 3.00 ± 1 A
= 3.00 ± 1 A
Time, t = 4800 ± 100 s
What is the largest possible value of Z from these readings?
2.46 × 10⁻⁷ kg C–1
2.48 × 10⁻⁷ kg C–1
2.50 × 10⁻⁷ kg C–1
3.51 × 10⁻⁷ kg C–1
Did this page help you?
The sides of a square are measured to be 8.0 ± 0.2 cm.
Which of the following gives the area of the square and its uncertainty?
64.0 ± 0.2 cm2
64.0 ± 0.4 cm2
64.0 ± 3.2 cm2
64.0 ± 1.6 cm2
Did this page help you?
In an experiment, a radio-controlled car takes 1.50 ± 0.05 s to travel 30.0 ± 0.1 m.
What is the car’s average speed and the uncertainty in this value?
20.0 ± 0.732 m s–1
20.0 ± 0.0366 m s–1
20.0 ± 0.066 m s–1
20.0 ± 9.91 m s–1
Did this page help you?
The diagram shows the initial and final readings on a thermometer before and after a liquid is heated.
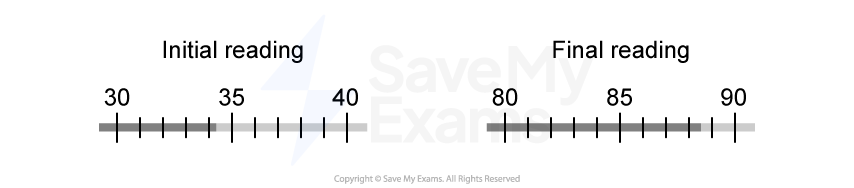
What is the best estimate for the temperature increase of the liquid?
(54.0 ± 0.5) degrees
(54 ± 1.0) degrees
(54 ± 1) degrees
(54.0 ± 2.0) degrees
Did this page help you?
A student collects values of the time period, T, of a pendulum at different lengths of string, L. They want to investigate the relationship:
format('truetype')%3Bfont-weight%3Anormal%3Bfont-style%3Anormal%3B%7D%3C%2Fstyle%3E%3C%2Fdefs%3E%3Ctext%20font-family%3D%22Times%20New%20Roman%22%20font-size%3D%2218%22%20font-style%3D%22italic%22%20text-anchor%3D%22middle%22%20x%3D%225.5%22%20y%3D%2234%22%3ET%3C%2Ftext%3E%3Ctext%20font-family%3D%22math1da1748c56a8e6b097a67ee67c2%22%20font-size%3D%2216%22%20text-anchor%3D%22middle%22%20x%3D%2224.5%22%20y%3D%2234%22%3E%3D%3C%2Ftext%3E%3Ctext%20font-family%3D%22Times%20New%20Roman%22%20font-size%3D%2218%22%20text-anchor%3D%22middle%22%20x%3D%2241.5%22%20y%3D%2234%22%3E2%3C%2Ftext%3E%3Ctext%20font-family%3D%22math1da1748c56a8e6b097a67ee67c2%22%20font-size%3D%2216%22%20text-anchor%3D%22middle%22%20x%3D%2252.5%22%20y%3D%2234%22%3E%26%23x3C0%3B%3C%2Ftext%3E%3Cpolyline%20fill%3D%22none%22%20points%3D%2214%2C-45%2013%2C-45%206%2C0%202%2C-18%22%20stroke%3D%22%23000000%22%20stroke-linecap%3D%22square%22%20stroke-width%3D%221%22%20transform%3D%22translate(58.5%2C48.5)%22%2F%3E%3Cpolyline%20fill%3D%22none%22%20points%3D%226%2C0%202%2C-18%201%2C-16%22%20stroke%3D%22%23000000%22%20stroke-linecap%3D%22square%22%20stroke-width%3D%221%22%20transform%3D%22translate(58.5%2C48.5)%22%2F%3E%3Cline%20stroke%3D%22%23000000%22%20stroke-linecap%3D%22square%22%20stroke-width%3D%221%22%20x1%3D%2272.5%22%20x2%3D%2295.5%22%20y1%3D%223.5%22%20y2%3D%223.5%22%2F%3E%3Cline%20stroke%3D%22%23000000%22%20stroke-linecap%3D%22square%22%20stroke-width%3D%221%22%20x1%3D%2276.5%22%20x2%3D%2291.5%22%20y1%3D%2227.5%22%20y2%3D%2227.5%22%2F%3E%3Ctext%20font-family%3D%22Times%20New%20Roman%22%20font-size%3D%2218%22%20font-style%3D%22italic%22%20text-anchor%3D%22middle%22%20x%3D%2283.5%22%20y%3D%2220%22%3EL%3C%2Ftext%3E%3Ctext%20font-family%3D%22Times%20New%20Roman%22%20font-size%3D%2218%22%20font-style%3D%22italic%22%20text-anchor%3D%22middle%22%20x%3D%2283.5%22%20y%3D%2245%22%3Eg%3C%2Ftext%3E%3C%2Fsvg%3E)
They plot the values on a graph along with the error bars associated with each point, as shown in the diagram.

Which of the following is the closest approximation of the percentage uncertainty in the experimental value of g?
1 %
5 %
15 %
30 %
Did this page help you?
Analogue meters often have a mirrored or metallic strip behind the pointer.

What is the main purpose of this strip?
To magnify the reading indicated by the pointer
To enable the pointer to be seen from different angles
To minimise the risk of parallax error
To reflect as much light as possible on the reading indicated by the pointer
Did this page help you?
Two lengths, n and n – 2 have an uncertainty of ![]() . The uncertainty
. The uncertainty ![]() is much less than n.
is much less than n.
In which of the following quantities is the percentage uncertainty the largest?
![]()
![]()
![]()
![]()
Did this page help you?
In an experiment to determine the acceleration of free fall g, a student presents their calculated value as 9.7835 m s–2 and states their value is only accurate to ± 5%.
Which of the following gives their calculated value to an appropriate number of significant figures?
10 m s–2
9.8 m s–2
9.78 m s–2
9.785 m s–2
Did this page help you?
A small conker is attached to a string and whirled overhead in a horizontal circle. The tension in the string T is measured for different values of linear speed v, and the following graph is obtained.

These experimental results suggest that there is...
a systematic error in v and small random error
a systematic error in T and small random error
a random error in v and small systematic error
a random error in T and small systematic error
Did this page help you?
Which of the following experimental techniques does not reduce the random error associated with the quantity being measured?
Calibrating the Y-sensitivity of the oscilloscope before measuring a voltage
Timing a large number of oscillations to determine the periodic time
Using the gradient of a graph of current against voltage to determine the resistance of an ohmic conductor
Measuring the distance between a large number of nodes on a standing wave to determine the wavelength of the wave
Did this page help you?
The length and breadth of a rectangular card were found to be (5.0 ± 0.2) cm and (3.0 ± 0.2) cm, respectively.
The area of the card cannot be more than
5 cm2
8 cm2
15 cm2
18 cm2
Did this page help you?
An object dropped from the edge of a cliff is timed to take (10.0 ± 0.1) s to fall to the surface of the sea.
If the acceleration due to free fall is (10.0 ± 0.2) m s–2, the calculated height of the cliff from which the object was released should be quoted as:
(500 ± 2.0) m
(500 ± 20.0) m
(500 ± 2) m
(50 ± 2) × 101 m
Did this page help you?
A certain rule can be read to the nearest millimetre. It is used to measure the length of a piece of string whose true length is 50 mm. Repeated measurements of the string give the following readings:
Reading | Length / mm |
1 | 52 |
2 | 52 |
3 | 51 |
4 | 52 |
5 | 51 |
6 | 51 |
Are the readings accurate and precise to within 1 mm?
| Readings are accurate to within 1 mm | Readings are precise to within 1 mm |
A. | No | No |
B. | No | Yes |
C. | Yes | No |
D. | Yes | Yes |
Did this page help you?
A researcher plots a graph to investigate the variation of the current and potential difference of a resistor.

After realising they have read the manufacturer's label of their electrical equipment incorrectly, they determine that the size of the error bars shown should decrease.
Which row correctly describes how this will affect the value of the maximum gradient Gmax, the minimum gradient Gmin, and the resistance of the resistor R?
| Gmax | Gmin | R |
A. | increase | increase | increase |
B. | decrease | decrease | decrease |
C. | increase | decrease | no change |
D. | decrease | increase | no change |
Did this page help you?
A mass is dropped from rest and falls through a distance of 2.0 m in a vacuum. An observer records the time taken for the mass to fall through this distance using a manually operated stopwatch and repeats the measurements a further two times.
The average result of these measured times, displayed in the table below, was used to determine a value for the acceleration of free fall. This was calculated to be 9.8 m s–2.
| first measurement | second measurement | third measurement | average |
time/ s | 0.6 | 0.73 | 0.59 | 0.64 |
Which statement best describes the quality of the measurements taken for this experiment?
The measurements are precise and accurate with no evidence of random errors.
The measurements are not accurate and not always recorded to the degree of precision of the measuring device but the calculated experimental result is accurate.
The measurements are not always recorded to the degree of precision of the measuring device but are accurate. Systematic errors may be present.
The range of results shows that there were random errors made but the calculated value is correct so the experiment was successful.
Did this page help you?