Calculations with Normal Distributions (Edexcel International AS Maths: Statistics 1): Revision Note
Exam code: XMA01

Throughout this section we will use the random variable . For normal, can take any real number. Therefore any values mentioned in this section will be assumed to be any real number.
Calculating Normal Probabilities
How do I find probabilities using a normal distribution?
The area under a normal curve between the points and is equal to the probability P(a < X < b )
Remember for a normal distribution so you do not need to worry about whether the inequality is strict (< or >) or weak (≤ or ≥)
The equation of a normal distribution curve is complicated so the area must be calculated numerically
You will be expected to standardise all normal distributions to and use the table of the normal distribution to find the probabilities
It is likely that your calculator has a function that can find normal probabilities, if so it is a good idea to learn to use it so that you can check your probabilities
However you must show your calculations to get the z values and use the tables to get all the marks
How do I calculate the probability for a normal distribution?
A random variable can be coded to model the standard normal distribution using the formula
You can calculate a probability using the relationship
Always sketch a quick diagram to visualise which area you are looking for
Once you have determined the z value use the table of the normal distribution to find the probability
Refer to your sketch to decide if you need to subtract the probability from one
The probability of a single value is always zero for a normal distribution
You can picture this as the area of a single line is zero
You can look at which side of the mean x is on and the direction of the inequality to decide if your answer should be greater or less than 0.5
As you can use:
Worked Example
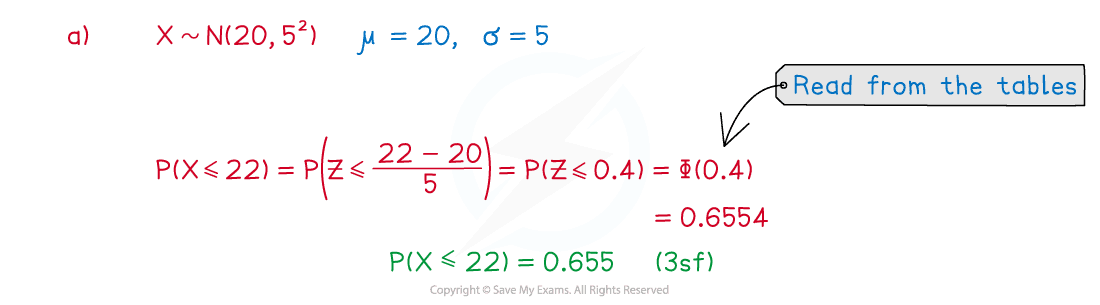
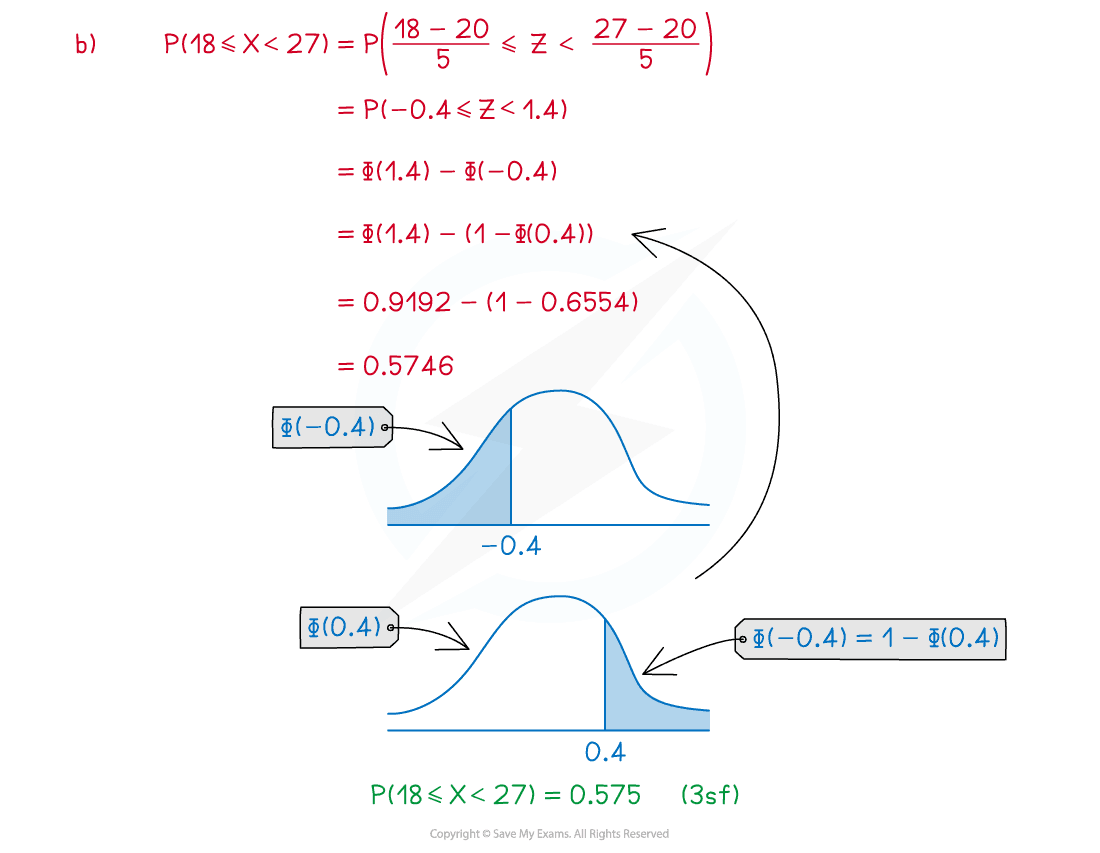
The random variable . Calculate:
(a) ,
(b)
Answer:
Inverse Normal Distribution
Given the value of P(X < a) or P(X > a) how do I find the value of a?
Given a probability you will have to look through the table of the normal distribution to locate the z-value that corresponds with that probability
Look at whether your probability is greater or less than 0.5 and the direction of the inequality to determine whether your z-value will be positive or negative
If is more than 0.5 or is less than 0.5 then a should be bigger than the mean
z will be positive
If is less than 0.5 or is more than 0.5 then a should be smaller than the mean
z will be negative
You do not need to remember these, a sketch will help you see it
Always sketch a diagram

If your probability is less than 0.5 you will need to subtract it from one to find the corresponding z value
Remember that the position of the z-value will not change, only the direction of the inequality
Once you have the correct value substitute it into the formula and solve to find the value of a
Always check that your answer makes sense by considering where a is in relation to the mean
Given the value of P(µ- a < X < µ + a) I find the value of a ?
A sketch making use of the symmetry of the graph is essential
If you are given then will be
This is easier to see from a sketch than to remember
You can then look through the tables for the corresponding z-value and substitute into the formula

Worked Example
The random variable .
Find the value of such that
Answer:

Examiner Tips and Tricks
The most common mistake students make when finding values from given probabilities is forgetting to check whether the z-value should be negative or not. Avoid this by checking early on using a sketch whether z is positive or negative and writing a note to yourself before starting the other calculations.

Unlock more, it's free!
Join the 100,000+ Students that ❤️ Save My Exams
the (exam) results speak for themselves:

Was this revision note helpful?
Build on this topic
