Analysing Critically (AQA Level 3 Mathematical Studies (Core Maths)): Revision Note
Exam code: 1350

Comparing a Model to Real Data
How do I compare results from a model to real data?
In the modelling cycle one of the stages is to evaluate the model by comparing the results to real life data
To do this, you may have to:
Substitute values into a formula used in a given model
The output can then be compared with any real life data provided
Draw a graph to represent a given model
A graph can show many inputs and outputs for the model at once
It can then be used to identify where the model is accurate, or where there are issues or limitations
You may be asked to evaluate the efficacy (effectiveness) of the model using the real data
You should consider:
Is the model accurate for all values?
Does it need to be accurate for all values, or just some?
How accurate does the model need to be?
This will depend on its purpose and context
E.g. Models for diagnosing medical conditions to assist doctors must have a higher level of accuracy than a model for the motion of a character in a video game
Worked Example
The trajectory of a water-rocket fired from a school building in a Physics lesson is modelled by the following equation:
![]()
Where ![]() is the height above the ground in metres, and
is the height above the ground in metres, and ![]() is the time in seconds from when the water-rocket was fired. The building it is fired from is 18 m tall.
is the time in seconds from when the water-rocket was fired. The building it is fired from is 18 m tall.
(a) Work out the values of ![]() for integer values of
for integer values of ![]() between 0 and 6.
between 0 and 6.
Substitute ![]() into
into ![]() in turn, and write the results in a table
in turn, and write the results in a table
| 0 | 1 | 2 | 3 | 4 | 5 | 6 |
|---|---|---|---|---|---|---|---|
| 18 | 32.7 | 37.6 | 32.7 | 18 | -6.5 | -40.8 |
The water-rocket is fired and the real data is tracked. The real data is shown on the graph below.
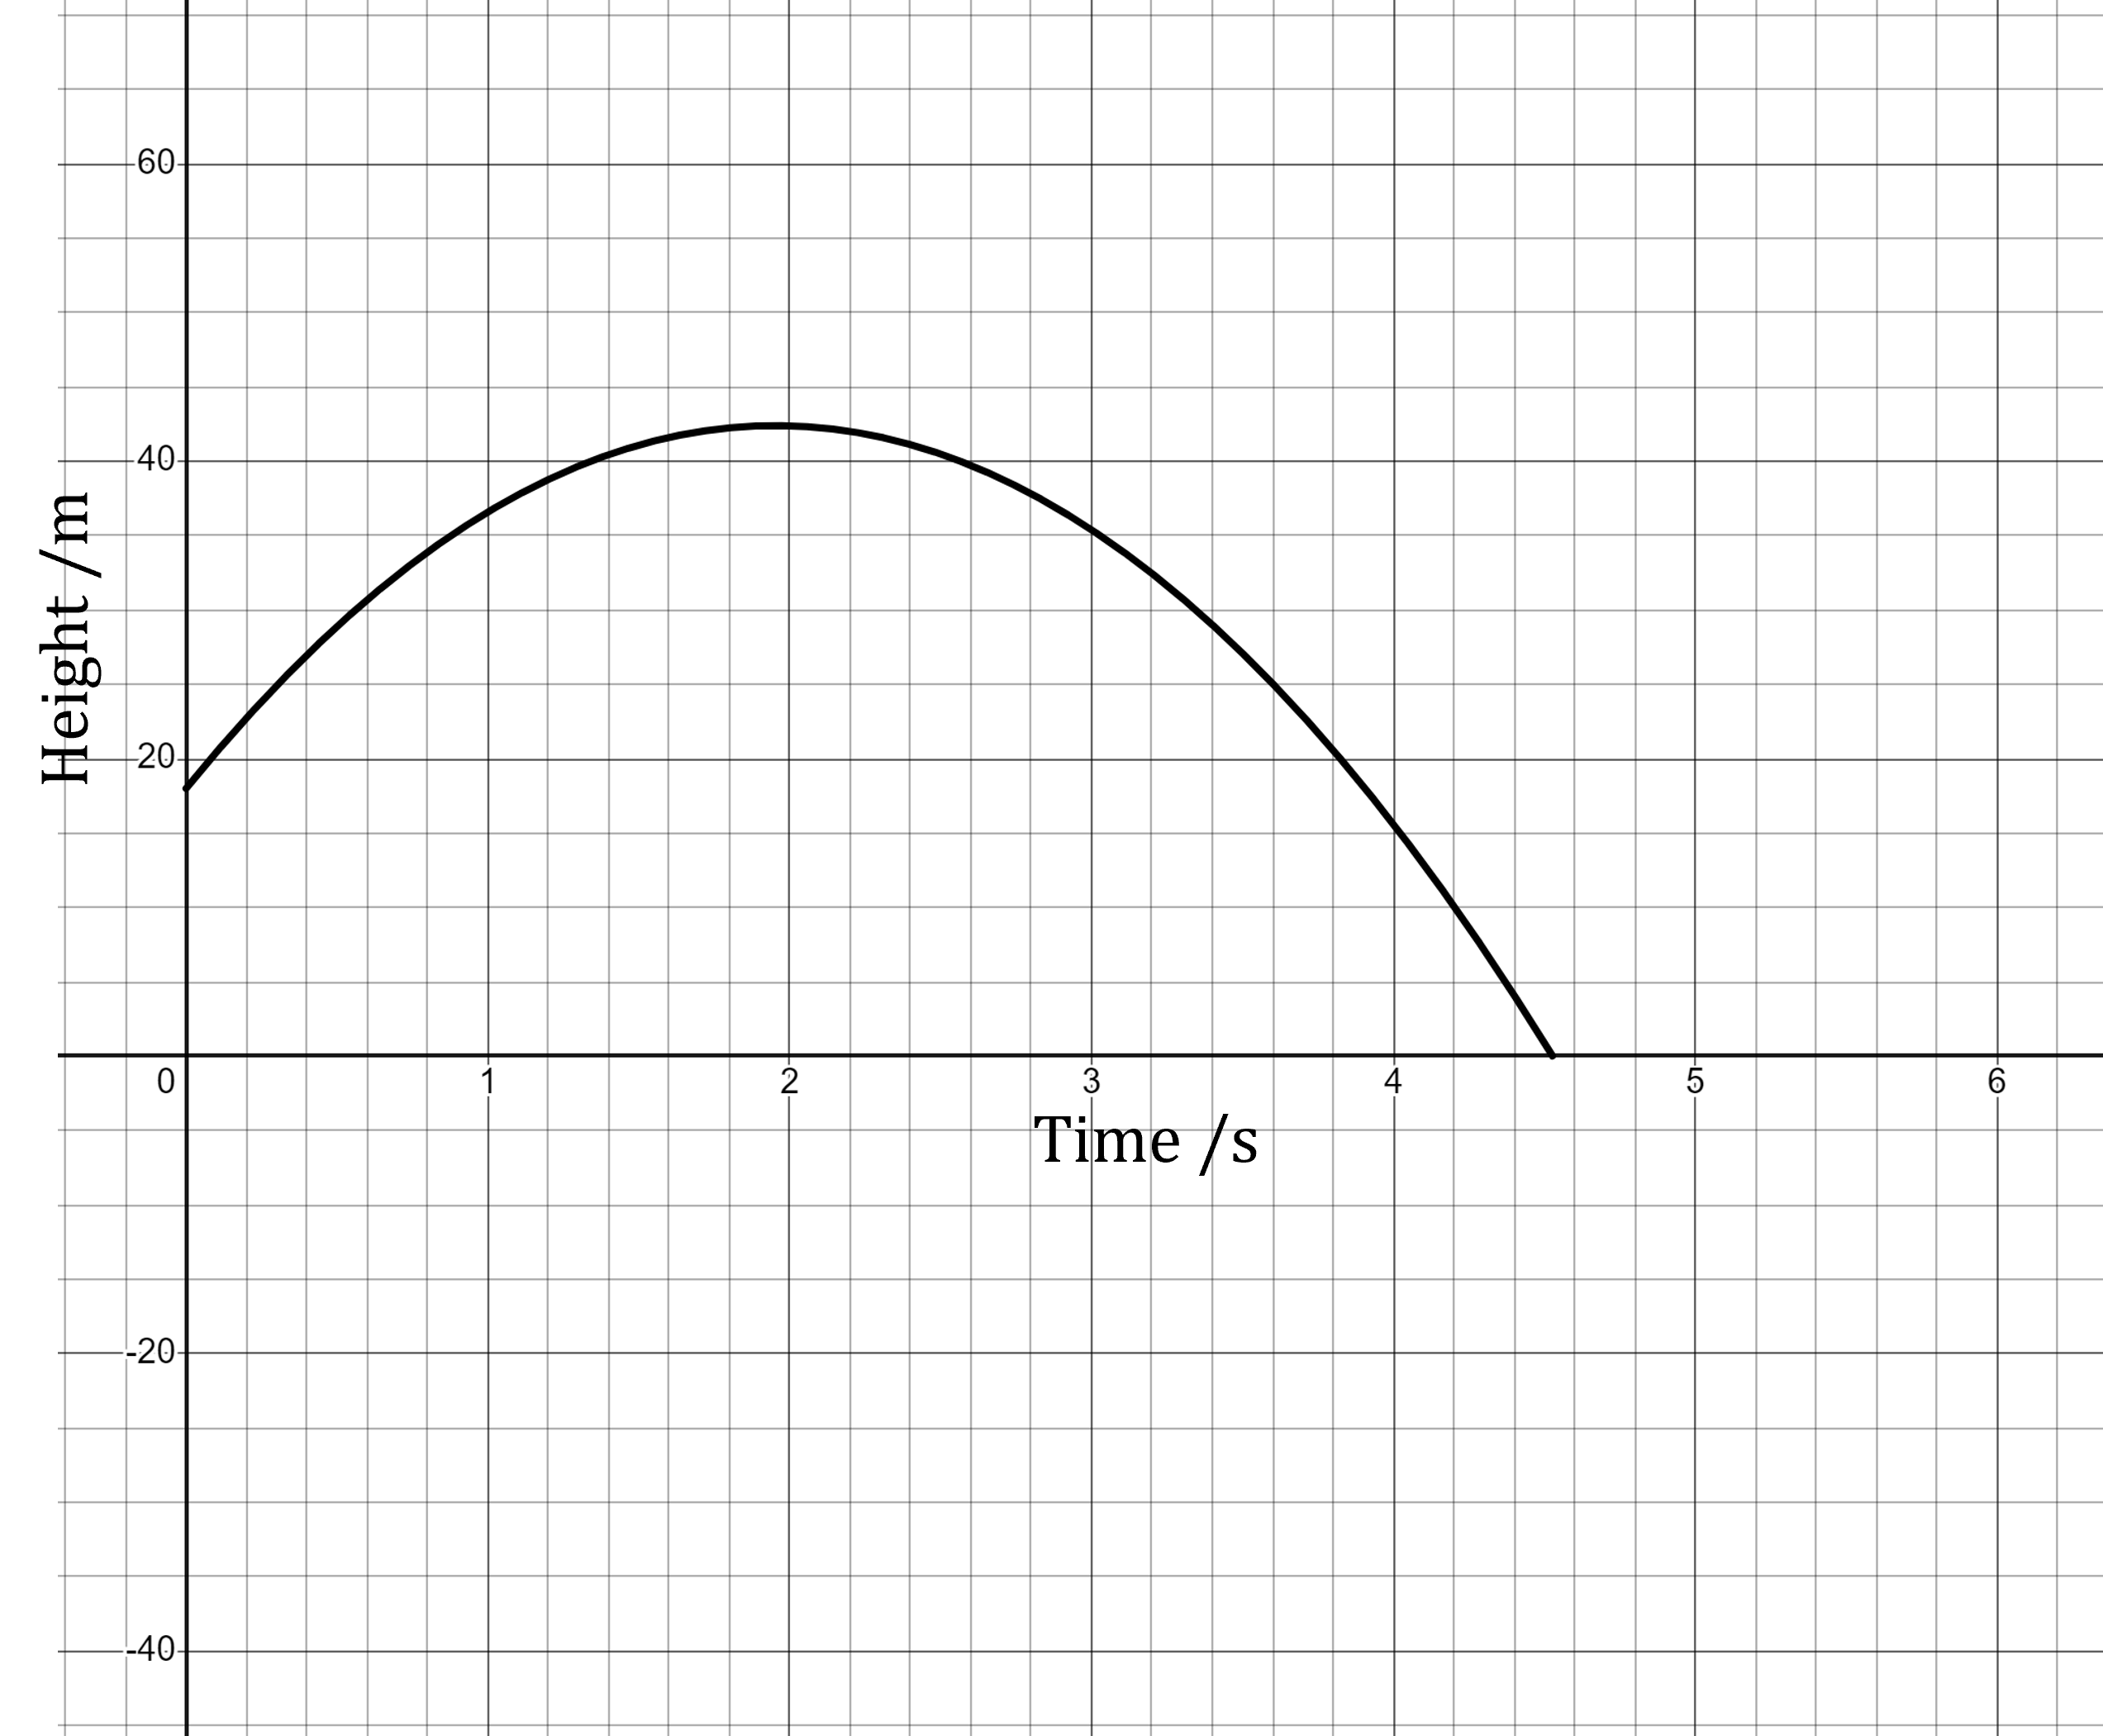
(b) Use the graph for the real data and your calculated values for the model to comment on the accuracy of the model.
Use the calculated values for the model in part (a) to plot the points on the same graph, and then join with a smooth curve
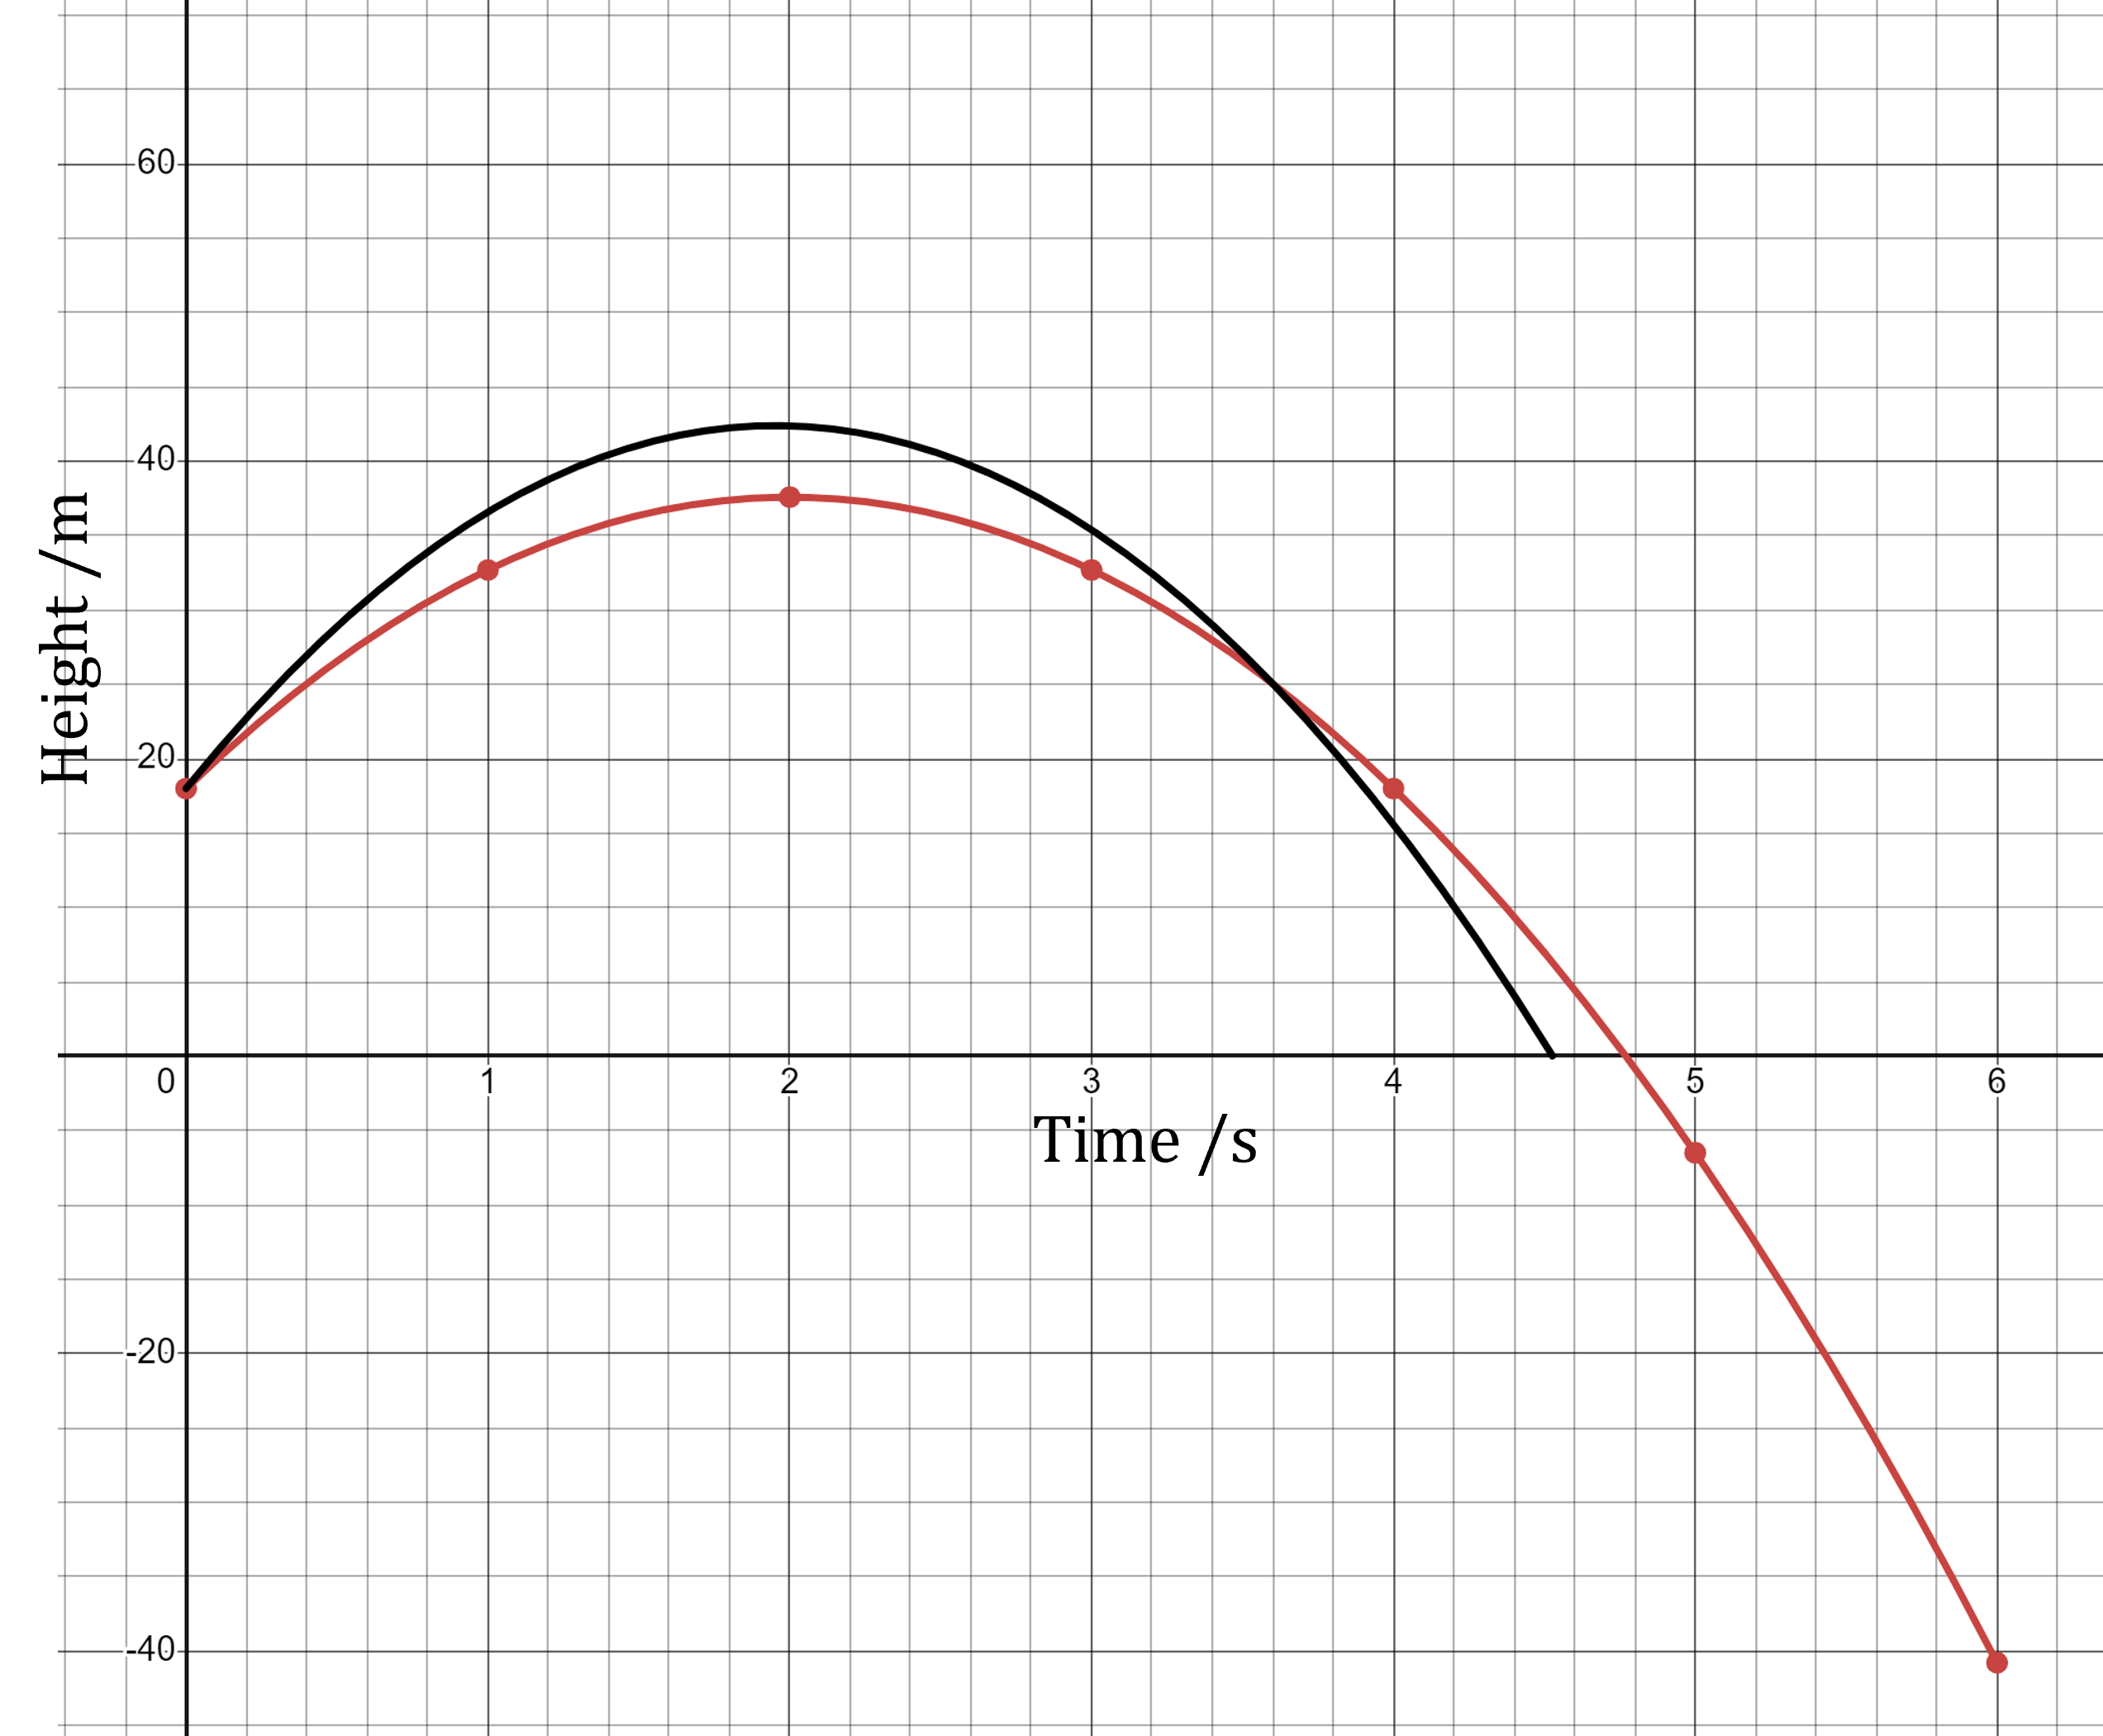
Compare the two curves
Consider aspects that are similar
The model has a similar overall shape to the real data.
This suggests that the use of a negative quadratic to model the height of the water-rocket is accurate.
The starting height of the rocket, 18 m at 0 seconds, is modelled accurately.
Then consider aspects which are different
The model predicts a lower maximum height, 37.6 m, than the real maximum height of around 42 m.
The model also predicts a longer motion in total, lasting around 4.8 seconds, compared to the real time of around 4.5 seconds.
The model also predicts a negative height, which is inaccurate, as the motion stops when the water-rocket strikes the ground.
The model should restrict the values for times which are valid, e.g. 0 ≤ t ≤ 4.8
Make an overall assessment of the accuracy, taking into account the context
There is not necessarily a "correct" judgement for these questions, the marks are awarded for how you argue and evidence your view
The model is relatively accurate for the given scenario, having the correct general shape and correct starting height.
The maximum height is only 4.5 m different to the real data, this is an error of around 11%.
The total time for the motion is within 0.3 seconds of the true value, this is an error of around 7%.
Overall this is a fair model for the context of firing a water-rocket in a school Physics lesson, however, there is still room for refinement if necessary.
Critical Analysis of Quoted Data
Why is critical analysis important?
In the media data is quoted and claims are made, which may not be mathematically thorough
This could be because:
The author is trying to persuade the viewer or reader about an issue
The author has an agenda, which is not simply informing the viewer or reader and being objective
E.g. More dramatic stories sell more newspapers, and receive more clicks online
Or it can simply be due to not having a deep enough understanding of the underlying data or methodology
This is why it is important to critically analyse data that is presented to you
In an exam, you may be asked to critically analyse, this means you must:
Look for and identify errors, suggest improvements and evaluate
whether a claim is justified
How might statistics and data be misleading?
There are numerous ways in which data can be presented to be misleading or unrepresentative
Selectivity of data or "Cherry picking"
Only a portion of the data may be presented
This portion could be biased to support a particular viewpoint rather than showing the entire picture
Data visualisation issues
Graphs and charts can be manipulated to exaggerate trends or obscure details
Misleading scales and axes are very common
Scatter graphs may be shown which show a correlation
A correlation does not necessarily imply causation
I.e. Two variables changing at similar rates may not be linked at all
Use of averages
Whilst averages are not inherently bad, data with a large range can be obscured by using an average
The mean will be more affected by outliers than the median
This can be used to represent the data in a way that suits the author's agenda
E.g. A company could advertise their mean wage in a jo advert, which has been affected by a single extremely high wage of the CEO, making it seem as though the wages are higher than they are
Headlines
There may be a lack of context in a headline
The headline without the full story may be worrying
E.g. "crime rate at an all-time high",
This could be true but only by 0.2%
Deeper investigation could show it's because of an increase in shoplifting, whereas violent crime has dramatically decreased
If a dramatic headline is presented first, before the data, it can influence how the reader or viewer consumes the information
E.g. If a TV show stated "chocolate hugely increases your life expectancy" and then showed a graph with a weak positive correlation
Viewers may feel differently about the data compared to if they were shown the graph first
Bias in the source
If the source of the data is not neutral on the matter being investigated, there may be bias
E.g. If a local swimming pool was being closed down and the owner and staff carried out a survey to gauge opinion, there may be bias in their methodology due to their personal views
Sampling techniques can also be biased
E.g. Surveying only people from a specific area, or a specific age category may produce biased results
Extrapolating from data inappropriately
Extrapolation is when values are predicted beyond the range of the data
Data that is extrapolated may be less reliable as there is no evidence to support it
How should I answer a critical analysis question?
You may be asked to consider the validity of or critically analyse a claim made about given data
Make sure you understand the data that is shown
What does it represent?
On a graph, pay close attention to the scale
What is the scope of the data?
What are the limitations of the data?
Read the claim carefully
How general or specific is it?
Is the claim extrapolating or interpolating from the data?
Interpolation is when values are predicted within the range of the data
Extrapolation is when values are predicted beyond the range of the data
Consider if the claim is valid or not, or to what extent it is valid
There is usually some truth in the claim, but it may be exaggerated or some aspects of the data may have been ignored
Explain your reasoning clearly, quoting data points to evidence your argument
Worked Example
In December 2023, an online article on an estate agent's website claims that "House prices have nearly doubled since 2005".
Critically analyse this claim using the two sources below.
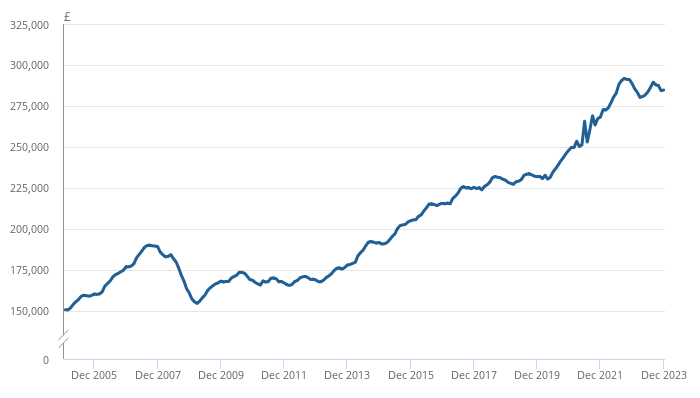
Use figure 1 to compare the figures for December 2005 to December 2023
Using figure 1:
Average house price in December 2005 was around £150 000
In December 2023 it was around £285 000
£285 000 ÷ £150 000 = 1.9
This is a 90% increase
This is not doubled, but is relatively close
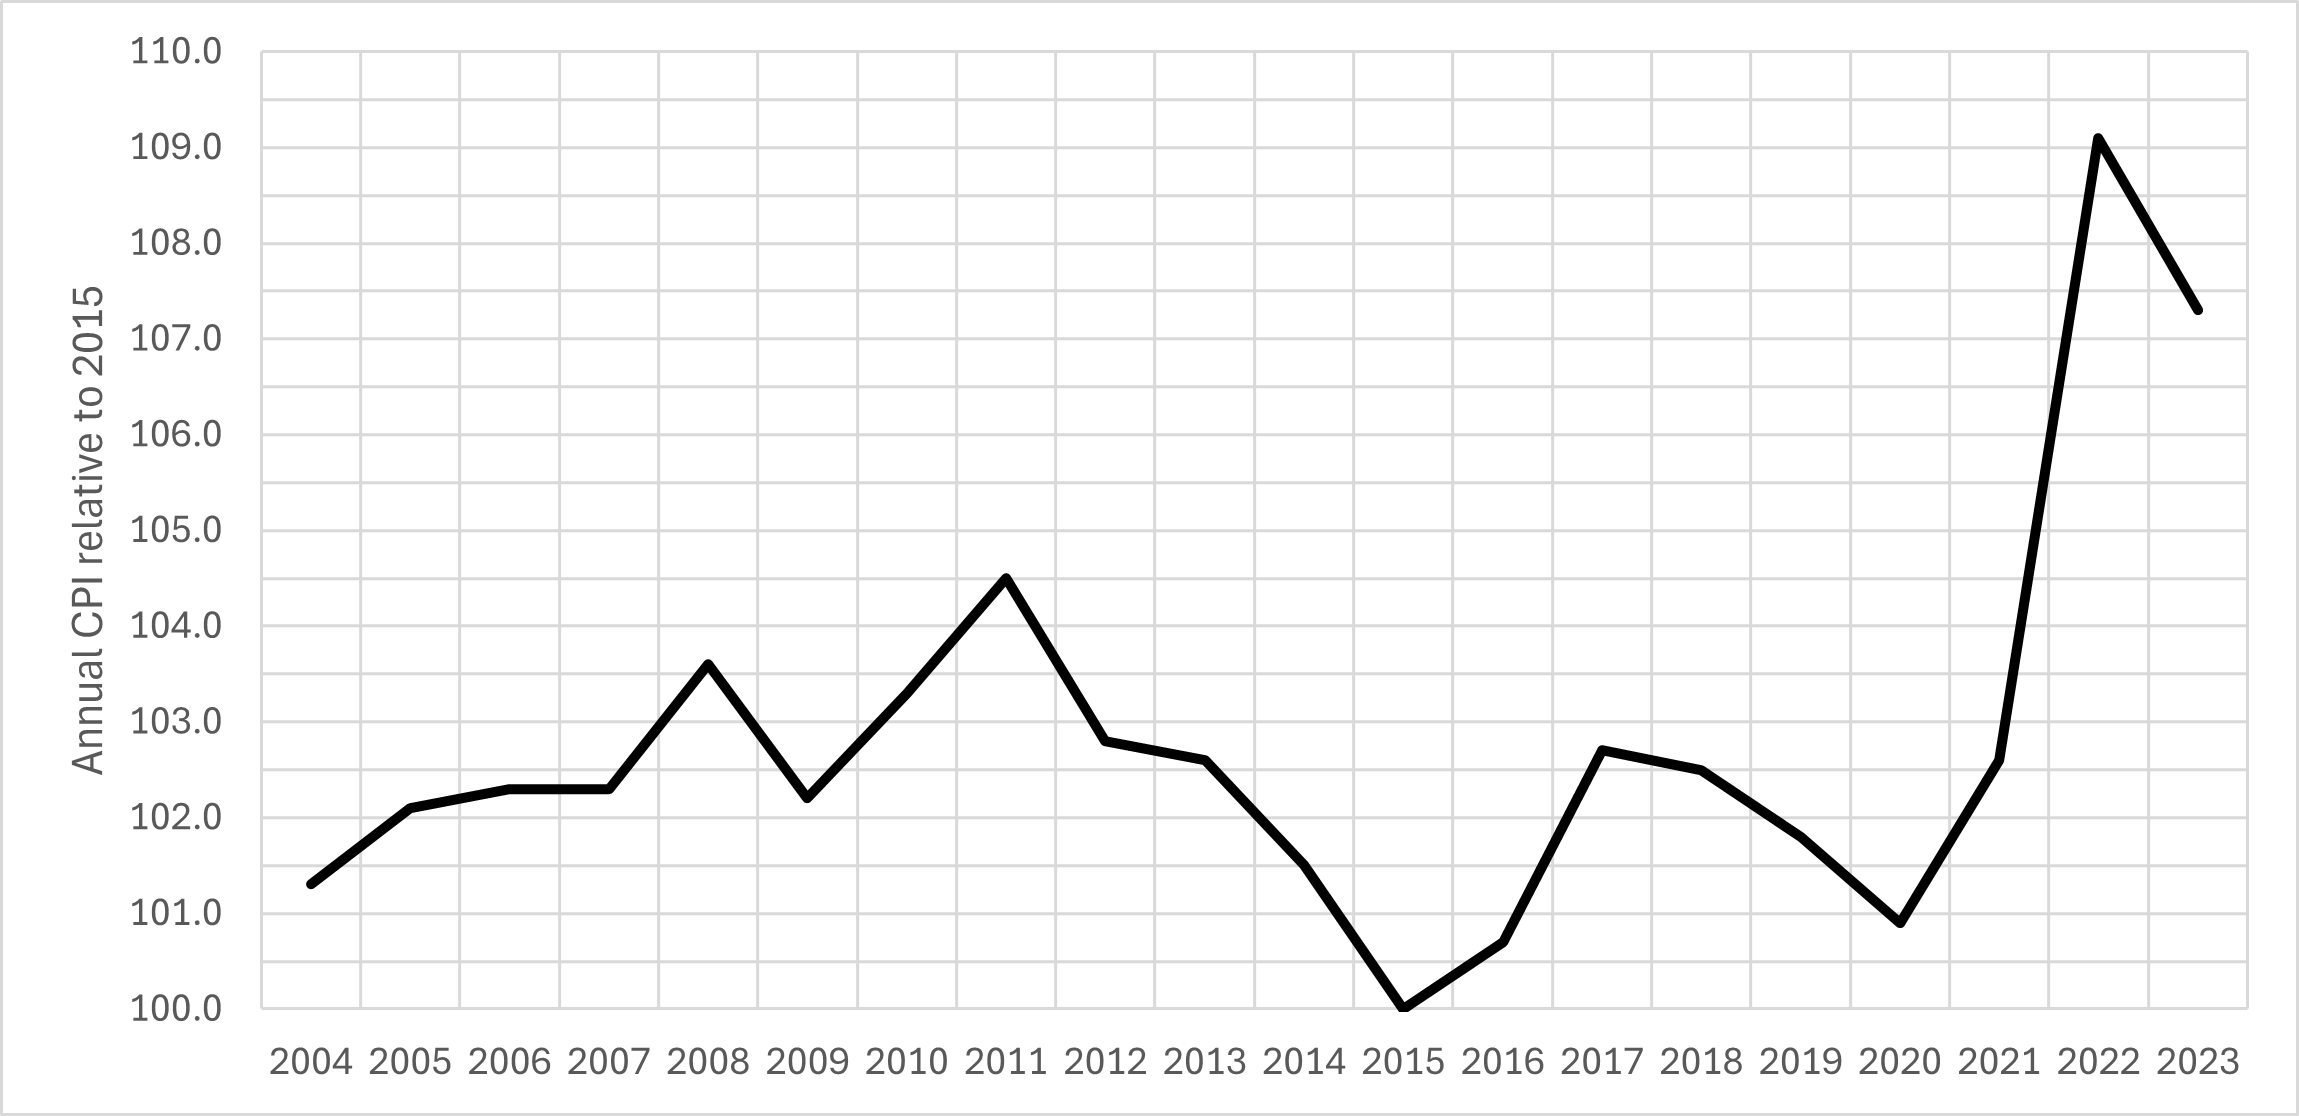
Use figure 2 to adjust the 2005 price for inflation using CPI
Using figure 2 to adjust the prices for inflation, so the figures are in "real terms":
CPI in 2005 is around 102.1
CPI in 2023 is around 107.3
Percentage change from 2005 to 2023
107.3 ÷ 102.1 = 1.05093046... = 5.09 % increase (3.s.f)
Increase the 2005 house price by 5.09% to find the cost in "2023 money"
£150 000 × 1.0509 = £157 635
Compare the figures again
£285 000 ÷ £157 635 = 1.807974117...
This is equivalent to an 80.8% increase
Consider the calculations and write a short conclusion
Using inflation-adjusted figures, UK average house prices have only risen by around 80%, which is not doubling, as claimed.
Consider any issues with the claim itself
The claim is not specific in several aspects.
It claims "nearly doubled" but it is not clear how close this figure is expected to be to a 100% increase.
The claim does not state if this is comparing inflation-adjusted figures or nominal, non-adjusted prices.
The claim does not state exactly which month during in these years is being compared, as house prices can fluctuate greatly within the year.
The claim does not specify a region or locality for this figure. It is assumed it is claiming for a national figure but this is not clear. There probably are locations in the UK where house prices have doubled in real terms between 2005 and 2023.
Consider any issues with the source
The article appears on an estate agent's website, so the author may have a viewpoint they wish to promote. For example they might want to promote that property prices have increased rapidly, so people are encouraged to sell their house.

You've read 0 of your 5 free revision notes this week
Unlock more, it's free!
Did this page help you?
