Gantt Charts (AQA Level 3 Mathematical Studies (Core Maths): Paper 2B: Critical Path & Risk Analysis): Revision Note
Exam code: 1350

Gantt Charts
What is a Gantt (cascade) chart?
A Gantt chart (also known as a cascade diagram), is a graphical display of the activities making up a project
A Gantt chart shows
the critical activities
the total float for non-critical activities
the minimum project duration
Gantt charts can be used in resource levelling and scheduling problems when the number of workers for each activity is known
In the first instance, a Gantt chart assumes one worker per activity
How do I draw a Gantt (cascade) chart?
(Usually) a horizontal axis is drawn for time and this appears at the bottom of the Gantt chart
Activities are then drawn as a series of bars (rectangles), or horizontal lines, underneath
Each activity is assumed to commence at its earliest start time
Each activity is assumed to occur in a single block of time, with no breaks
E.g. an activity of duration 5 and earliest start time 4 would be drawn as a bar starting at 4 and ending at 9
Critical activities are often (but not always) drawn in the same horizontal line
These have a total float of zero so can be drawn back-to-back
Non-critical activities are drawn one per line
Their total float is indicated by a bar drawn with a dotted line
E.g. an activity of duration 4, earliest start time 7 and total float 3 would be drawn as a (solid) bar starting at 4 and ending at 11, with a dotted bar starting at 11 and ending at 14
The dotted float bar can be seen as room that the activity bar can slide back and forth along to vary its start and end time
Bars are labelled with their activity name and duration
Floats are not labelled
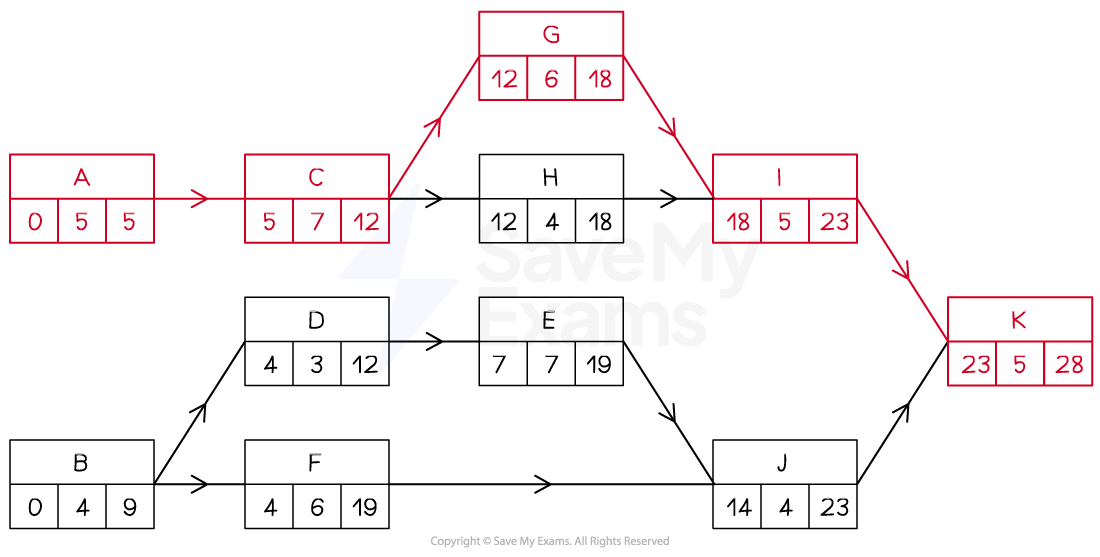
For the activity network below
The critical activities are highlighted and are A, C, G, I and K
The critical path is A-C-G-I-K
The minimum project duration is 28 (days)
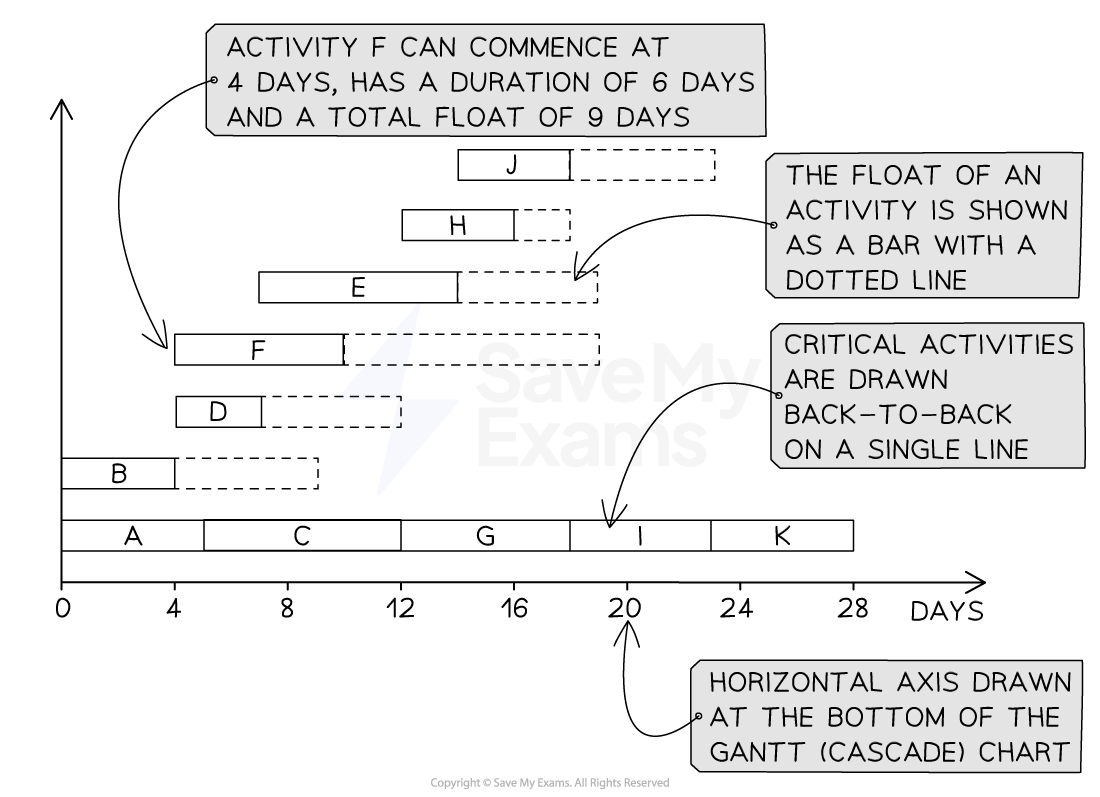
The Gantt chart for the project would be constructed with
A horizontal axis running from 0 to (at least) 28 at the bottom
Critical activities A, C, G, I and K drawn back-to-back on a single line just above the axis
Activities B, D, E, F, H and J are each drawn on a separate line
E.g. activity D will be drawn as a solid bar from 4 to 7 with a dotted bar from 7 to 12
Examiner Tips and Tricks
An exam question is likely to provide a grid and the axes for you to draw a Gantt chart on.
Worked Example
The Gantt chart (cascade diagram) below, represents a project.
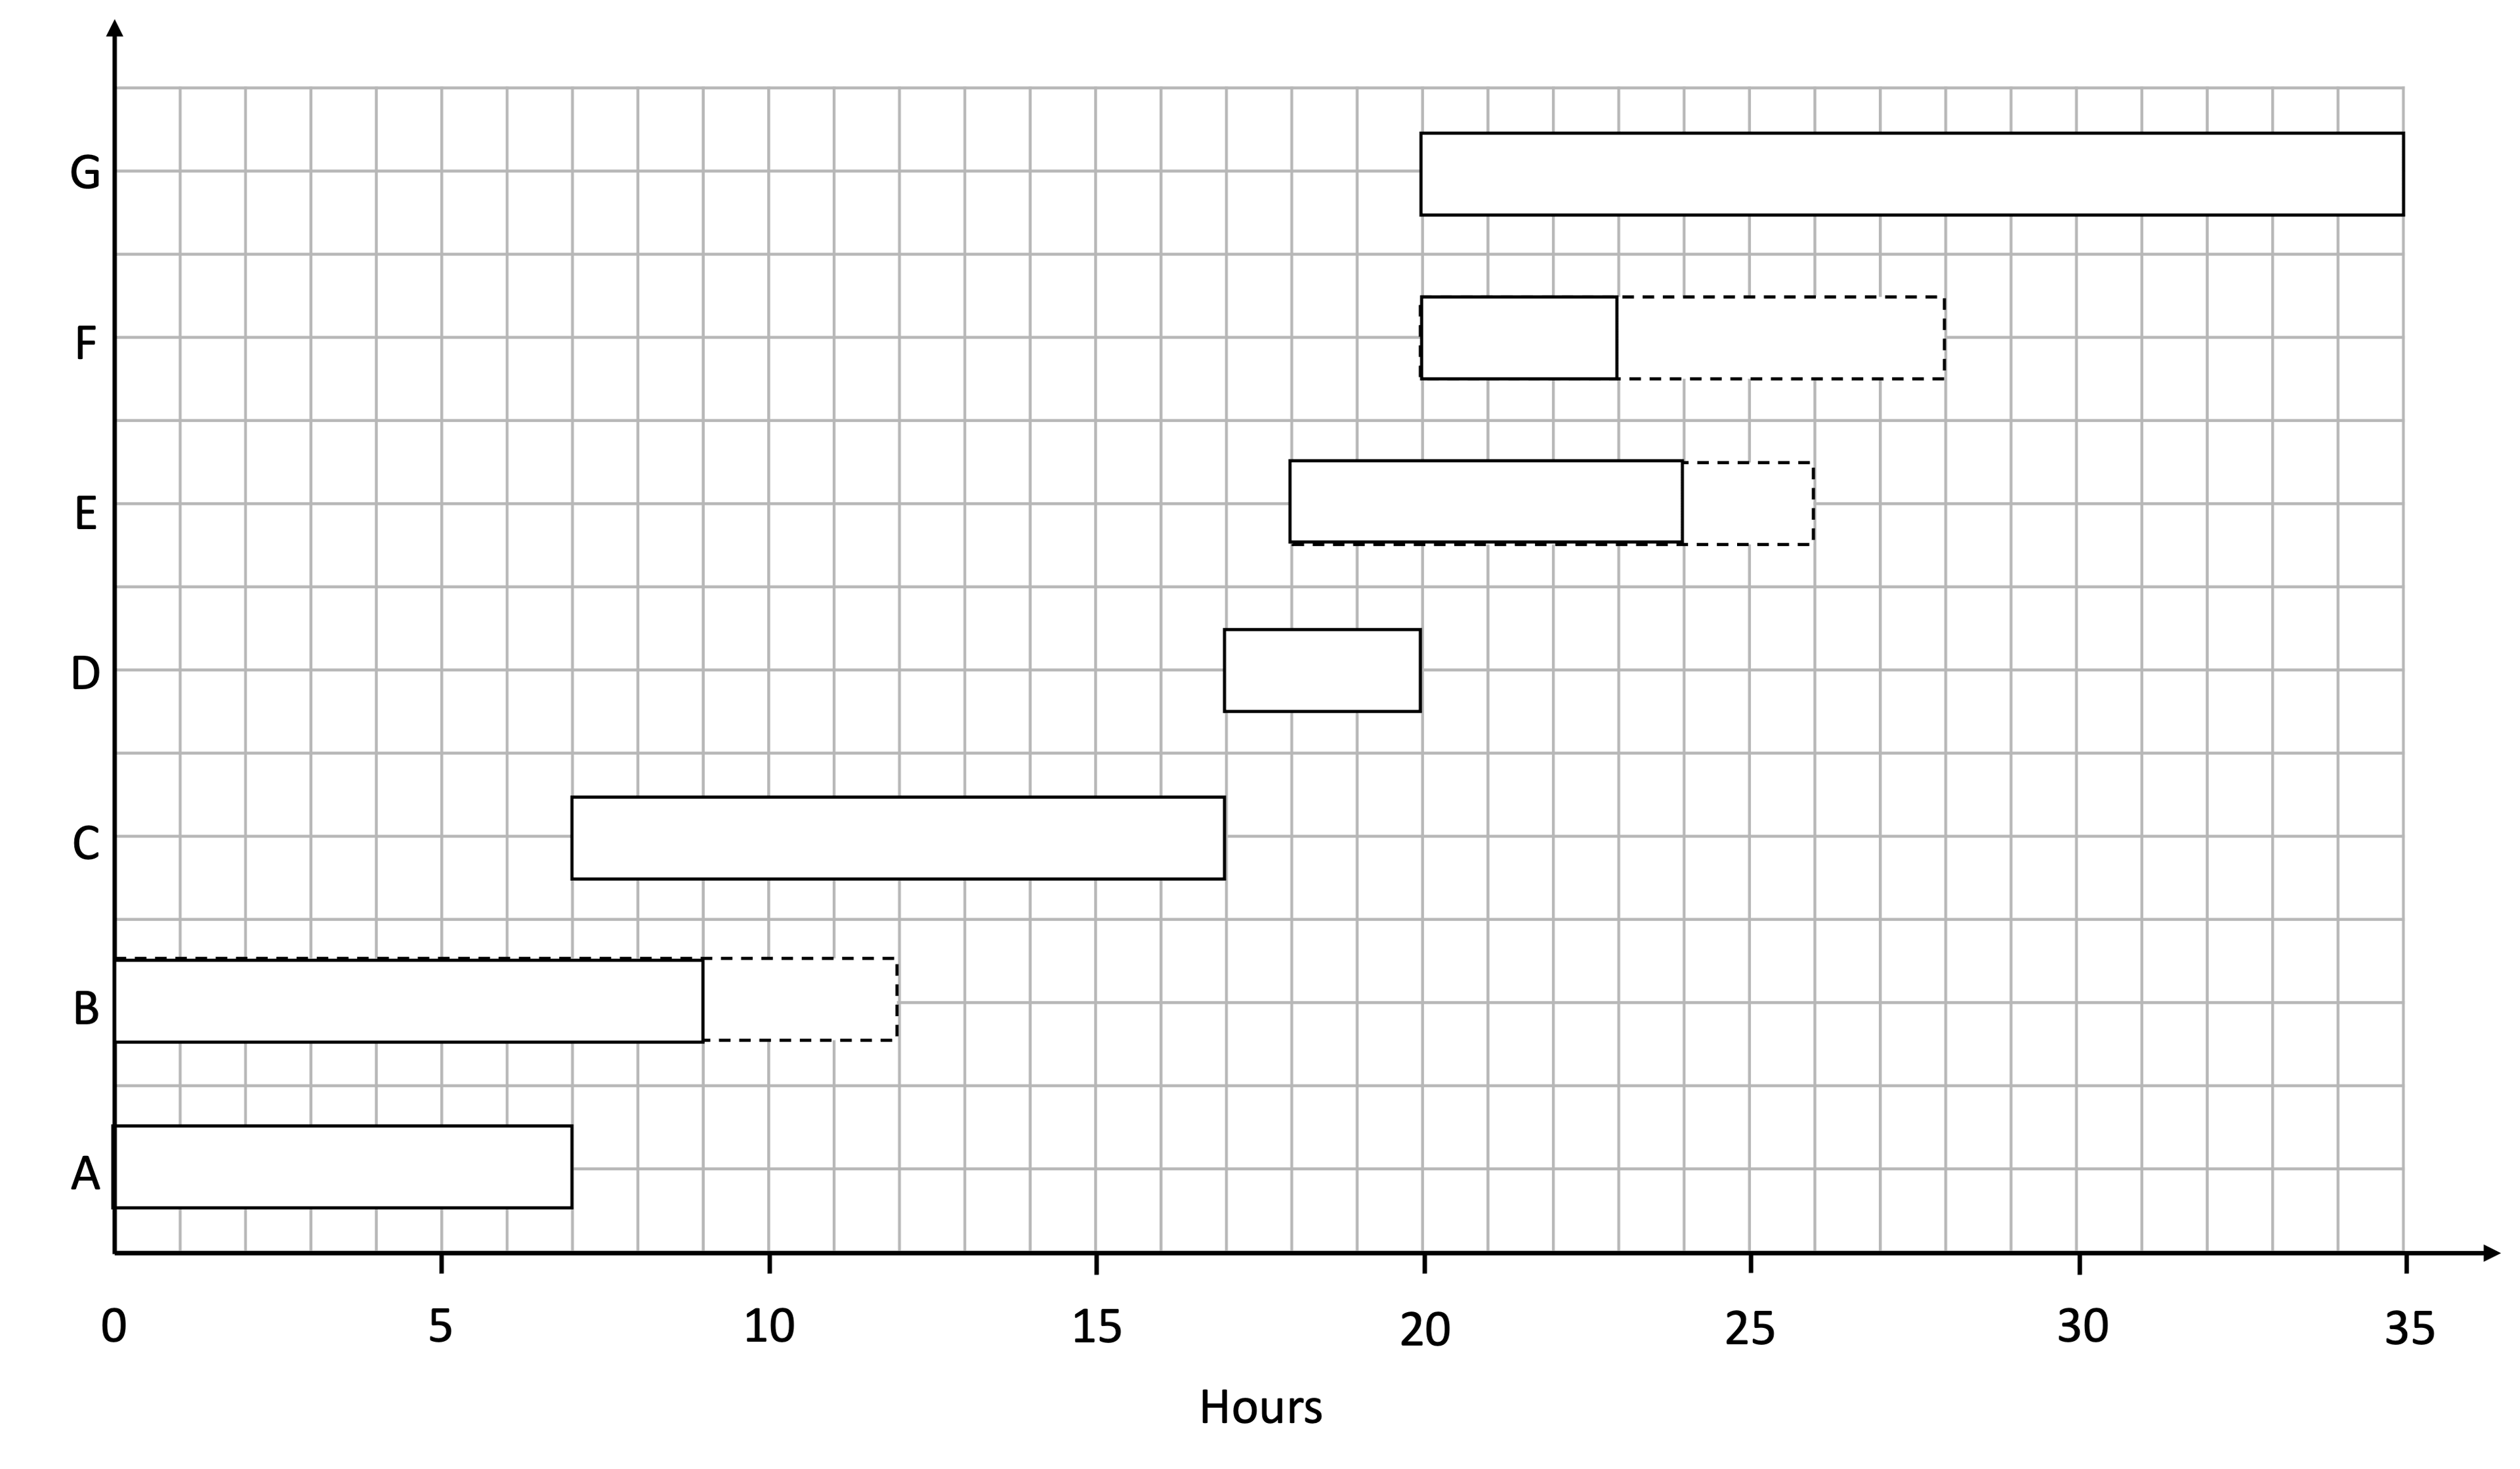
(a) What is the total minimum time for the project?
Answer:
The last critical activity has a latest finish time of 35 hours
35 hours
(b) What are the critical activities in the project?
Answer:
The critical activities are the activities with no float, i.e. the activities with no dotted bars
Critical activities: A, C, D, G
(c) For each activity with a float, give the float time.
Answer:
Activities B, E and F all have float time
Calculate float time for each, using
'float time = latest finish time - duration of activity - earliest start time'
B: float = 12 - 9 - 0 = 3
E: float = 26 - 6 - 18 = 2
F: float = 28 - 3 - 20 = 5
B: 3 hours
E: 2 hours
F: 5 hours

Unlock more, it's free!
Join the 100,000+ Students that ❤️ Save My Exams
the (exam) results speak for themselves:

Was this revision note helpful?
