Inequalities on Graphs (Cambridge (CIE) AS Maths): Revision Note
Exam code: 9709

Did this video help you?
Inequalities on graphs
What are inequalities on graphs?
Inequalities can be represented on graphs by shaded regions and dotted or solid lines

These inequalities have two variables, x and y
Several inequalities are used at once
The solution is an area on a graph (often called a region)
The inequalities can be linear or quadratic
How do I draw inequalities on a graph?
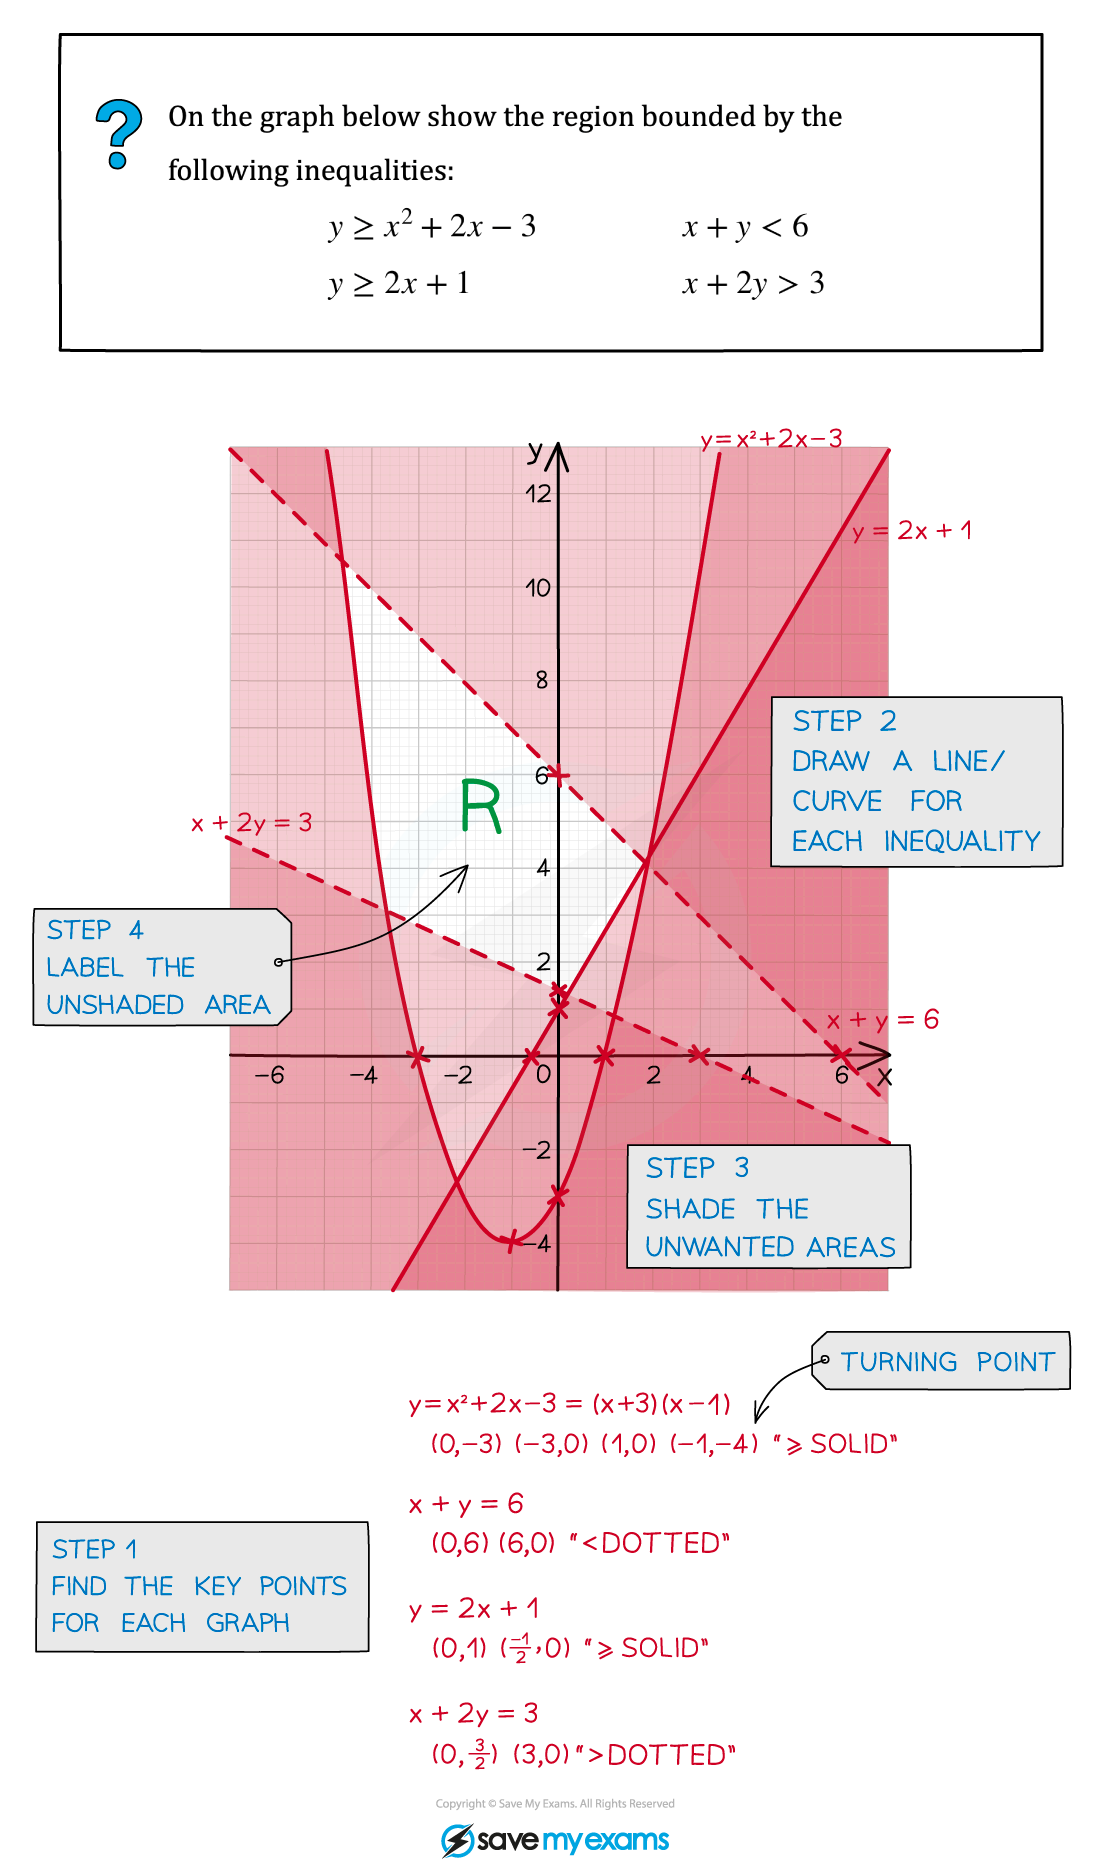
Sketch each graph
If the inequality is strict (< or >) then use a dotted line
If the inequality is weak (≤ or ≥) then use a solid line
Decide which side of the line satisfies the inequality
Choose a coordinate on each side and test it in the inequality
The origin is an easy point to use
If it satisfies the inequality then that whole side of the line satisfies the inequality
For example: (0,0) satisfies the inequality y < x2 + 1 so you want the side of the curve that contains the origin

Examiner Tips and Tricks
Recognise this type of inequality by the use of two variables
You may have to deduce the inequalities from a given graph
Pay careful attention to which region you are asked to shade
Sometimes the exam could ask you to shade the region that satisfies the inequalities this means you should shade the region that is wanted.
If you're unsure, you could …
… draw the (dotted and/or solid) lines in on the answer diagram and use a rough sketch to find the region required …
… write clearly you have “shaded the unwanted area”
… and/or …
… write clearly you have “shaded the unwanted area
As long as your final answer is clear you should get the marks!
Worked Example

Unlock more, it's free!
Did this page help you?