Displacement-Time Graphs (Cambridge (CIE) A Level Maths): Revision Note
Exam code: 9709

Did this video help you?
Displacement-time graphs
What is a displacement-time graph?
Displacement-time graphs show the displacement of an object from a fixed origin as it moves in a straight line
They show displacement (on the vertical axis) against time (on the horizontal axis)
Displacement-time graphs can go below the horizontal axis whereas distance-time graphs can not
Distance can not be negative whereas displacement can be
What are the key features of a displacement-time graph?
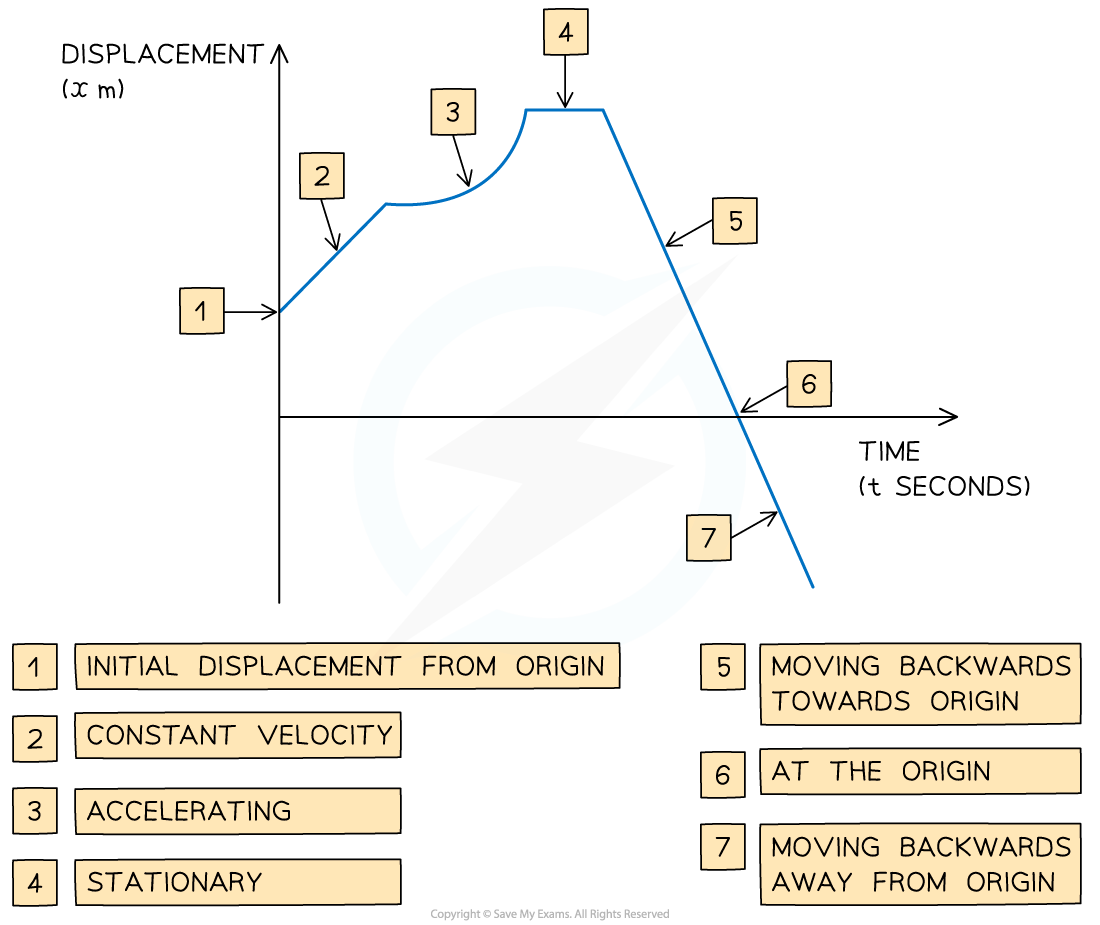
The gradient of the graph equals the velocity of the object
A positive gradient means the object is travelling forwards
A negative gradient means that the object is travelling backwards
The steeper the line, the greater the speed
A straight line shows that the object is moving at a constant velocity
A curved line shows that the object is accelerating or decelerating
A horizontal line shows that the object is stationary
If the graph touches the x-axis, then the object is at the origin at that time
How do I find the average speed and the average velocity of a journey?
![]()
The average speed can not be negative as speed is a scalar quantity and can only take a positive value
format('truetype')%3Bfont-weight%3Anormal%3Bfont-style%3Anormal%3B%7D%3C%2Fstyle%3E%3C%2Fdefs%3E%3Ctext%20font-family%3D%22stix278c526c79a467f767590df7316%22%20font-size%3D%2218%22%20text-anchor%3D%22middle%22%20x%3D%2230.5%22%20y%3D%2231%22%3EAverage%3C%2Ftext%3E%3Ctext%20font-family%3D%22stix278c526c79a467f767590df7316%22%20font-size%3D%2218%22%20text-anchor%3D%22middle%22%20x%3D%2295.5%22%20y%3D%2231%22%3Evelocity%3C%2Ftext%3E%3Ctext%20font-family%3D%22stix278c526c79a467f767590df7316%22%20font-size%3D%2218%22%20text-anchor%3D%22middle%22%20x%3D%22137.5%22%20y%3D%2231%22%3E%3D%3C%2Ftext%3E%3Cline%20stroke%3D%22%23000%22%20stroke-linecap%3D%22square%22%20stroke-width%3D%221%22%20x1%3D%22152.5%22%20x2%3D%22397.5%22%20y1%3D%2226.5%22%20y2%3D%2226.5%22%2F%3E%3Ctext%20font-family%3D%22stix278c526c79a467f767590df7316%22%20font-size%3D%2218%22%20text-anchor%3D%22middle%22%20x%3D%22204.5%22%20y%3D%2218%22%3EDisplacement%3C%2Ftext%3E%3Ctext%20font-family%3D%22stix278c526c79a467f767590df7316%22%20font-size%3D%2218%22%20text-anchor%3D%22middle%22%20x%3D%22276.5%22%20y%3D%2218%22%3Efrom%3C%2Ftext%3E%3Ctext%20font-family%3D%22stix278c526c79a467f767590df7316%22%20font-size%3D%2218%22%20text-anchor%3D%22middle%22%20x%3D%22326.5%22%20y%3D%2218%22%3Estarting%3C%2Ftext%3E%3Ctext%20font-family%3D%22stix278c526c79a467f767590df7316%22%20font-size%3D%2218%22%20text-anchor%3D%22middle%22%20x%3D%22376.5%22%20y%3D%2218%22%3Epoint%3C%2Ftext%3E%3Ctext%20font-family%3D%22stix278c526c79a467f767590df7316%22%20font-size%3D%2218%22%20text-anchor%3D%22middle%22%20x%3D%22253.5%22%20y%3D%2246%22%3ETime%3C%2Ftext%3E%3Ctext%20font-family%3D%22stix278c526c79a467f767590df7316%22%20font-size%3D%2218%22%20text-anchor%3D%22middle%22%20x%3D%22296.5%22%20y%3D%2246%22%3Etaken%3C%2Ftext%3E%3C%2Fsvg%3E)
The average velocity is a vector quantity and can be positive, zero or negative
Worked Example
An athlete is training by jogging in a straight line.
The displacement-time graph below shows the displacement of the athlete from her starting point throughout her motion.
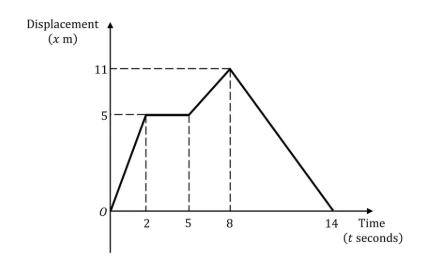
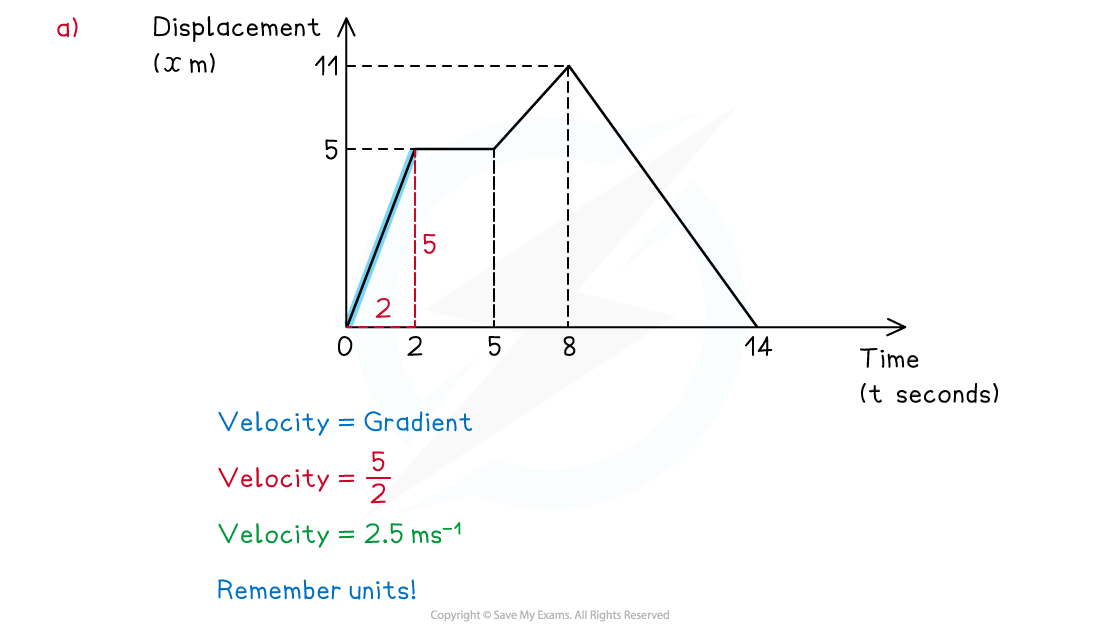
(a) Calculate the velocity of the athlete during the first 2 seconds.
(b) Describe the motion of the athlete between the times of 2 seconds and 5 seconds.

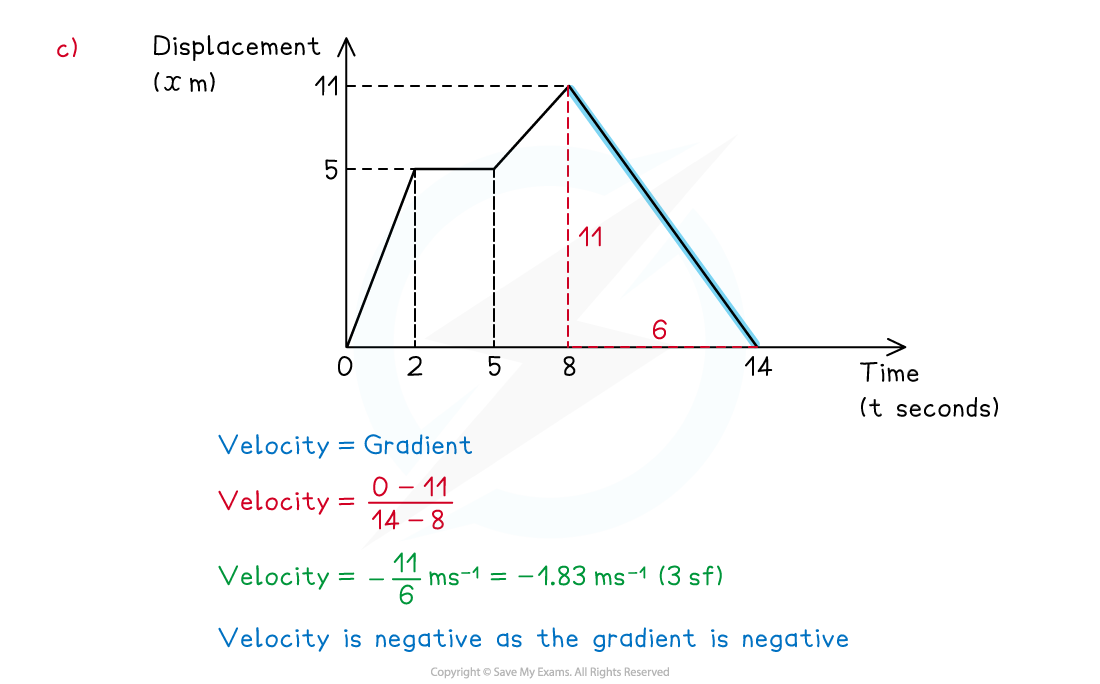
(c) Calculate the velocity of the athlete at 10 seconds.
(d) Find the total distanced travelled by the athlete during the 14 seconds.

Examiner Tips and Tricks
Be careful to spot if you are working with a displacement-time graph or a velocity-time graph.
Be careful to spot if you are working with a displacement-time graph or a distance-time graph
Check where the graph starts from on the y-axis, the object does not have to start at 0. For example, if the graph starts at 100, the scenario could be a student on a walk starting 100 m from their house.
Distance is a scalar so it can not be negative whereas displacement from a starting point can be.
Think about the units when calculating, make sure they are consistent.

Unlock more, it's free!
Did this page help you?