Types of Graphs (Edexcel GCSE Maths: Foundation): Revision Note
Exam code: 1MA1

Types of graphs
What graphs do I need to know?
You need to be able to recognise the following lines:
Straight lines
y = mx + c
Such as y = 3x + 2, y = 5x - 1, ...
Two important ones are y = x and y = -x
Horizontal lines
y = c
Such as y = 4, y = -10, ...
Vertical lines
x = k
Such as x = 2, x = -1, ...
You need to be able to recognise quadratic graphs
y = x2
y = -x2
y = ax2 + bx + c
You need to be able to recognise simple cubic graphs
y = x3
y = -x3
y = ax3 + bx2 + x + c
You also need to be able to recognise reciprocal graphs
format('truetype')%3Bfont-weight%3Anormal%3Bfont-style%3Anormal%3B%7D%3C%2Fstyle%3E%3C%2Fdefs%3E%3Ctext%20font-family%3D%22Times%20New%20Roman%22%20font-size%3D%2218%22%20font-style%3D%22italic%22%20text-anchor%3D%22middle%22%20x%3D%224.5%22%20y%3D%2230%22%3Ey%3C%2Ftext%3E%3Ctext%20font-family%3D%22math17f39f8317fbdb1988ef4c628eb%22%20font-size%3D%2216%22%20text-anchor%3D%22middle%22%20x%3D%2218.5%22%20y%3D%2230%22%3E%3D%3C%2Ftext%3E%3Cline%20stroke%3D%22%23000%22%20stroke-linecap%3D%22square%22%20stroke-width%3D%221%22%20x1%3D%2229.5%22%20x2%3D%2242.5%22%20y1%3D%2223.5%22%20y2%3D%2223.5%22%2F%3E%3Ctext%20font-family%3D%22Times%20New%20Roman%22%20font-size%3D%2218%22%20text-anchor%3D%22middle%22%20x%3D%2236.5%22%20y%3D%2216%22%3E1%3C%2Ftext%3E%3Ctext%20font-family%3D%22Times%20New%20Roman%22%20font-size%3D%2218%22%20font-style%3D%22italic%22%20text-anchor%3D%22middle%22%20x%3D%2235.5%22%20y%3D%2241%22%3Ex%3C%2Ftext%3E%3C%2Fsvg%3E) , where
, where format('truetype')%3Bfont-weight%3Anormal%3Bfont-style%3Anormal%3B%7D%3C%2Fstyle%3E%3C%2Fdefs%3E%3Ctext%20font-family%3D%22Times%20New%20Roman%22%20font-size%3D%2218%22%20font-style%3D%22italic%22%20text-anchor%3D%22middle%22%20x%3D%224.5%22%20y%3D%2216%22%3Ex%3C%2Ftext%3E%3Ctext%20font-family%3D%22math17ac52e3f2729d1b3f6d2b7e8f6%22%20font-size%3D%2216%22%20text-anchor%3D%22middle%22%20x%3D%2218.5%22%20y%3D%2216%22%3E%26%23x2260%3B%3C%2Ftext%3E%3Ctext%20font-family%3D%22Times%20New%20Roman%22%20font-size%3D%2218%22%20text-anchor%3D%22middle%22%20x%3D%2231.5%22%20y%3D%2216%22%3E0%3C%2Ftext%3E%3C%2Fsvg%3E)

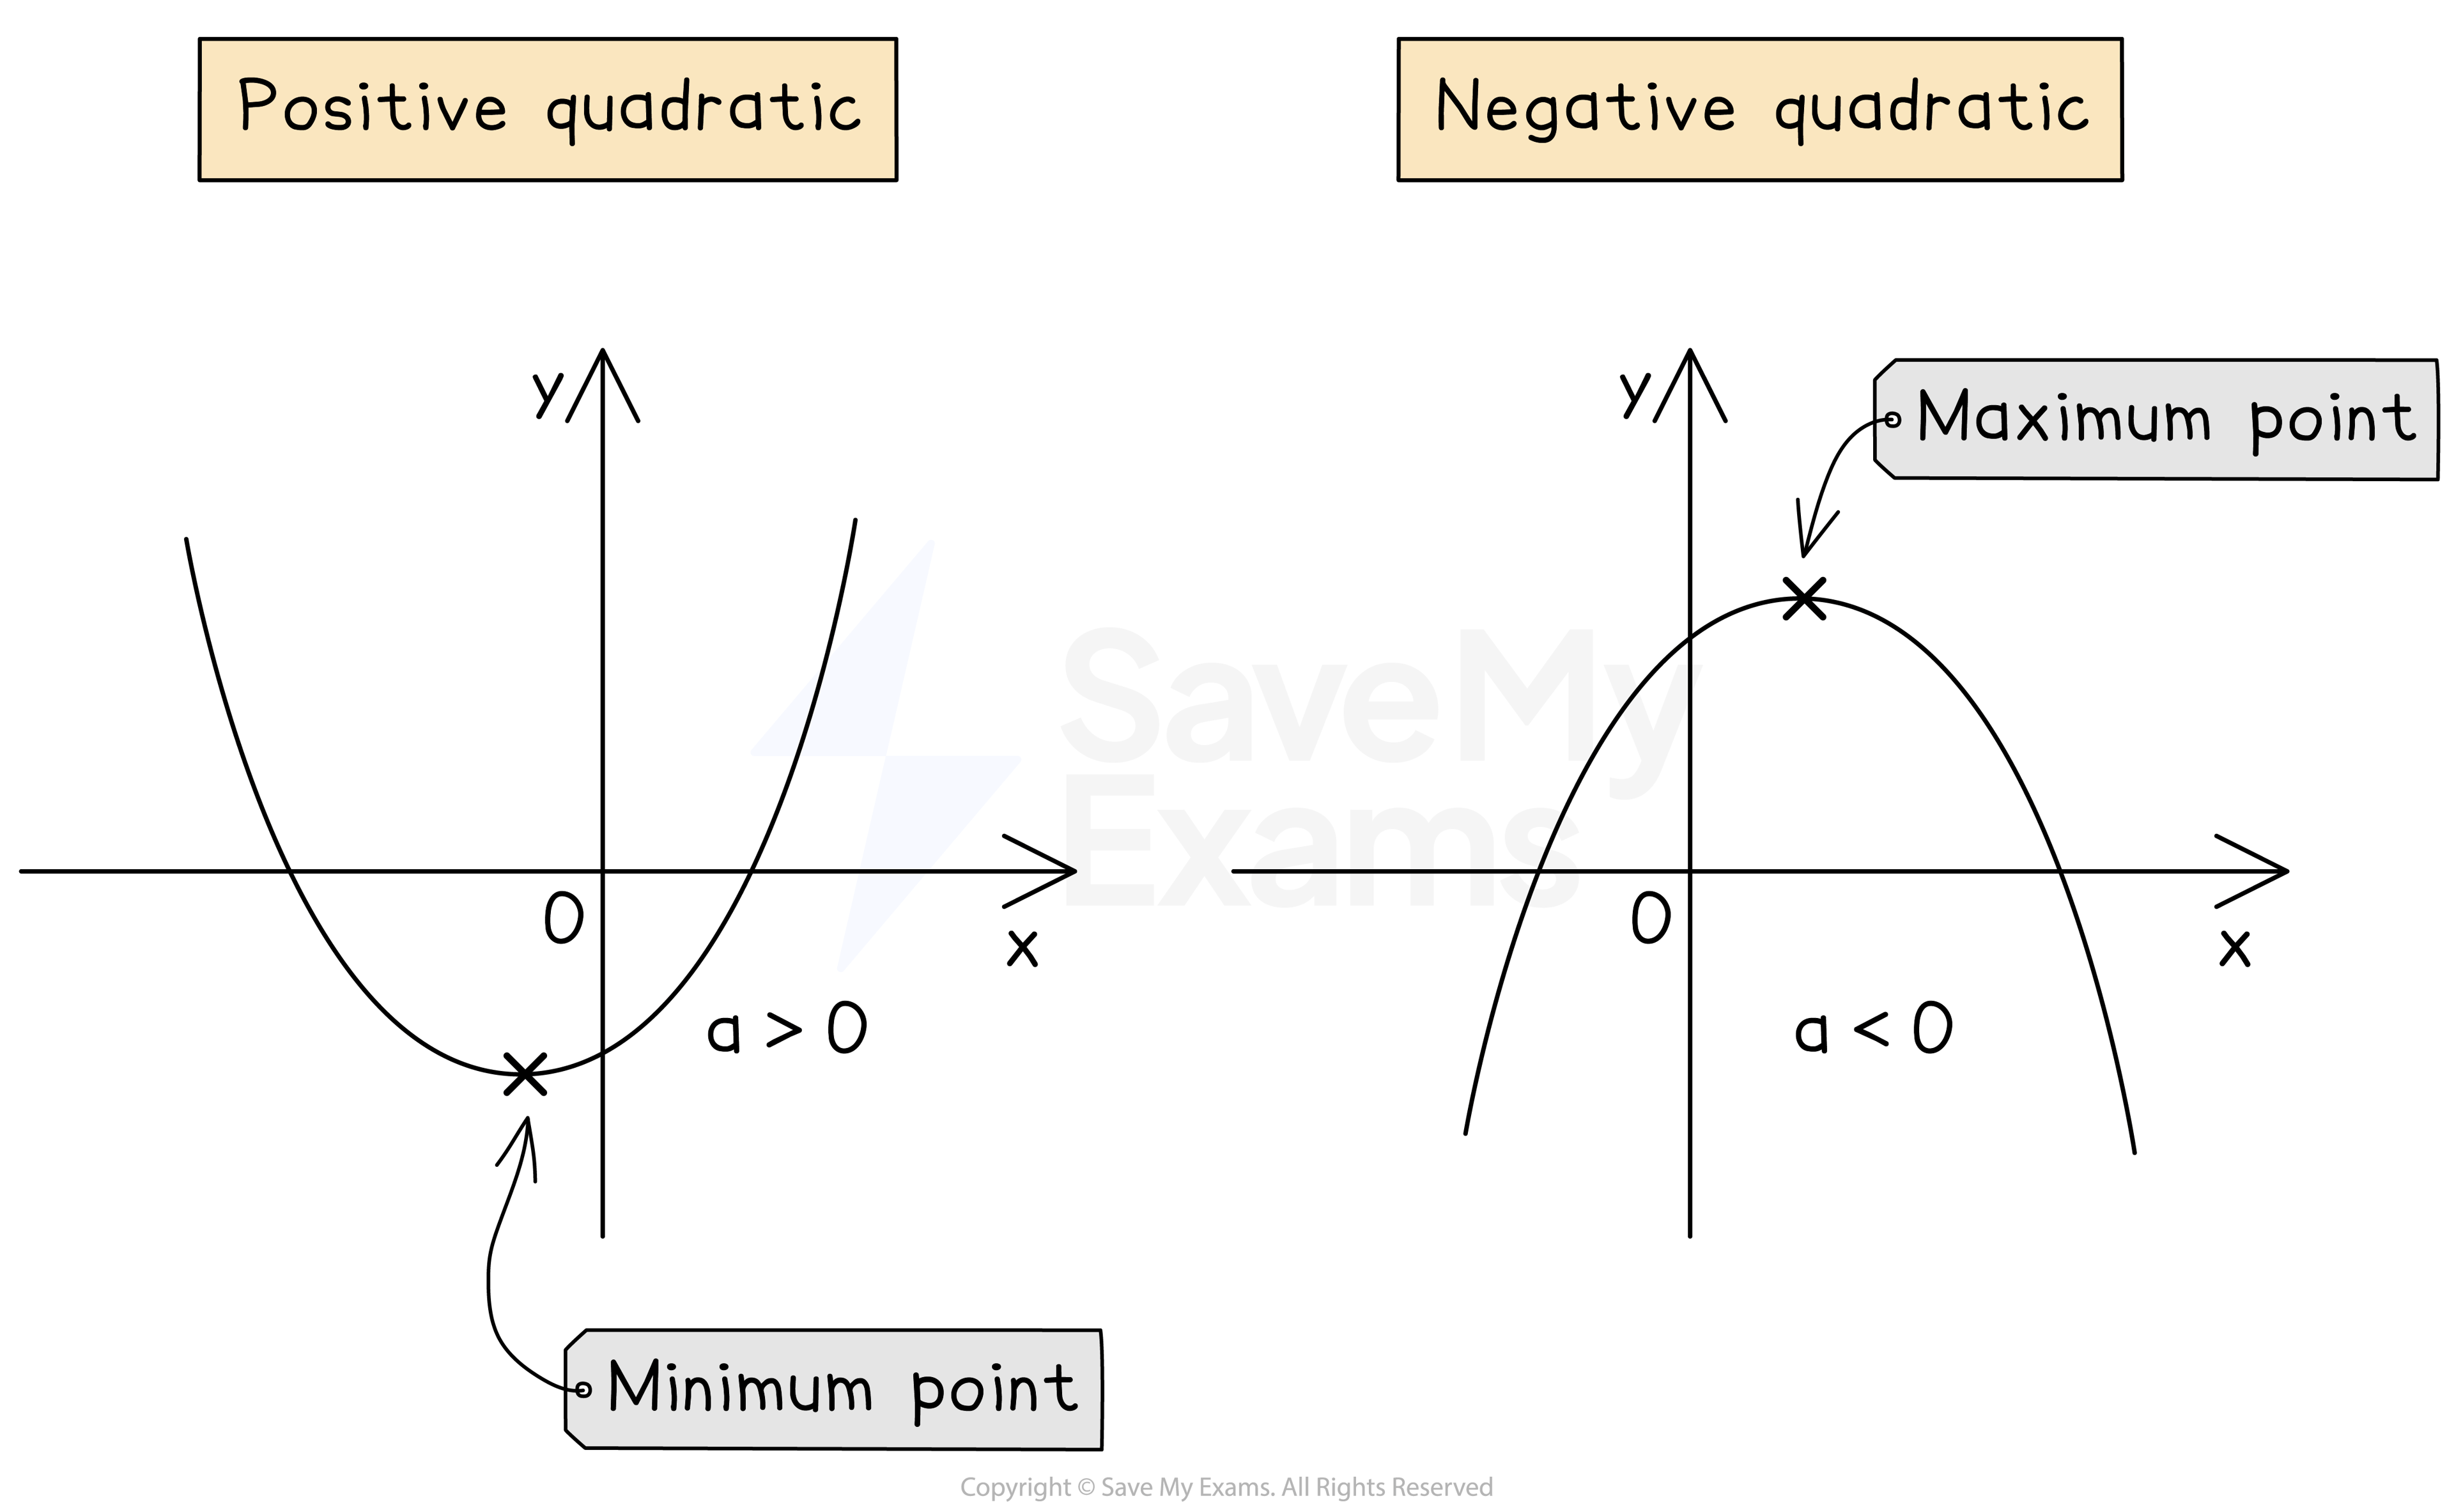
What does a quadratic graph look like?
The equation of a quadratic graph is y = ax2 + bx + c
A quadratic graph has either a u-shape or an n-shape
This type of shape is called a parabola
u-shapes are called positive quadratics
because the number in front of x2 is positive
For example, y = 2x2 + 3x + 4
n-shapes are called negative quadratics
because the number in front of x2 is negative
For example, y = -3x2 + 2x + 4
You can plot quadratic graphs using a table of values
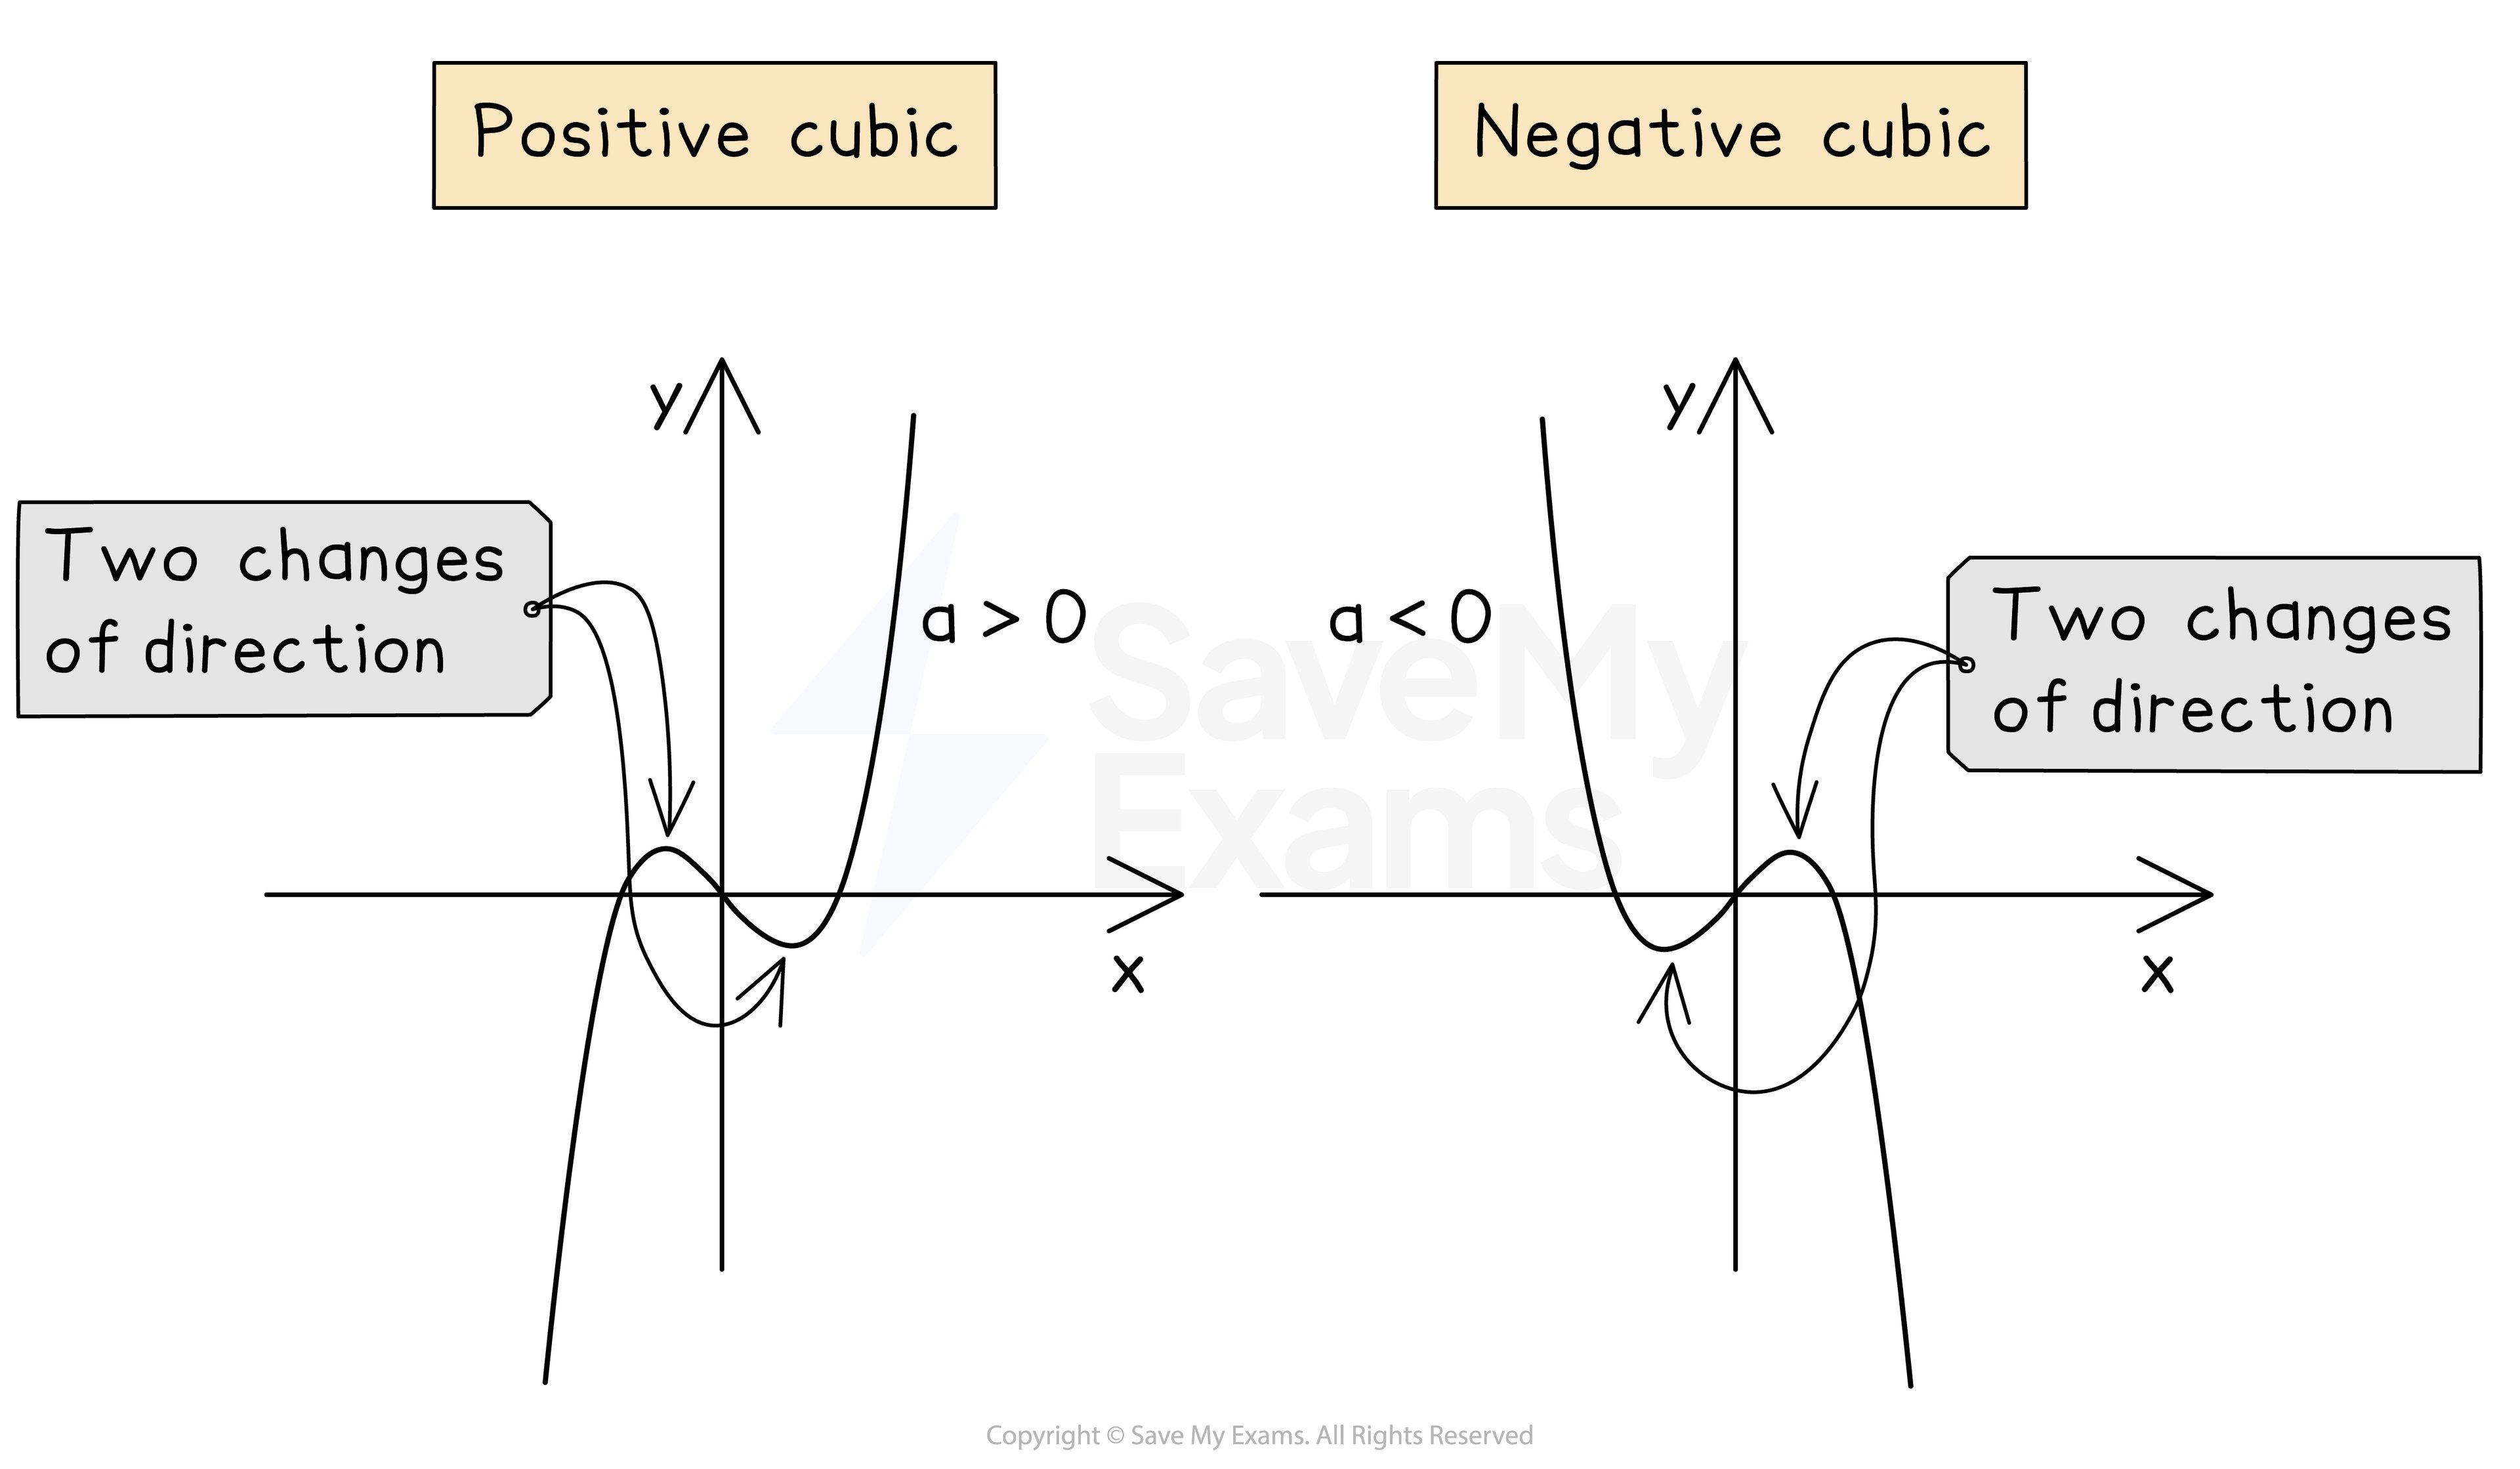
What does a cubic graph look like?
The equation of a cubic graph is y = ax3 + bx2 + cx + d
A cubic graph can have two points where it changes direction (turning points)
A positive cubic goes uphill (from the bottom left to the top right)
The number in front of x3 is positive
For example, y = x3 - 3x2 + 2x + 1
A negative cubic goes downhill (from the top left to the bottom right)
The number in front of x3 is negative
For example, y = -x3 + 2x2 - x + 5
You can plot cubic graphs using a table of values
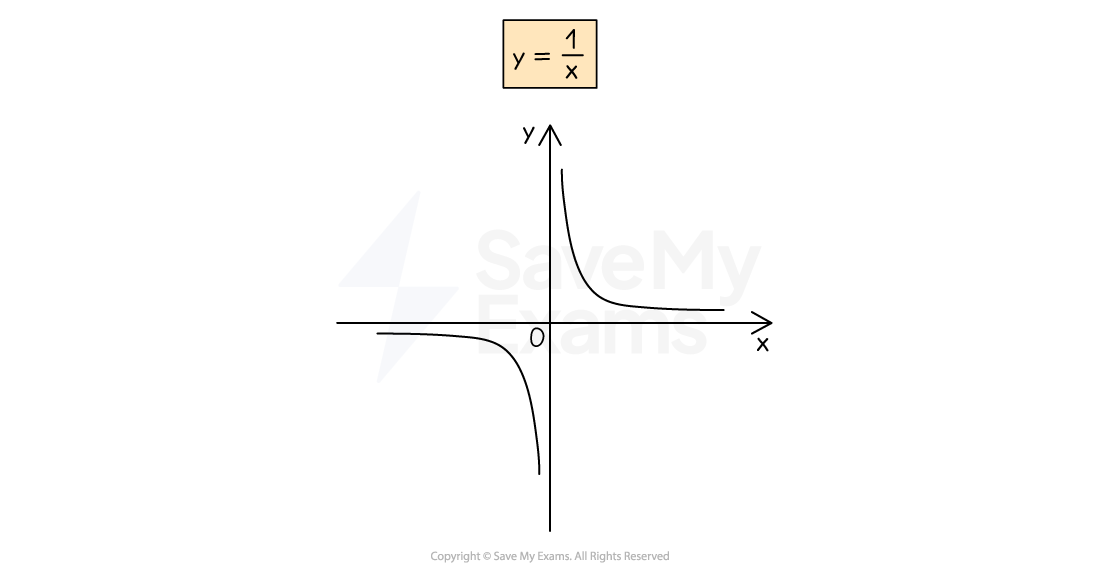
What does a reciprocal graph look like?
The equation of the basic reciprocal graph is
You cannot substitute in x = 0 (division by zero is not allowed)
You should not include x = 0 in a table of values
The shape of
is shown belowIt has two curved branches
The branches never connect!
Worked Example
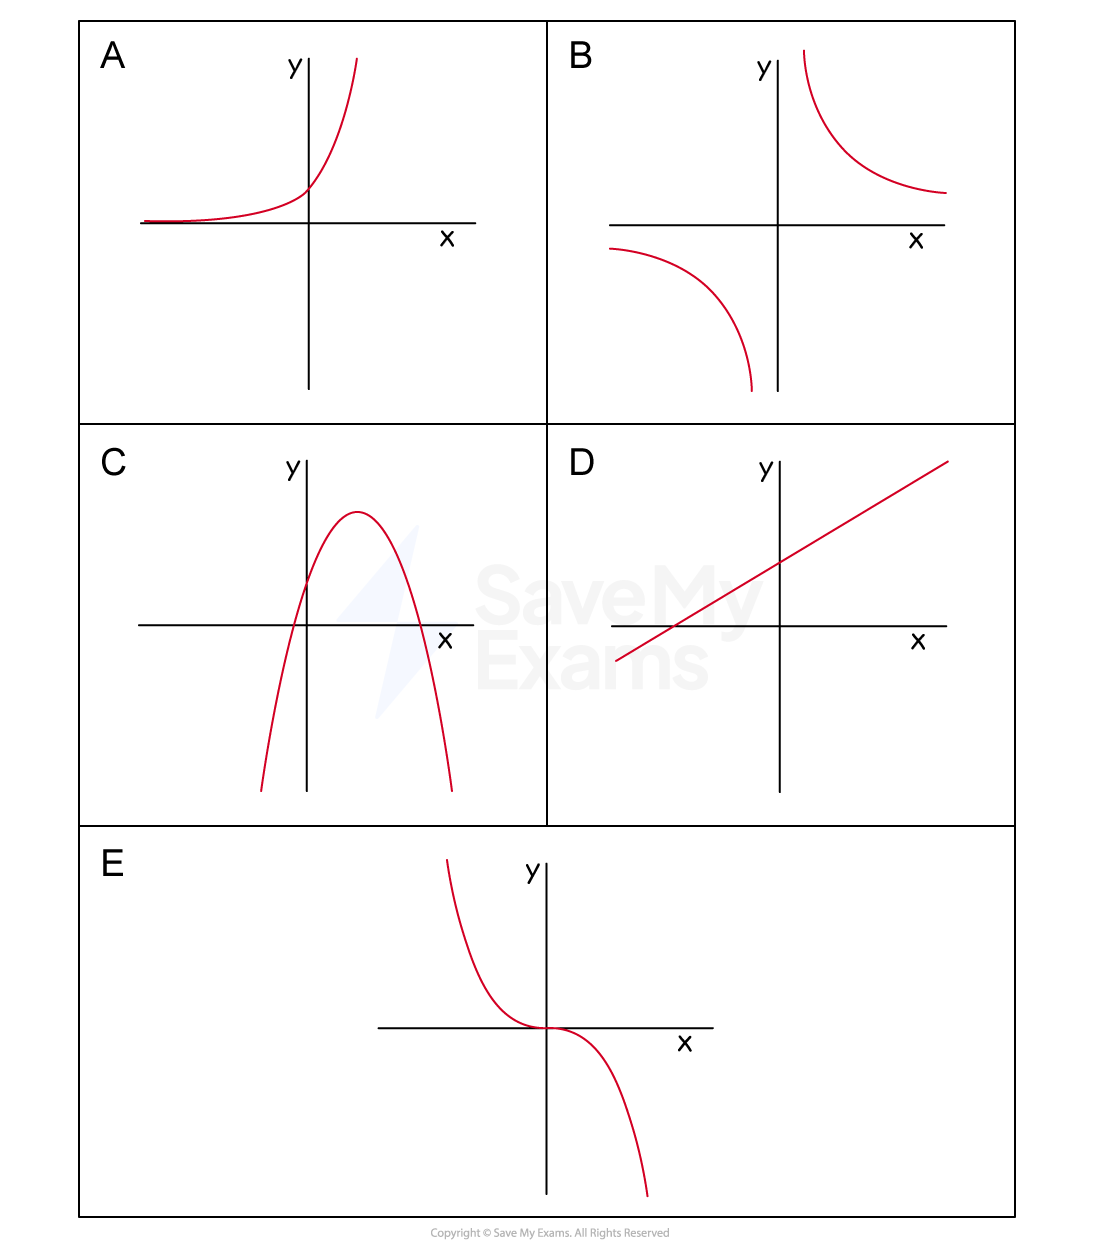
In each of the cases below, state the letter of the graph that corresponds to the equation given.
(a) ![]()
Answer:
This is a straight-line graph, y = mx + c
The graph is a straight line going uphill and crosses the x-axis above (0,0)
Graph D
(b) ![]()
Answer:
This is a quadratic graph, y = ax2 + bx + c (a = -1, b = 3, c = 2)
The number in front of x2 is negative so it has an n-shape
Graph C
(c)![]()
![]()
Answer:
This is the reciprocal graph, ![]()
It has two curved shaped branches and no y-value when x = 0
Graph B

Unlock more, it's free!
Join the 100,000+ Students that ❤️ Save My Exams
the (exam) results speak for themselves:

Was this revision note helpful?
