Properties of Logarithmic & Logistic Functions & Graphs (DP IB Applications & Interpretation (AI)): Revision Note

Did this video help you?
Logarithmic functions & graphs
What are the key features of logarithmic graphs?
A logarithmic function is of the form
%3C%2Fmo%3E%3Cmo%3E%3D%3C%2Fmo%3E%3Cmi%3Ea%3C%2Fmi%3E%3Cmo%3E%2B%3C%2Fmo%3E%3Cmi%3Eb%3C%2Fmi%3E%3Cmo%3E%26%23xA0%3B%3C%2Fmo%3E%3Cmi%3Eln%3C%2Fmi%3E%3Cmo%3E%26%23xA0%3B%3C%2Fmo%3E%3Cmi%3Ex%3C%2Fmi%3E%3Cmo%3E%2C%3C%2Fmo%3E%3Cmo%3E%26%23xA0%3B%3C%2Fmo%3E%3Cmi%3Ex%3C%2Fmi%3E%3Cmo%3E%26gt%3B%3C%2Fmo%3E%3Cmn%3E0%3C%2Fmn%3E%3C%2Fmath%3E--%3E%3Cdefs%3E%3Cstyle%20type%3D%22text%2Fcss%22%3E%40font-face%7Bfont-family%3A'math1d674f36e211f61d545f909fac4'%3Bsrc%3Aurl(data%3Afont%2Ftruetype%3Bcharset%3Dutf-8%3Bbase64%2CAAEAAAAMAIAAAwBAT1MvMi7iBBMAAADMAAAATmNtYXDEvmKUAAABHAAAAExjdnQgDVUNBwAAAWgAAAA6Z2x5ZoPi2VsAAAGkAAAB%2B2hlYWQQC2qxAAADoAAAADZoaGVhCGsXSAAAA9gAAAAkaG10eE2rRkcAAAP8AAAAFGxvY2EAHTwYAAAEEAAAABhtYXhwBT0FPgAABCgAAAAgbmFtZaBxlY4AAARIAAABn3Bvc3QB9wD6AAAF6AAAACBwcmVwa1uragAABggAAAAUAAADSwGQAAUAAAQABAAAAAAABAAEAAAAAAAAAQEAAAAAAAAAAAAAAAAAAAAAAAAAAAAAAAAAAAAAACAgICAAAAAg1UADev96AAAD6ACWAAAAAAACAAEAAQAAABQAAwABAAAAFAAEADgAAAAKAAgAAgACACsALAA9AD7%2F%2FwAAACsALAA9AD7%2F%2F%2F%2FW%2F9b%2Fxv%2FGAAEAAAAAAAAAAAAAAAABVAMsAIABAABWACoCWAIeAQ4BLAIsAFoBgAKAAKAA1ACAAAAAAAAAACsAVQCAAKsA1QEAASsABwAAAAIAVQAAAwADqwADAAcAADMRIRElIREhVQKr%2FasCAP4AA6v8VVUDAAABAIAAVQLVAqsACwBJARiyDAEBFBMQsQAD9rEBBPWwCjyxAwX1sAg8sQUE9bAGPLENA%2BYAsQAAExCxAQbksQEBExCwBTyxAwTlsQsF9bAHPLEJBOUxMBMhETMRIRUhESMRIYABAFUBAP8AVf8AAasBAP8AVv8AAQAAAQBV%2F2QA1QCAAAoAADM1MxUUBgcnPgE3VYAvLxseHgGAej1RFCkONDEAAgCAAOsC1QIVAAMABwBlGAGwCBCwBtSwBhCwBdSwCBCwAdSwARCwANSwBhCwBzywBRCwBDywARCwAjywABCwAzwAsAgQsAbUsAYQsAfUsAcQsAHUsAEQsALUsAYQsAU8sAcQsAQ8sAEQsAA8sAIQsAM8MTATITUhHQEhNYACVf2rAlUBwFXVVVUAAgCAAFUCgQKrAAUACwBsGLBBGgCxAAATELEABuSxAAETELAJPLEBBfWwCjywABCxBQP1sQIF7bEEA%2FWxAwXtsAoQsQsD9bEIBe2xBgP1sQcF7QGwDBCxBAP2sgcGAzw8PLEFBPWyAggLPDw8sQAE9bIJCgE8PDyxDQPmARUNATUlATUNARUlAoD%2FAP8AAQD%2FAAEAAQH%2B%2FwGrVoCAVoABKlaAgFaAAAABAAAAAQAA1XjOQV8PPPUAAwQA%2F%2F%2F%2F%2F9Y6E3P%2F%2F%2F%2F%2F1joTcwAA%2FyAEgAOrAAAACgACAAEAAAAAAAEAAAPo%2F2oAABdwAAD%2FtgSAAAEAAAAAAAAAAAAAAAAAAAAFA1IAVQNWAIABMwBVA1YAgAMAAIAAAAAAAAAAKAAAAKEAAADLAAABVQAAAfsAAQAAAAUAXgAFAAAAAAACAIAEAAAAAAAEAADeAAAAAAAAABUBAgAAAAAAAAABABIAAAAAAAAAAAACAA4AEgAAAAAAAAADADAAIAAAAAAAAAAEABIAUAAAAAAAAAAFABYAYgAAAAAAAAAGAAkAeAAAAAAAAAAIABwAgQABAAAAAAABABIAAAABAAAAAAACAA4AEgABAAAAAAADADAAIAABAAAAAAAEABIAUAABAAAAAAAFABYAYgABAAAAAAAGAAkAeAABAAAAAAAIABwAgQADAAEECQABABIAAAADAAEECQACAA4AEgADAAEECQADADAAIAADAAEECQAEABIAUAADAAEECQAFABYAYgADAAEECQAGAAkAeAADAAEECQAIABwAgQBNAGEAdABoACAARgBvAG4AdABSAGUAZwB1AGwAYQByAE0AYQB0AGgAcwAgAEYAbwByACAATQBvAHIAZQAgAE0AYQB0AGgAIABGAG8AbgB0AE0AYQB0AGgAIABGAG8AbgB0AFYAZQByAHMAaQBvAG4AIAAxAC4AME1hdGhfRm9udABNAGEAdABoAHMAIABGAG8AcgAgAE0AbwByAGUAAAMAAAAAAAAB9AD6AAAAAAAAAAAAAAAAAAAAAAAAAAC5BxEAAI2FGACyAAAAFRQTsQABPw%3D%3D)format('truetype')%3Bfont-weight%3Anormal%3Bfont-style%3Anormal%3B%7D%40font-face%7Bfont-family%3A'round_brackets18549f92a457f2409'%3Bsrc%3Aurl(data%3Afont%2Ftruetype%3Bcharset%3Dutf-8%3Bbase64%2CAAEAAAAMAIAAAwBAT1MvMjwHLFQAAADMAAAATmNtYXDf7xCrAAABHAAAADxjdnQgBAkDLgAAAVgAAAASZ2x5ZmAOz2cAAAFsAAABJGhlYWQOKih8AAACkAAAADZoaGVhCvgVwgAAAsgAAAAkaG10eCA6AAIAAALsAAAADGxvY2EAAARLAAAC%2BAAAABBtYXhwBIgEWQAAAwgAAAAgbmFtZXHR30MAAAMoAAACOXBvc3QDogHPAAAFZAAAACBwcmVwupWEAAAABYQAAAAHAAAGcgGQAAUAAAgACAAAAAAACAAIAAAAAAAAAQIAAAAAAAAAAAAAAAAAAAAAAAAAAAAAAAAAAAAAACAgICAAAAAo8AMGe%2F57AAAHPgGyAAAAAAACAAEAAQAAABQAAwABAAAAFAAEACgAAAAGAAQAAQACACgAKf%2F%2FAAAAKAAp%2F%2F%2F%2F2f%2FZAAEAAAAAAAAAAAFUAFYBAAAsAKgDgAAyAAcAAAACAAAAKgDVA1UAAwAHAAA1MxEjEyMRM9XVq4CAKgMr%2FQAC1QABAAD%2B0AIgBtAACQBNGAGwChCwA9SwAxCwAtSwChCwBdSwBRCwANSwAxCwBzywAhCwCDwAsAoQsAPUsAMQsAfUsAoQsAXUsAoQsADUsAMQsAI8sAcQsAg8MTAREAEzABEQASMAAZCQ%2FnABkJD%2BcALQ%2FZD%2BcAGQAnACcAGQ%2FnAAAQAA%2FtACIAbQAAkATRgBsAoQsAPUsAMQsALUsAoQsAXUsAUQsADUsAMQsAc8sAIQsAg8ALAKELAD1LADELAH1LAKELAF1LAKELAA1LADELACPLAHELAIPDEwARABIwAREAEzAAIg%2FnCQAZD%2BcJABkALQ%2FZD%2BcAGQAnACcAGQ%2FnAAAQAAAAEAAPW2NYFfDzz1AAMIAP%2F%2F%2F%2F%2FVre7u%2F%2F%2F%2F%2F9Wt7u4AAP7QA7cG0AAAAAoAAgABAAAAAAABAAAHPv5OAAAXcAAA%2F%2F4DtwABAAAAAAAAAAAAAAAAAAAAAwDVAAACIAAAAiAAAAAAAAAAAAAkAAAAowAAASQAAQAAAAMACgACAAAAAAACAIAEAAAAAAAEAABNAAAAAAAAABUBAgAAAAAAAAABAD4AAAAAAAAAAAACAA4APgAAAAAAAAADAFwATAAAAAAAAAAEAD4AqAAAAAAAAAAFABYA5gAAAAAAAAAGAB8A%2FAAAAAAAAAAIABwBGwABAAAAAAABAD4AAAABAAAAAAACAA4APgABAAAAAAADAFwATAABAAAAAAAEAD4AqAABAAAAAAAFABYA5gABAAAAAAAGAB8A%2FAABAAAAAAAIABwBGwADAAEECQABAD4AAAADAAEECQACAA4APgADAAEECQADAFwATAADAAEECQAEAD4AqAADAAEECQAFABYA5gADAAEECQAGAB8A%2FAADAAEECQAIABwBGwBSAG8AdQBuAGQAIABiAHIAYQBjAGsAZQB0AHMAIAB3AGkAdABoACAAYQBzAGMAZQBuAHQAIAAxADgANQA0AFIAZQBnAHUAbABhAHIATQBhAHQAaABzACAARgBvAHIAIABNAG8AcgBlACAAUgBvAHUAbgBkACAAYgByAGEAYwBrAGUAdABzACAAdwBpAHQAaAAgAGEAcwBjAGUAbgB0ACAAMQA4ADUANABSAG8AdQBuAGQAIABiAHIAYQBjAGsAZQB0AHMAIAB3AGkAdABoACAAYQBzAGMAZQBuAHQAIAAxADgANQA0AFYAZQByAHMAaQBvAG4AIAAyAC4AMFJvdW5kX2JyYWNrZXRzX3dpdGhfYXNjZW50XzE4NTQATQBhAHQAaABzACAARgBvAHIAIABNAG8AcgBlAAAAAAMAAAAAAAADnwHPAAAAAAAAAAAAAAAAAAAAAAAAAAC5B%2F8AAY2FAA%3D%3D)format('truetype')%3Bfont-weight%3Anormal%3Bfont-style%3Anormal%3B%7D%3C%2Fstyle%3E%3C%2Fdefs%3E%3Ctext%20font-family%3D%22Times%20New%20Roman%22%20font-size%3D%2218%22%20font-style%3D%22italic%22%20text-anchor%3D%22middle%22%20x%3D%227.5%22%20y%3D%2216%22%3Ef%3C%2Ftext%3E%3Ctext%20font-family%3D%22round_brackets18549f92a457f2409%22%20font-size%3D%2218%22%20text-anchor%3D%22middle%22%20x%3D%2216.5%22%20y%3D%2216%22%3E(%3C%2Ftext%3E%3Ctext%20font-family%3D%22Times%20New%20Roman%22%20font-size%3D%2218%22%20font-style%3D%22italic%22%20text-anchor%3D%22middle%22%20x%3D%2223.5%22%20y%3D%2216%22%3Ex%3C%2Ftext%3E%3Ctext%20font-family%3D%22round_brackets18549f92a457f2409%22%20font-size%3D%2218%22%20text-anchor%3D%22middle%22%20x%3D%2231.5%22%20y%3D%2216%22%3E)%3C%2Ftext%3E%3Ctext%20font-family%3D%22math1d674f36e211f61d545f909fac4%22%20font-size%3D%2216%22%20text-anchor%3D%22middle%22%20x%3D%2243.5%22%20y%3D%2216%22%3E%3D%3C%2Ftext%3E%3Ctext%20font-family%3D%22Times%20New%20Roman%22%20font-size%3D%2218%22%20font-style%3D%22italic%22%20text-anchor%3D%22middle%22%20x%3D%2256.5%22%20y%3D%2216%22%3Ea%3C%2Ftext%3E%3Ctext%20font-family%3D%22math1d674f36e211f61d545f909fac4%22%20font-size%3D%2216%22%20text-anchor%3D%22middle%22%20x%3D%2269.5%22%20y%3D%2216%22%3E%2B%3C%2Ftext%3E%3Ctext%20font-family%3D%22Times%20New%20Roman%22%20font-size%3D%2218%22%20font-style%3D%22italic%22%20text-anchor%3D%22middle%22%20x%3D%2282.5%22%20y%3D%2216%22%3Eb%3C%2Ftext%3E%3Ctext%20font-family%3D%22Times%20New%20Roman%22%20font-size%3D%2218%22%20text-anchor%3D%22middle%22%20x%3D%2299.5%22%20y%3D%2216%22%3Eln%3C%2Ftext%3E%3Ctext%20font-family%3D%22Times%20New%20Roman%22%20font-size%3D%2218%22%20font-style%3D%22italic%22%20text-anchor%3D%22middle%22%20x%3D%22114.5%22%20y%3D%2216%22%3Ex%3C%2Ftext%3E%3Ctext%20font-family%3D%22math1d674f36e211f61d545f909fac4%22%20font-size%3D%2216%22%20text-anchor%3D%22middle%22%20x%3D%22122.5%22%20y%3D%2216%22%3E%2C%3C%2Ftext%3E%3Ctext%20font-family%3D%22Times%20New%20Roman%22%20font-size%3D%2218%22%20font-style%3D%22italic%22%20text-anchor%3D%22middle%22%20x%3D%22133.5%22%20y%3D%2216%22%3Ex%3C%2Ftext%3E%3Ctext%20font-family%3D%22math1d674f36e211f61d545f909fac4%22%20font-size%3D%2216%22%20text-anchor%3D%22middle%22%20x%3D%22147.5%22%20y%3D%2216%22%3E%26gt%3B%3C%2Ftext%3E%3Ctext%20font-family%3D%22Times%20New%20Roman%22%20font-size%3D%2218%22%20text-anchor%3D%22middle%22%20x%3D%22159.5%22%20y%3D%2216%22%3E0%3C%2Ftext%3E%3C%2Fsvg%3E)
Remember the natural logarithmic function
format('truetype')%3Bfont-weight%3Anormal%3Bfont-style%3Anormal%3B%7D%40font-face%7Bfont-family%3A'round_brackets18549f92a457f2409'%3Bsrc%3Aurl(data%3Afont%2Ftruetype%3Bcharset%3Dutf-8%3Bbase64%2CAAEAAAAMAIAAAwBAT1MvMjwHLFQAAADMAAAATmNtYXDf7xCrAAABHAAAADxjdnQgBAkDLgAAAVgAAAASZ2x5ZmAOz2cAAAFsAAABJGhlYWQOKih8AAACkAAAADZoaGVhCvgVwgAAAsgAAAAkaG10eCA6AAIAAALsAAAADGxvY2EAAARLAAAC%2BAAAABBtYXhwBIgEWQAAAwgAAAAgbmFtZXHR30MAAAMoAAACOXBvc3QDogHPAAAFZAAAACBwcmVwupWEAAAABYQAAAAHAAAGcgGQAAUAAAgACAAAAAAACAAIAAAAAAAAAQIAAAAAAAAAAAAAAAAAAAAAAAAAAAAAAAAAAAAAACAgICAAAAAo8AMGe%2F57AAAHPgGyAAAAAAACAAEAAQAAABQAAwABAAAAFAAEACgAAAAGAAQAAQACACgAKf%2F%2FAAAAKAAp%2F%2F%2F%2F2f%2FZAAEAAAAAAAAAAAFUAFYBAAAsAKgDgAAyAAcAAAACAAAAKgDVA1UAAwAHAAA1MxEjEyMRM9XVq4CAKgMr%2FQAC1QABAAD%2B0AIgBtAACQBNGAGwChCwA9SwAxCwAtSwChCwBdSwBRCwANSwAxCwBzywAhCwCDwAsAoQsAPUsAMQsAfUsAoQsAXUsAoQsADUsAMQsAI8sAcQsAg8MTAREAEzABEQASMAAZCQ%2FnABkJD%2BcALQ%2FZD%2BcAGQAnACcAGQ%2FnAAAQAA%2FtACIAbQAAkATRgBsAoQsAPUsAMQsALUsAoQsAXUsAUQsADUsAMQsAc8sAIQsAg8ALAKELAD1LADELAH1LAKELAF1LAKELAA1LADELACPLAHELAIPDEwARABIwAREAEzAAIg%2FnCQAZD%2BcJABkALQ%2FZD%2BcAGQAnACcAGQ%2FnAAAQAAAAEAAPW2NYFfDzz1AAMIAP%2F%2F%2F%2F%2FVre7u%2F%2F%2F%2F%2F9Wt7u4AAP7QA7cG0AAAAAoAAgABAAAAAAABAAAHPv5OAAAXcAAA%2F%2F4DtwABAAAAAAAAAAAAAAAAAAAAAwDVAAACIAAAAiAAAAAAAAAAAAAkAAAAowAAASQAAQAAAAMACgACAAAAAAACAIAEAAAAAAAEAABNAAAAAAAAABUBAgAAAAAAAAABAD4AAAAAAAAAAAACAA4APgAAAAAAAAADAFwATAAAAAAAAAAEAD4AqAAAAAAAAAAFABYA5gAAAAAAAAAGAB8A%2FAAAAAAAAAAIABwBGwABAAAAAAABAD4AAAABAAAAAAACAA4APgABAAAAAAADAFwATAABAAAAAAAEAD4AqAABAAAAAAAFABYA5gABAAAAAAAGAB8A%2FAABAAAAAAAIABwBGwADAAEECQABAD4AAAADAAEECQACAA4APgADAAEECQADAFwATAADAAEECQAEAD4AqAADAAEECQAFABYA5gADAAEECQAGAB8A%2FAADAAEECQAIABwBGwBSAG8AdQBuAGQAIABiAHIAYQBjAGsAZQB0AHMAIAB3AGkAdABoACAAYQBzAGMAZQBuAHQAIAAxADgANQA0AFIAZQBnAHUAbABhAHIATQBhAHQAaABzACAARgBvAHIAIABNAG8AcgBlACAAUgBvAHUAbgBkACAAYgByAGEAYwBrAGUAdABzACAAdwBpAHQAaAAgAGEAcwBjAGUAbgB0ACAAMQA4ADUANABSAG8AdQBuAGQAIABiAHIAYQBjAGsAZQB0AHMAIAB3AGkAdABoACAAYQBzAGMAZQBuAHQAIAAxADgANQA0AFYAZQByAHMAaQBvAG4AIAAyAC4AMFJvdW5kX2JyYWNrZXRzX3dpdGhfYXNjZW50XzE4NTQATQBhAHQAaABzACAARgBvAHIAIABNAG8AcgBlAAAAAAMAAAAAAAADnwHPAAAAAAAAAAAAAAAAAAAAAAAAAAC5B%2F8AAY2FAA%3D%3D)format('truetype')%3Bfont-weight%3Anormal%3Bfont-style%3Anormal%3B%7D%3C%2Fstyle%3E%3C%2Fdefs%3E%3Ctext%20font-family%3D%22Times%20New%20Roman%22%20font-size%3D%2218%22%20text-anchor%3D%22middle%22%20x%3D%227.5%22%20y%3D%2216%22%3Eln%3C%2Ftext%3E%3Ctext%20font-family%3D%22Times%20New%20Roman%22%20font-size%3D%2218%22%20font-style%3D%22italic%22%20text-anchor%3D%22middle%22%20x%3D%2218.5%22%20y%3D%2216%22%3Ex%3C%2Ftext%3E%3Ctext%20font-family%3D%22math197ea3cfb64eeaa1edba65501d0%22%20font-size%3D%2216%22%20text-anchor%3D%22middle%22%20x%3D%2232.5%22%20y%3D%2216%22%3E%26%23x2261%3B%3C%2Ftext%3E%3Ctext%20font-family%3D%22Times%20New%20Roman%22%20font-size%3D%2218%22%20text-anchor%3D%22middle%22%20x%3D%2252.5%22%20y%3D%2216%22%3Elog%3C%2Ftext%3E%3Ctext%20font-family%3D%22Times%20New%20Roman%22%20font-size%3D%2213%22%20text-anchor%3D%22middle%22%20x%3D%2267.5%22%20y%3D%2224%22%3Ee%3C%2Ftext%3E%3Ctext%20font-family%3D%22round_brackets18549f92a457f2409%22%20font-size%3D%2218%22%20text-anchor%3D%22middle%22%20x%3D%2273.5%22%20y%3D%2216%22%3E(%3C%2Ftext%3E%3Ctext%20font-family%3D%22round_brackets18549f92a457f2409%22%20font-size%3D%2218%22%20text-anchor%3D%22middle%22%20x%3D%2288.5%22%20y%3D%2216%22%3E)%3C%2Ftext%3E%3Ctext%20font-family%3D%22Times%20New%20Roman%22%20font-size%3D%2218%22%20font-style%3D%22italic%22%20text-anchor%3D%22middle%22%20x%3D%2280.5%22%20y%3D%2216%22%3Ex%3C%2Ftext%3E%3C%2Fsvg%3E)
This is the inverse of
%3C%2Fmo%3E%3Cmo%3E%3D%3C%2Fmo%3E%3Cmsup%3E%3Cmi%20mathvariant%3D%22normal%22%3Ee%3C%2Fmi%3E%3Cmi%3Ex%3C%2Fmi%3E%3C%2Fmsup%3E%3C%2Fmath%3E--%3E%3Cdefs%3E%3Cstyle%20type%3D%22text%2Fcss%22%3E%40font-face%7Bfont-family%3A'math17f39f8317fbdb1988ef4c628eb'%3Bsrc%3Aurl(data%3Afont%2Ftruetype%3Bcharset%3Dutf-8%3Bbase64%2CAAEAAAAMAIAAAwBAT1MvMi7iBBMAAADMAAAATmNtYXDEvmKUAAABHAAAADRjdnQgDVUNBwAAAVAAAAA6Z2x5ZoPi2VsAAAGMAAAAsmhlYWQQC2qxAAACQAAAADZoaGVhCGsXSAAAAngAAAAkaG10eE2rRkcAAAKcAAAACGxvY2EAHTwYAAACpAAAAAxtYXhwBT0FPgAAArAAAAAgbmFtZaBxlY4AAALQAAABn3Bvc3QB9wD6AAAEcAAAACBwcmVwa1uragAABJAAAAAUAAADSwGQAAUAAAQABAAAAAAABAAEAAAAAAAAAQEAAAAAAAAAAAAAAAAAAAAAAAAAAAAAAAAAAAAAACAgICAAAAAg1UADev96AAAD6ACWAAAAAAACAAEAAQAAABQAAwABAAAAFAAEACAAAAAEAAQAAQAAAD3%2F%2FwAAAD3%2F%2F%2F%2FEAAEAAAAAAAABVAMsAIABAABWACoCWAIeAQ4BLAIsAFoBgAKAAKAA1ACAAAAAAAAAACsAVQCAAKsA1QEAASsABwAAAAIAVQAAAwADqwADAAcAADMRIRElIREhVQKr%2FasCAP4AA6v8VVUDAAACAIAA6wLVAhUAAwAHAGUYAbAIELAG1LAGELAF1LAIELAB1LABELAA1LAGELAHPLAFELAEPLABELACPLAAELADPACwCBCwBtSwBhCwB9SwBxCwAdSwARCwAtSwBhCwBTywBxCwBDywARCwADywAhCwAzwxMBMhNSEdASE1gAJV%2FasCVQHAVdVVVQAAAAEAAAABAADVeM5BXw889QADBAD%2F%2F%2F%2F%2F1joTc%2F%2F%2F%2F%2F%2FWOhNzAAD%2FIASAA6sAAAAKAAIAAQAAAAAAAQAAA%2Bj%2FagAAF3AAAP%2B2BIAAAQAAAAAAAAAAAAAAAAAAAAIDUgBVA1YAgAAAAAAAAAAoAAAAsgABAAAAAgBeAAUAAAAAAAIAgAQAAAAAAAQAAN4AAAAAAAAAFQECAAAAAAAAAAEAEgAAAAAAAAAAAAIADgASAAAAAAAAAAMAMAAgAAAAAAAAAAQAEgBQAAAAAAAAAAUAFgBiAAAAAAAAAAYACQB4AAAAAAAAAAgAHACBAAEAAAAAAAEAEgAAAAEAAAAAAAIADgASAAEAAAAAAAMAMAAgAAEAAAAAAAQAEgBQAAEAAAAAAAUAFgBiAAEAAAAAAAYACQB4AAEAAAAAAAgAHACBAAMAAQQJAAEAEgAAAAMAAQQJAAIADgASAAMAAQQJAAMAMAAgAAMAAQQJAAQAEgBQAAMAAQQJAAUAFgBiAAMAAQQJAAYACQB4AAMAAQQJAAgAHACBAE0AYQB0AGgAIABGAG8AbgB0AFIAZQBnAHUAbABhAHIATQBhAHQAaABzACAARgBvAHIAIABNAG8AcgBlACAATQBhAHQAaAAgAEYAbwBuAHQATQBhAHQAaAAgAEYAbwBuAHQAVgBlAHIAcwBpAG8AbgAgADEALgAwTWF0aF9Gb250AE0AYQB0AGgAcwAgAEYAbwByACAATQBvAHIAZQAAAwAAAAAAAAH0APoAAAAAAAAAAAAAAAAAAAAAAAAAALkHEQAAjYUYALIAAAAVFBOxAAE%2F)format('truetype')%3Bfont-weight%3Anormal%3Bfont-style%3Anormal%3B%7D%40font-face%7Bfont-family%3A'round_brackets18549f92a457f2409'%3Bsrc%3Aurl(data%3Afont%2Ftruetype%3Bcharset%3Dutf-8%3Bbase64%2CAAEAAAAMAIAAAwBAT1MvMjwHLFQAAADMAAAATmNtYXDf7xCrAAABHAAAADxjdnQgBAkDLgAAAVgAAAASZ2x5ZmAOz2cAAAFsAAABJGhlYWQOKih8AAACkAAAADZoaGVhCvgVwgAAAsgAAAAkaG10eCA6AAIAAALsAAAADGxvY2EAAARLAAAC%2BAAAABBtYXhwBIgEWQAAAwgAAAAgbmFtZXHR30MAAAMoAAACOXBvc3QDogHPAAAFZAAAACBwcmVwupWEAAAABYQAAAAHAAAGcgGQAAUAAAgACAAAAAAACAAIAAAAAAAAAQIAAAAAAAAAAAAAAAAAAAAAAAAAAAAAAAAAAAAAACAgICAAAAAo8AMGe%2F57AAAHPgGyAAAAAAACAAEAAQAAABQAAwABAAAAFAAEACgAAAAGAAQAAQACACgAKf%2F%2FAAAAKAAp%2F%2F%2F%2F2f%2FZAAEAAAAAAAAAAAFUAFYBAAAsAKgDgAAyAAcAAAACAAAAKgDVA1UAAwAHAAA1MxEjEyMRM9XVq4CAKgMr%2FQAC1QABAAD%2B0AIgBtAACQBNGAGwChCwA9SwAxCwAtSwChCwBdSwBRCwANSwAxCwBzywAhCwCDwAsAoQsAPUsAMQsAfUsAoQsAXUsAoQsADUsAMQsAI8sAcQsAg8MTAREAEzABEQASMAAZCQ%2FnABkJD%2BcALQ%2FZD%2BcAGQAnACcAGQ%2FnAAAQAA%2FtACIAbQAAkATRgBsAoQsAPUsAMQsALUsAoQsAXUsAUQsADUsAMQsAc8sAIQsAg8ALAKELAD1LADELAH1LAKELAF1LAKELAA1LADELACPLAHELAIPDEwARABIwAREAEzAAIg%2FnCQAZD%2BcJABkALQ%2FZD%2BcAGQAnACcAGQ%2FnAAAQAAAAEAAPW2NYFfDzz1AAMIAP%2F%2F%2F%2F%2FVre7u%2F%2F%2F%2F%2F9Wt7u4AAP7QA7cG0AAAAAoAAgABAAAAAAABAAAHPv5OAAAXcAAA%2F%2F4DtwABAAAAAAAAAAAAAAAAAAAAAwDVAAACIAAAAiAAAAAAAAAAAAAkAAAAowAAASQAAQAAAAMACgACAAAAAAACAIAEAAAAAAAEAABNAAAAAAAAABUBAgAAAAAAAAABAD4AAAAAAAAAAAACAA4APgAAAAAAAAADAFwATAAAAAAAAAAEAD4AqAAAAAAAAAAFABYA5gAAAAAAAAAGAB8A%2FAAAAAAAAAAIABwBGwABAAAAAAABAD4AAAABAAAAAAACAA4APgABAAAAAAADAFwATAABAAAAAAAEAD4AqAABAAAAAAAFABYA5gABAAAAAAAGAB8A%2FAABAAAAAAAIABwBGwADAAEECQABAD4AAAADAAEECQACAA4APgADAAEECQADAFwATAADAAEECQAEAD4AqAADAAEECQAFABYA5gADAAEECQAGAB8A%2FAADAAEECQAIABwBGwBSAG8AdQBuAGQAIABiAHIAYQBjAGsAZQB0AHMAIAB3AGkAdABoACAAYQBzAGMAZQBuAHQAIAAxADgANQA0AFIAZQBnAHUAbABhAHIATQBhAHQAaABzACAARgBvAHIAIABNAG8AcgBlACAAUgBvAHUAbgBkACAAYgByAGEAYwBrAGUAdABzACAAdwBpAHQAaAAgAGEAcwBjAGUAbgB0ACAAMQA4ADUANABSAG8AdQBuAGQAIABiAHIAYQBjAGsAZQB0AHMAIAB3AGkAdABoACAAYQBzAGMAZQBuAHQAIAAxADgANQA0AFYAZQByAHMAaQBvAG4AIAAyAC4AMFJvdW5kX2JyYWNrZXRzX3dpdGhfYXNjZW50XzE4NTQATQBhAHQAaABzACAARgBvAHIAIABNAG8AcgBlAAAAAAMAAAAAAAADnwHPAAAAAAAAAAAAAAAAAAAAAAAAAAC5B%2F8AAY2FAA%3D%3D)format('truetype')%3Bfont-weight%3Anormal%3Bfont-style%3Anormal%3B%7D%3C%2Fstyle%3E%3C%2Fdefs%3E%3Ctext%20font-family%3D%22Times%20New%20Roman%22%20font-size%3D%2218%22%20font-style%3D%22italic%22%20text-anchor%3D%22middle%22%20x%3D%227.5%22%20y%3D%2217%22%3Ef%3C%2Ftext%3E%3Ctext%20font-family%3D%22round_brackets18549f92a457f2409%22%20font-size%3D%2218%22%20text-anchor%3D%22middle%22%20x%3D%2216.5%22%20y%3D%2217%22%3E(%3C%2Ftext%3E%3Ctext%20font-family%3D%22Times%20New%20Roman%22%20font-size%3D%2218%22%20font-style%3D%22italic%22%20text-anchor%3D%22middle%22%20x%3D%2223.5%22%20y%3D%2217%22%3Ex%3C%2Ftext%3E%3Ctext%20font-family%3D%22round_brackets18549f92a457f2409%22%20font-size%3D%2218%22%20text-anchor%3D%22middle%22%20x%3D%2231.5%22%20y%3D%2217%22%3E)%3C%2Ftext%3E%3Ctext%20font-family%3D%22math17f39f8317fbdb1988ef4c628eb%22%20font-size%3D%2216%22%20text-anchor%3D%22middle%22%20x%3D%2243.5%22%20y%3D%2217%22%3E%3D%3C%2Ftext%3E%3Ctext%20font-family%3D%22Times%20New%20Roman%22%20font-size%3D%2218%22%20text-anchor%3D%22middle%22%20x%3D%2256.5%22%20y%3D%2217%22%3Ee%3C%2Ftext%3E%3Ctext%20font-family%3D%22Times%20New%20Roman%22%20font-size%3D%2213%22%20font-style%3D%22italic%22%20text-anchor%3D%22middle%22%20x%3D%2263.5%22%20y%3D%2212%22%3Ex%3C%2Ftext%3E%3C%2Fsvg%3E)
format('truetype')%3Bfont-weight%3Anormal%3Bfont-style%3Anormal%3B%7D%40font-face%7Bfont-family%3A'round_brackets18549f92a457f2409'%3Bsrc%3Aurl(data%3Afont%2Ftruetype%3Bcharset%3Dutf-8%3Bbase64%2CAAEAAAAMAIAAAwBAT1MvMjwHLFQAAADMAAAATmNtYXDf7xCrAAABHAAAADxjdnQgBAkDLgAAAVgAAAASZ2x5ZmAOz2cAAAFsAAABJGhlYWQOKih8AAACkAAAADZoaGVhCvgVwgAAAsgAAAAkaG10eCA6AAIAAALsAAAADGxvY2EAAARLAAAC%2BAAAABBtYXhwBIgEWQAAAwgAAAAgbmFtZXHR30MAAAMoAAACOXBvc3QDogHPAAAFZAAAACBwcmVwupWEAAAABYQAAAAHAAAGcgGQAAUAAAgACAAAAAAACAAIAAAAAAAAAQIAAAAAAAAAAAAAAAAAAAAAAAAAAAAAAAAAAAAAACAgICAAAAAo8AMGe%2F57AAAHPgGyAAAAAAACAAEAAQAAABQAAwABAAAAFAAEACgAAAAGAAQAAQACACgAKf%2F%2FAAAAKAAp%2F%2F%2F%2F2f%2FZAAEAAAAAAAAAAAFUAFYBAAAsAKgDgAAyAAcAAAACAAAAKgDVA1UAAwAHAAA1MxEjEyMRM9XVq4CAKgMr%2FQAC1QABAAD%2B0AIgBtAACQBNGAGwChCwA9SwAxCwAtSwChCwBdSwBRCwANSwAxCwBzywAhCwCDwAsAoQsAPUsAMQsAfUsAoQsAXUsAoQsADUsAMQsAI8sAcQsAg8MTAREAEzABEQASMAAZCQ%2FnABkJD%2BcALQ%2FZD%2BcAGQAnACcAGQ%2FnAAAQAA%2FtACIAbQAAkATRgBsAoQsAPUsAMQsALUsAoQsAXUsAUQsADUsAMQsAc8sAIQsAg8ALAKELAD1LADELAH1LAKELAF1LAKELAA1LADELACPLAHELAIPDEwARABIwAREAEzAAIg%2FnCQAZD%2BcJABkALQ%2FZD%2BcAGQAnACcAGQ%2FnAAAQAAAAEAAPW2NYFfDzz1AAMIAP%2F%2F%2F%2F%2FVre7u%2F%2F%2F%2F%2F9Wt7u4AAP7QA7cG0AAAAAoAAgABAAAAAAABAAAHPv5OAAAXcAAA%2F%2F4DtwABAAAAAAAAAAAAAAAAAAAAAwDVAAACIAAAAiAAAAAAAAAAAAAkAAAAowAAASQAAQAAAAMACgACAAAAAAACAIAEAAAAAAAEAABNAAAAAAAAABUBAgAAAAAAAAABAD4AAAAAAAAAAAACAA4APgAAAAAAAAADAFwATAAAAAAAAAAEAD4AqAAAAAAAAAAFABYA5gAAAAAAAAAGAB8A%2FAAAAAAAAAAIABwBGwABAAAAAAABAD4AAAABAAAAAAACAA4APgABAAAAAAADAFwATAABAAAAAAAEAD4AqAABAAAAAAAFABYA5gABAAAAAAAGAB8A%2FAABAAAAAAAIABwBGwADAAEECQABAD4AAAADAAEECQACAA4APgADAAEECQADAFwATAADAAEECQAEAD4AqAADAAEECQAFABYA5gADAAEECQAGAB8A%2FAADAAEECQAIABwBGwBSAG8AdQBuAGQAIABiAHIAYQBjAGsAZQB0AHMAIAB3AGkAdABoACAAYQBzAGMAZQBuAHQAIAAxADgANQA0AFIAZQBnAHUAbABhAHIATQBhAHQAaABzACAARgBvAHIAIABNAG8AcgBlACAAUgBvAHUAbgBkACAAYgByAGEAYwBrAGUAdABzACAAdwBpAHQAaAAgAGEAcwBjAGUAbgB0ACAAMQA4ADUANABSAG8AdQBuAGQAIABiAHIAYQBjAGsAZQB0AHMAIAB3AGkAdABoACAAYQBzAGMAZQBuAHQAIAAxADgANQA0AFYAZQByAHMAaQBvAG4AIAAyAC4AMFJvdW5kX2JyYWNrZXRzX3dpdGhfYXNjZW50XzE4NTQATQBhAHQAaABzACAARgBvAHIAIABNAG8AcgBlAAAAAAMAAAAAAAADnwHPAAAAAAAAAAAAAAAAAAAAAAAAAAC5B%2F8AAY2FAA%3D%3D)format('truetype')%3Bfont-weight%3Anormal%3Bfont-style%3Anormal%3B%7D%3C%2Fstyle%3E%3C%2Fdefs%3E%3Ctext%20font-family%3D%22Times%20New%20Roman%22%20font-size%3D%2218%22%20text-anchor%3D%22middle%22%20x%3D%227.5%22%20y%3D%2217%22%3Eln%3C%2Ftext%3E%3Ctext%20font-family%3D%22round_brackets18549f92a457f2409%22%20font-size%3D%2218%22%20text-anchor%3D%22middle%22%20x%3D%2217.5%22%20y%3D%2217%22%3E(%3C%2Ftext%3E%3Ctext%20font-family%3D%22round_brackets18549f92a457f2409%22%20font-size%3D%2218%22%20text-anchor%3D%22middle%22%20x%3D%2238.5%22%20y%3D%2217%22%3E)%3C%2Ftext%3E%3Ctext%20font-family%3D%22Times%20New%20Roman%22%20font-size%3D%2218%22%20text-anchor%3D%22middle%22%20x%3D%2224.5%22%20y%3D%2217%22%3Ee%3C%2Ftext%3E%3Ctext%20font-family%3D%22Times%20New%20Roman%22%20font-size%3D%2213%22%20font-style%3D%22italic%22%20text-anchor%3D%22middle%22%20x%3D%2231.5%22%20y%3D%2212%22%3Ex%3C%2Ftext%3E%3Ctext%20font-family%3D%22math17f39f8317fbdb1988ef4c628eb%22%20font-size%3D%2216%22%20text-anchor%3D%22middle%22%20x%3D%2250.5%22%20y%3D%2217%22%3E%3D%3C%2Ftext%3E%3Ctext%20font-family%3D%22Times%20New%20Roman%22%20font-size%3D%2218%22%20font-style%3D%22italic%22%20text-anchor%3D%22middle%22%20x%3D%2263.5%22%20y%3D%2217%22%3Ex%3C%2Ftext%3E%3C%2Fsvg%3E) and
and format('truetype')%3Bfont-weight%3Anormal%3Bfont-style%3Anormal%3B%7D%3C%2Fstyle%3E%3C%2Fdefs%3E%3Ctext%20font-family%3D%22Times%20New%20Roman%22%20font-size%3D%2218%22%20text-anchor%3D%22middle%22%20x%3D%224.5%22%20y%3D%2217%22%3Ee%3C%2Ftext%3E%3Ctext%20font-family%3D%22Times%20New%20Roman%22%20font-size%3D%2213%22%20text-anchor%3D%22middle%22%20x%3D%2213.5%22%20y%3D%2212%22%3Eln%3C%2Ftext%3E%3Ctext%20font-family%3D%22Times%20New%20Roman%22%20font-size%3D%2213%22%20font-style%3D%22italic%22%20text-anchor%3D%22middle%22%20x%3D%2221.5%22%20y%3D%2212%22%3Ex%3C%2Ftext%3E%3Ctext%20font-family%3D%22math17f39f8317fbdb1988ef4c628eb%22%20font-size%3D%2216%22%20text-anchor%3D%22middle%22%20x%3D%2234.5%22%20y%3D%2217%22%3E%3D%3C%2Ftext%3E%3Ctext%20font-family%3D%22Times%20New%20Roman%22%20font-size%3D%2218%22%20font-style%3D%22italic%22%20text-anchor%3D%22middle%22%20x%3D%2247.5%22%20y%3D%2217%22%3Ex%3C%2Ftext%3E%3C%2Fsvg%3E)
The graphs will always pass through the point (1, a)
The graphs do not have a y-intercept
The graphs have a vertical asymptote at the y-axis:
The graphs have one root at
format('truetype')%3Bfont-weight%3Anormal%3Bfont-style%3Anormal%3B%7D%40font-face%7Bfont-family%3A'brack_sm2882ad605b1e27be87c7468'%3Bsrc%3Aurl(data%3Afont%2Ftruetype%3Bcharset%3Dutf-8%3Bbase64%2CAAEAAAAMAIAAAwBAT1MvMi7PH4UAAADMAAAATmNtYXA3kjw6AAABHAAAADxjdnQgAQYDiAAAAVgAAAASZ2x5ZkyYQ7YAAAFsAAAAkWhlYWQLyR8fAAACAAAAADZoaGVhAq0XCAAAAjgAAAAkaG10eDEjA%2FUAAAJcAAAADGxvY2EAAEKZAAACaAAAABBtYXhwBJsEcQAAAngAAAAgbmFtZW7QvZAAAAKYAAAB5XBvc3QArQBVAAAEgAAAACBwcmVwu5WEAAAABKAAAAAHAAACDAGQAAUAAAQABAAAAAAABAAEAAAAAAAAAQEAAAAAAAAAAAAAAAAAAAAAAAAAAAAAAAAAAAAAACAgICAAAAAg9AMD%2FP%2F8AAABVAABAAAAAAACAAEAAQAAABQAAwABAAAAFAAEACgAAAAGAAQAAQACI5wjn%2F%2F%2FAAAjnCOf%2F%2F%2FcZdxjAAEAAAAAAAAAAAFUAFQBAAArAIwAgACoAAcAAAACAAAAAADVAQEAAwAHAAAxMxEjFyM1M9XVq4CAAQHWqwABAAAAAABVAVgAAwAfGAGwAy%2BwADyxAgL1sAE8ALEDAD%2BwAjx8sQAG9bABPBEzESNVVQFY%2FqgAAQDXAAABLAFUAAMAIBgBsAUvsAE8sAI8sQAC9bADPACwAy%2BwAjyxAAH1sAE8EzMRI9dVVQFU%2FqwAAAAAAQAAAAEAAIsesexfDzz1AAMEAP%2F%2F%2F%2F%2FVre5k%2F%2F%2F%2F%2F9Wt7mT%2FgP%2F%2FAdYBWAAAAAoAAgABAAAAAAABAAABVP%2F%2FAAAXcP%2BA%2F4AB1gABAAAAAAAAAAAAAAAAAAAAAwDVAAABLAAAASwA1wAAAAAAAAAhAAAAWAAAAJEAAQAAAAMACgACAAAAAAACAIAEAAAAAAAEAABlAAAAAAAAABUBAgAAAAAAAAABACYAAAAAAAAAAAACAA4AJgAAAAAAAAADAEQANAAAAAAAAAAEACYAeAAAAAAAAAAFABYAngAAAAAAAAAGABMAtAAAAAAAAAAIABwAxwABAAAAAAABACYAAAABAAAAAAACAA4AJgABAAAAAAADAEQANAABAAAAAAAEACYAeAABAAAAAAAFABYAngABAAAAAAAGABMAtAABAAAAAAAIABwAxwADAAEECQABACYAAAADAAEECQACAA4AJgADAAEECQADAEQANAADAAEECQAEACYAeAADAAEECQAFABYAngADAAEECQAGABMAtAADAAEECQAIABwAxwBCAHIAYQBjAGsAZQB0AHMAIABzAG0AYQBsAGwAIABzAGkAegBlAFIAZQBnAHUAbABhAHIATQBhAHQAaABzACAARgBvAHIAIABNAG8AcgBlACAAQgByAGEAYwBrAGUAdABzACAAcwBtAGEAbABsACAAcwBpAHoAZQBCAHIAYQBjAGsAZQB0AHMAIABzAG0AYQBsAGwAIABzAGkAegBlAFYAZQByAHMAaQBvAG4AIAAyAC4AMEJyYWNrZXRzX3NtYWxsX3NpemUATQBhAHQAaABzACAARgBvAHIAIABNAG8AcgBlAAAAAAMAAAAAAAAAqgBVAAAAAAAAAAAAAAAAAAAAAAAAAAC5B%2F8AAo2FAA%3D%3D)format('truetype')%3Bfont-weight%3Anormal%3Bfont-style%3Anormal%3B%7D%40font-face%7Bfont-family%3A'bracketse552f5417ff4680c6b50499'%3Bsrc%3Aurl(data%3Afont%2Ftruetype%3Bcharset%3Dutf-8%3Bbase64%2CAAEAAAAMAIAAAwBAT1MvMi7RIisAAADMAAAATmNtYXBi7uzYAAABHAAAAExjdnQgBAkDLgAAAWgAAAASZ2x5Zo64f%2BkAAAF8AAABSWhlYWQLniGcAAACyAAAADZoaGVhBK4XLAAAAwAAAAAkaG10eCWq%2F90AAAMkAAAAFGxvY2EAABknAAADOAAAABhtYXhwBJIESAAAA1AAAAAgbmFtZRAA8I4AAANwAAAB3nBvc3QBwwDgAAAFUAAAACBwcmVwupWEAAAABXAAAAAHAAACggGQAAUAAAQABAAAAAAABAAEAAAAAAAAAQEAAAAAAAAAAAAAAAAAAAAAAAAAAAAAAAAAAAAAACAgICAAAAAg9AMEAAAAAAADgAAAAAAAAAACAAEAAQAAABQAAwABAAAAFAAEADgAAAAKAAgAAgACI5sjnSOeI6D%2F%2FwAAI5sjnSOeI6D%2F%2F9xm3GXcZdxkAAEAAAAAAAAAAAAAAAABVABWAQAALACoA4AAMgAHAAAAAgAAACoA1QNVAAMABwAANTMRIxMjETPV1auAgCoDK%2F0AAtUAAQAAAAABgAOAAAUAJBgBsAAvsAPFsQEC%2FbADELEEBP0AsQAAP7ABPLEEBj%2BwAzwwMTEzEAEjAFUBKyv%2BqwH8AYT%2BqgABAAAAAAGAA4AABQAmGAGwAC6wA8WxBQL9sAMQsQIE%2FQB8sQAGPxiwBTyxAwb2sAI8MDEREgEzABMBAVQr%2FtMCA4D91v6qAYQB%2FAAB%2F6wAAAEsA4AABQAnGAGwAC%2BwBzywA8WxAQL9sAMQsQQE%2FQCxAAA%2FsAE8sQQGP7ADPDAxISMSATMAASxVAf7UKwFVAfwBhP6rAAH%2FrAAAASwDgAAFACkYAbABL7AHPLAExbEAAv2wBBCxAwT9AHyxAQY%2FsAA8GLEEAD%2BwAzwwMRMzEAEjANdV%2FqsrASsDgP3V%2FqsBhgAAAAABAAAAAQAAeuTcpl8PPPUAAwQA%2F%2F%2F%2F%2F9Wt7o7%2F%2F%2F%2F%2F1a3ujv%2BsAAABgAOAAAAACgACAAEAAAAAAAEAAAOAAAAAABdw%2F6z%2FrAGAAAEAAAAAAAAAAAAAAAAAAAAFANUAAAEsAAABLAAAASz%2FrAEs%2F6wAAAAAAAAAJAAAAGgAAACzAAAA%2FQAAAUkAAQAAAAUACAACAAAAAAACAIAEAAAAAAAEAAA%2BAAAAAAAAABUBAgAAAAAAAAABACQAAAAAAAAAAAACAA4AJAAAAAAAAAADAEIAMgAAAAAAAAAEACQAdAAAAAAAAAAFABYAmAAAAAAAAAAGABIArgAAAAAAAAAIABwAwAABAAAAAAABACQAAAABAAAAAAACAA4AJAABAAAAAAADAEIAMgABAAAAAAAEACQAdAABAAAAAAAFABYAmAABAAAAAAAGABIArgABAAAAAAAIABwAwAADAAEECQABACQAAAADAAEECQACAA4AJAADAAEECQADAEIAMgADAAEECQAEACQAdAADAAEECQAFABYAmAADAAEECQAGABIArgADAAEECQAIABwAwABCAHIAYQBjAGsAZQB0AHMAIABmAHUAbABsACAAcwBpAHoAZQBSAGUAZwB1AGwAYQByAE0AYQB0AGgAcwAgAEYAbwByACAATQBvAHIAZQAgAEIAcgBhAGMAawBlAHQAcwAgAGYAdQBsAGwAIABzAGkAegBlAEIAcgBhAGMAawBlAHQAcwAgAGYAdQBsAGwAIABzAGkAegBlAFYAZQByAHMAaQBvAG4AIAAyAC4AMEJyYWNrZXRzX2Z1bGxfc2l6ZQBNAGEAdABoAHMAIABGAG8AcgAgAE0AbwByAGUAAAADAAAAAAAAAcAA4AAAAAAAAAAAAAAAAAAAAAAAAAAAuQf%2FAAGNhQA%3D)format('truetype')%3Bfont-weight%3Anormal%3Bfont-style%3Anormal%3B%7D%3C%2Fstyle%3E%3C%2Fdefs%3E%3Ctext%20font-family%3D%22bracketse552f5417ff4680c6b50499%22%20font-size%3D%2218%22%20text-anchor%3D%22start%22%20x%3D%221.5%22%20y%3D%2218%22%3E%26%23x239B%3B%3C%2Ftext%3E%3Ctext%20font-family%3D%22brack_sm2882ad605b1e27be87c7468%22%20font-size%3D%2218%22%20text-anchor%3D%22start%22%20x%3D%221.5%22%20y%3D%2224%22%3E%26%23x239C%3B%3C%2Ftext%3E%3Ctext%20font-family%3D%22bracketse552f5417ff4680c6b50499%22%20font-size%3D%2218%22%20text-anchor%3D%22start%22%20x%3D%221.5%22%20y%3D%2240%22%3E%26%23x239D%3B%3C%2Ftext%3E%3Ctext%20font-family%3D%22bracketse552f5417ff4680c6b50499%22%20font-size%3D%2218%22%20text-anchor%3D%22start%22%20x%3D%2258.5%22%20y%3D%2218%22%3E%26%23x239E%3B%3C%2Ftext%3E%3Ctext%20font-family%3D%22brack_sm2882ad605b1e27be87c7468%22%20font-size%3D%2218%22%20text-anchor%3D%22start%22%20x%3D%2258.5%22%20y%3D%2224%22%3E%26%23x239F%3B%3C%2Ftext%3E%3Ctext%20font-family%3D%22bracketse552f5417ff4680c6b50499%22%20font-size%3D%2218%22%20text-anchor%3D%22start%22%20x%3D%2258.5%22%20y%3D%2240%22%3E%26%23x23A0%3B%3C%2Ftext%3E%3Ctext%20font-family%3D%22Times%20New%20Roman%22%20font-size%3D%2218%22%20text-anchor%3D%22middle%22%20x%3D%2211.5%22%20y%3D%2236%22%3Ee%3C%2Ftext%3E%3Ctext%20font-family%3D%22math1258f61e431a13dee47ee630c68%22%20font-size%3D%2212%22%20text-anchor%3D%22middle%22%20x%3D%2220.5%22%20y%3D%2222%22%3E%26%23x2212%3B%3C%2Ftext%3E%3Cline%20stroke%3D%22%23000%22%20stroke-linecap%3D%22square%22%20stroke-width%3D%221%22%20x1%3D%2227.5%22%20x2%3D%2236.5%22%20y1%3D%2217.5%22%20y2%3D%2217.5%22%2F%3E%3Ctext%20font-family%3D%22Times%20New%20Roman%22%20font-size%3D%2213%22%20font-style%3D%22italic%22%20text-anchor%3D%22middle%22%20x%3D%2232.5%22%20y%3D%2212%22%3Ea%3C%2Ftext%3E%3Ctext%20font-family%3D%22Times%20New%20Roman%22%20font-size%3D%2213%22%20font-style%3D%22italic%22%20text-anchor%3D%22middle%22%20x%3D%2231.5%22%20y%3D%2231%22%3Eb%3C%2Ftext%3E%3Ctext%20font-family%3D%22math1258f61e431a13dee47ee630c68%22%20font-size%3D%2216%22%20text-anchor%3D%22middle%22%20x%3D%2241.5%22%20y%3D%2236%22%3E%2C%3C%2Ftext%3E%3Ctext%20font-family%3D%22Times%20New%20Roman%22%20font-size%3D%2218%22%20text-anchor%3D%22middle%22%20x%3D%2252.5%22%20y%3D%2236%22%3E0%3C%2Ftext%3E%3C%2Fsvg%3E)
This can be found using your GDC
The graphs do not have any minimum or maximum points
The value of b determines whether the graph is increasing or decreasing
If b is positive then the graph is increasing
If b is negative then the graph is decreasing

Logistic functions & graphs
What are the key features of logistic graphs?
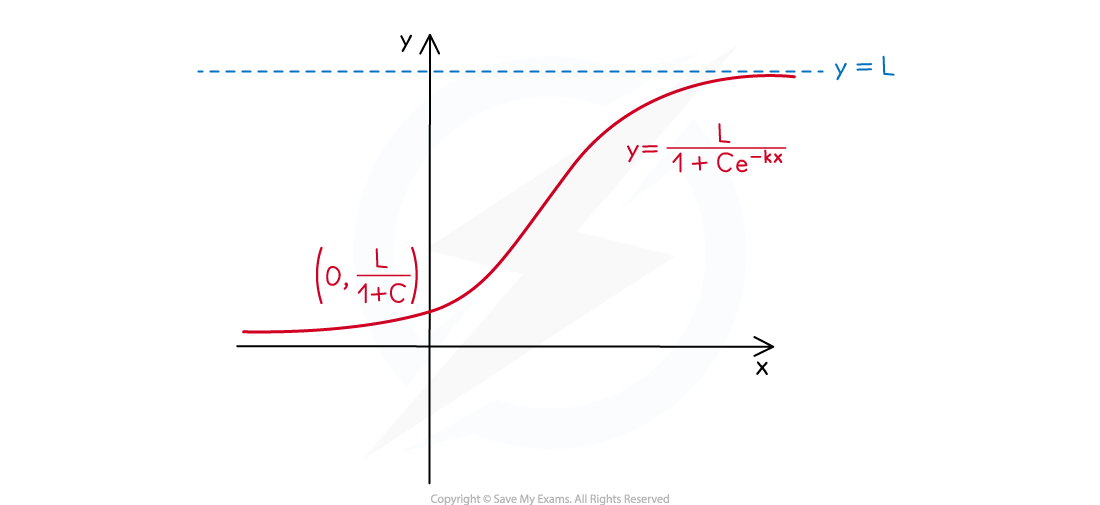
A logistic function is of the form
format('truetype')%3Bfont-weight%3Anormal%3Bfont-style%3Anormal%3B%7D%40font-face%7Bfont-family%3A'round_brackets18549f92a457f2409'%3Bsrc%3Aurl(data%3Afont%2Ftruetype%3Bcharset%3Dutf-8%3Bbase64%2CAAEAAAAMAIAAAwBAT1MvMjwHLFQAAADMAAAATmNtYXDf7xCrAAABHAAAADxjdnQgBAkDLgAAAVgAAAASZ2x5ZmAOz2cAAAFsAAABJGhlYWQOKih8AAACkAAAADZoaGVhCvgVwgAAAsgAAAAkaG10eCA6AAIAAALsAAAADGxvY2EAAARLAAAC%2BAAAABBtYXhwBIgEWQAAAwgAAAAgbmFtZXHR30MAAAMoAAACOXBvc3QDogHPAAAFZAAAACBwcmVwupWEAAAABYQAAAAHAAAGcgGQAAUAAAgACAAAAAAACAAIAAAAAAAAAQIAAAAAAAAAAAAAAAAAAAAAAAAAAAAAAAAAAAAAACAgICAAAAAo8AMGe%2F57AAAHPgGyAAAAAAACAAEAAQAAABQAAwABAAAAFAAEACgAAAAGAAQAAQACACgAKf%2F%2FAAAAKAAp%2F%2F%2F%2F2f%2FZAAEAAAAAAAAAAAFUAFYBAAAsAKgDgAAyAAcAAAACAAAAKgDVA1UAAwAHAAA1MxEjEyMRM9XVq4CAKgMr%2FQAC1QABAAD%2B0AIgBtAACQBNGAGwChCwA9SwAxCwAtSwChCwBdSwBRCwANSwAxCwBzywAhCwCDwAsAoQsAPUsAMQsAfUsAoQsAXUsAoQsADUsAMQsAI8sAcQsAg8MTAREAEzABEQASMAAZCQ%2FnABkJD%2BcALQ%2FZD%2BcAGQAnACcAGQ%2FnAAAQAA%2FtACIAbQAAkATRgBsAoQsAPUsAMQsALUsAoQsAXUsAUQsADUsAMQsAc8sAIQsAg8ALAKELAD1LADELAH1LAKELAF1LAKELAA1LADELACPLAHELAIPDEwARABIwAREAEzAAIg%2FnCQAZD%2BcJABkALQ%2FZD%2BcAGQAnACcAGQ%2FnAAAQAAAAEAAPW2NYFfDzz1AAMIAP%2F%2F%2F%2F%2FVre7u%2F%2F%2F%2F%2F9Wt7u4AAP7QA7cG0AAAAAoAAgABAAAAAAABAAAHPv5OAAAXcAAA%2F%2F4DtwABAAAAAAAAAAAAAAAAAAAAAwDVAAACIAAAAiAAAAAAAAAAAAAkAAAAowAAASQAAQAAAAMACgACAAAAAAACAIAEAAAAAAAEAABNAAAAAAAAABUBAgAAAAAAAAABAD4AAAAAAAAAAAACAA4APgAAAAAAAAADAFwATAAAAAAAAAAEAD4AqAAAAAAAAAAFABYA5gAAAAAAAAAGAB8A%2FAAAAAAAAAAIABwBGwABAAAAAAABAD4AAAABAAAAAAACAA4APgABAAAAAAADAFwATAABAAAAAAAEAD4AqAABAAAAAAAFABYA5gABAAAAAAAGAB8A%2FAABAAAAAAAIABwBGwADAAEECQABAD4AAAADAAEECQACAA4APgADAAEECQADAFwATAADAAEECQAEAD4AqAADAAEECQAFABYA5gADAAEECQAGAB8A%2FAADAAEECQAIABwBGwBSAG8AdQBuAGQAIABiAHIAYQBjAGsAZQB0AHMAIAB3AGkAdABoACAAYQBzAGMAZQBuAHQAIAAxADgANQA0AFIAZQBnAHUAbABhAHIATQBhAHQAaABzACAARgBvAHIAIABNAG8AcgBlACAAUgBvAHUAbgBkACAAYgByAGEAYwBrAGUAdABzACAAdwBpAHQAaAAgAGEAcwBjAGUAbgB0ACAAMQA4ADUANABSAG8AdQBuAGQAIABiAHIAYQBjAGsAZQB0AHMAIAB3AGkAdABoACAAYQBzAGMAZQBuAHQAIAAxADgANQA0AFYAZQByAHMAaQBvAG4AIAAyAC4AMFJvdW5kX2JyYWNrZXRzX3dpdGhfYXNjZW50XzE4NTQATQBhAHQAaABzACAARgBvAHIAIABNAG8AcgBlAAAAAAMAAAAAAAADnwHPAAAAAAAAAAAAAAAAAAAAAAAAAAC5B%2F8AAY2FAA%3D%3D)format('truetype')%3Bfont-weight%3Anormal%3Bfont-style%3Anormal%3B%7D%3C%2Fstyle%3E%3C%2Fdefs%3E%3Ctext%20font-family%3D%22Times%20New%20Roman%22%20font-size%3D%2218%22%20font-style%3D%22italic%22%20text-anchor%3D%22middle%22%20x%3D%227.5%22%20y%3D%2230%22%3Ef%3C%2Ftext%3E%3Ctext%20font-family%3D%22round_brackets18549f92a457f2409%22%20font-size%3D%2218%22%20text-anchor%3D%22middle%22%20x%3D%2216.5%22%20y%3D%2230%22%3E(%3C%2Ftext%3E%3Ctext%20font-family%3D%22round_brackets18549f92a457f2409%22%20font-size%3D%2218%22%20text-anchor%3D%22middle%22%20x%3D%2231.5%22%20y%3D%2230%22%3E)%3C%2Ftext%3E%3Ctext%20font-family%3D%22Times%20New%20Roman%22%20font-size%3D%2218%22%20font-style%3D%22italic%22%20text-anchor%3D%22middle%22%20x%3D%2223.5%22%20y%3D%2230%22%3Ex%3C%2Ftext%3E%3Ctext%20font-family%3D%22math19290e2477baefb8e9b15f4a12a%22%20font-size%3D%2216%22%20text-anchor%3D%22middle%22%20x%3D%2243.5%22%20y%3D%2230%22%3E%3D%3C%2Ftext%3E%3Cline%20stroke%3D%22%23000%22%20stroke-linecap%3D%22square%22%20stroke-width%3D%221%22%20x1%3D%2254.5%22%20x2%3D%22129.5%22%20y1%3D%2223.5%22%20y2%3D%2223.5%22%2F%3E%3Ctext%20font-family%3D%22Times%20New%20Roman%22%20font-size%3D%2218%22%20font-style%3D%22italic%22%20text-anchor%3D%22middle%22%20x%3D%2291.5%22%20y%3D%2216%22%3EL%3C%2Ftext%3E%3Ctext%20font-family%3D%22Times%20New%20Roman%22%20font-size%3D%2218%22%20text-anchor%3D%22middle%22%20x%3D%2260.5%22%20y%3D%2242%22%3E1%3C%2Ftext%3E%3Ctext%20font-family%3D%22math19290e2477baefb8e9b15f4a12a%22%20font-size%3D%2216%22%20text-anchor%3D%22middle%22%20x%3D%2273.5%22%20y%3D%2242%22%3E%2B%3C%2Ftext%3E%3Ctext%20font-family%3D%22Times%20New%20Roman%22%20font-size%3D%2218%22%20font-style%3D%22italic%22%20text-anchor%3D%22middle%22%20x%3D%2288.5%22%20y%3D%2242%22%3EC%3C%2Ftext%3E%3Ctext%20font-family%3D%22Times%20New%20Roman%22%20font-size%3D%2218%22%20text-anchor%3D%22middle%22%20x%3D%2299.5%22%20y%3D%2242%22%3Ee%3C%2Ftext%3E%3Ctext%20font-family%3D%22math19290e2477baefb8e9b15f4a12a%22%20font-size%3D%2212%22%20text-anchor%3D%22middle%22%20x%3D%22108.5%22%20y%3D%2237%22%3E%26%23x2212%3B%3C%2Ftext%3E%3Ctext%20font-family%3D%22Times%20New%20Roman%22%20font-size%3D%2213%22%20font-style%3D%22italic%22%20text-anchor%3D%22middle%22%20x%3D%22116.5%22%20y%3D%2237%22%3Ek%3C%2Ftext%3E%3Ctext%20font-family%3D%22Times%20New%20Roman%22%20font-size%3D%2213%22%20font-style%3D%22italic%22%20text-anchor%3D%22middle%22%20x%3D%22123.5%22%20y%3D%2237%22%3Ex%3C%2Ftext%3E%3C%2Fsvg%3E)
L, C & k are positive constants
Its domain is the set of all real values
Its range is the set of real positive values less than L
The y-intercept is at the point
format('truetype')%3Bfont-weight%3Anormal%3Bfont-style%3Anormal%3B%7D%40font-face%7Bfont-family%3A'brack_sm2882ad605b1e27be87c7468'%3Bsrc%3Aurl(data%3Afont%2Ftruetype%3Bcharset%3Dutf-8%3Bbase64%2CAAEAAAAMAIAAAwBAT1MvMi7PH4UAAADMAAAATmNtYXA3kjw6AAABHAAAADxjdnQgAQYDiAAAAVgAAAASZ2x5ZkyYQ7YAAAFsAAAAkWhlYWQLyR8fAAACAAAAADZoaGVhAq0XCAAAAjgAAAAkaG10eDEjA%2FUAAAJcAAAADGxvY2EAAEKZAAACaAAAABBtYXhwBJsEcQAAAngAAAAgbmFtZW7QvZAAAAKYAAAB5XBvc3QArQBVAAAEgAAAACBwcmVwu5WEAAAABKAAAAAHAAACDAGQAAUAAAQABAAAAAAABAAEAAAAAAAAAQEAAAAAAAAAAAAAAAAAAAAAAAAAAAAAAAAAAAAAACAgICAAAAAg9AMD%2FP%2F8AAABVAABAAAAAAACAAEAAQAAABQAAwABAAAAFAAEACgAAAAGAAQAAQACI5wjn%2F%2F%2FAAAjnCOf%2F%2F%2FcZdxjAAEAAAAAAAAAAAFUAFQBAAArAIwAgACoAAcAAAACAAAAAADVAQEAAwAHAAAxMxEjFyM1M9XVq4CAAQHWqwABAAAAAABVAVgAAwAfGAGwAy%2BwADyxAgL1sAE8ALEDAD%2BwAjx8sQAG9bABPBEzESNVVQFY%2FqgAAQDXAAABLAFUAAMAIBgBsAUvsAE8sAI8sQAC9bADPACwAy%2BwAjyxAAH1sAE8EzMRI9dVVQFU%2FqwAAAAAAQAAAAEAAIsesexfDzz1AAMEAP%2F%2F%2F%2F%2FVre5k%2F%2F%2F%2F%2F9Wt7mT%2FgP%2F%2FAdYBWAAAAAoAAgABAAAAAAABAAABVP%2F%2FAAAXcP%2BA%2F4AB1gABAAAAAAAAAAAAAAAAAAAAAwDVAAABLAAAASwA1wAAAAAAAAAhAAAAWAAAAJEAAQAAAAMACgACAAAAAAACAIAEAAAAAAAEAABlAAAAAAAAABUBAgAAAAAAAAABACYAAAAAAAAAAAACAA4AJgAAAAAAAAADAEQANAAAAAAAAAAEACYAeAAAAAAAAAAFABYAngAAAAAAAAAGABMAtAAAAAAAAAAIABwAxwABAAAAAAABACYAAAABAAAAAAACAA4AJgABAAAAAAADAEQANAABAAAAAAAEACYAeAABAAAAAAAFABYAngABAAAAAAAGABMAtAABAAAAAAAIABwAxwADAAEECQABACYAAAADAAEECQACAA4AJgADAAEECQADAEQANAADAAEECQAEACYAeAADAAEECQAFABYAngADAAEECQAGABMAtAADAAEECQAIABwAxwBCAHIAYQBjAGsAZQB0AHMAIABzAG0AYQBsAGwAIABzAGkAegBlAFIAZQBnAHUAbABhAHIATQBhAHQAaABzACAARgBvAHIAIABNAG8AcgBlACAAQgByAGEAYwBrAGUAdABzACAAcwBtAGEAbABsACAAcwBpAHoAZQBCAHIAYQBjAGsAZQB0AHMAIABzAG0AYQBsAGwAIABzAGkAegBlAFYAZQByAHMAaQBvAG4AIAAyAC4AMEJyYWNrZXRzX3NtYWxsX3NpemUATQBhAHQAaABzACAARgBvAHIAIABNAG8AcgBlAAAAAAMAAAAAAAAAqgBVAAAAAAAAAAAAAAAAAAAAAAAAAAC5B%2F8AAo2FAA%3D%3D)format('truetype')%3Bfont-weight%3Anormal%3Bfont-style%3Anormal%3B%7D%40font-face%7Bfont-family%3A'bracketse552f5417ff4680c6b50499'%3Bsrc%3Aurl(data%3Afont%2Ftruetype%3Bcharset%3Dutf-8%3Bbase64%2CAAEAAAAMAIAAAwBAT1MvMi7RIisAAADMAAAATmNtYXBi7uzYAAABHAAAAExjdnQgBAkDLgAAAWgAAAASZ2x5Zo64f%2BkAAAF8AAABSWhlYWQLniGcAAACyAAAADZoaGVhBK4XLAAAAwAAAAAkaG10eCWq%2F90AAAMkAAAAFGxvY2EAABknAAADOAAAABhtYXhwBJIESAAAA1AAAAAgbmFtZRAA8I4AAANwAAAB3nBvc3QBwwDgAAAFUAAAACBwcmVwupWEAAAABXAAAAAHAAACggGQAAUAAAQABAAAAAAABAAEAAAAAAAAAQEAAAAAAAAAAAAAAAAAAAAAAAAAAAAAAAAAAAAAACAgICAAAAAg9AMEAAAAAAADgAAAAAAAAAACAAEAAQAAABQAAwABAAAAFAAEADgAAAAKAAgAAgACI5sjnSOeI6D%2F%2FwAAI5sjnSOeI6D%2F%2F9xm3GXcZdxkAAEAAAAAAAAAAAAAAAABVABWAQAALACoA4AAMgAHAAAAAgAAACoA1QNVAAMABwAANTMRIxMjETPV1auAgCoDK%2F0AAtUAAQAAAAABgAOAAAUAJBgBsAAvsAPFsQEC%2FbADELEEBP0AsQAAP7ABPLEEBj%2BwAzwwMTEzEAEjAFUBKyv%2BqwH8AYT%2BqgABAAAAAAGAA4AABQAmGAGwAC6wA8WxBQL9sAMQsQIE%2FQB8sQAGPxiwBTyxAwb2sAI8MDEREgEzABMBAVQr%2FtMCA4D91v6qAYQB%2FAAB%2F6wAAAEsA4AABQAnGAGwAC%2BwBzywA8WxAQL9sAMQsQQE%2FQCxAAA%2FsAE8sQQGP7ADPDAxISMSATMAASxVAf7UKwFVAfwBhP6rAAH%2FrAAAASwDgAAFACkYAbABL7AHPLAExbEAAv2wBBCxAwT9AHyxAQY%2FsAA8GLEEAD%2BwAzwwMRMzEAEjANdV%2FqsrASsDgP3V%2FqsBhgAAAAABAAAAAQAAeuTcpl8PPPUAAwQA%2F%2F%2F%2F%2F9Wt7o7%2F%2F%2F%2F%2F1a3ujv%2BsAAABgAOAAAAACgACAAEAAAAAAAEAAAOAAAAAABdw%2F6z%2FrAGAAAEAAAAAAAAAAAAAAAAAAAAFANUAAAEsAAABLAAAASz%2FrAEs%2F6wAAAAAAAAAJAAAAGgAAACzAAAA%2FQAAAUkAAQAAAAUACAACAAAAAAACAIAEAAAAAAAEAAA%2BAAAAAAAAABUBAgAAAAAAAAABACQAAAAAAAAAAAACAA4AJAAAAAAAAAADAEIAMgAAAAAAAAAEACQAdAAAAAAAAAAFABYAmAAAAAAAAAAGABIArgAAAAAAAAAIABwAwAABAAAAAAABACQAAAABAAAAAAACAA4AJAABAAAAAAADAEIAMgABAAAAAAAEACQAdAABAAAAAAAFABYAmAABAAAAAAAGABIArgABAAAAAAAIABwAwAADAAEECQABACQAAAADAAEECQACAA4AJAADAAEECQADAEIAMgADAAEECQAEACQAdAADAAEECQAFABYAmAADAAEECQAGABIArgADAAEECQAIABwAwABCAHIAYQBjAGsAZQB0AHMAIABmAHUAbABsACAAcwBpAHoAZQBSAGUAZwB1AGwAYQByAE0AYQB0AGgAcwAgAEYAbwByACAATQBvAHIAZQAgAEIAcgBhAGMAawBlAHQAcwAgAGYAdQBsAGwAIABzAGkAegBlAEIAcgBhAGMAawBlAHQAcwAgAGYAdQBsAGwAIABzAGkAegBlAFYAZQByAHMAaQBvAG4AIAAyAC4AMEJyYWNrZXRzX2Z1bGxfc2l6ZQBNAGEAdABoAHMAIABGAG8AcgAgAE0AbwByAGUAAAADAAAAAAAAAcAA4AAAAAAAAAAAAAAAAAAAAAAAAAAAuQf%2FAAGNhQA%3D)format('truetype')%3Bfont-weight%3Anormal%3Bfont-style%3Anormal%3B%7D%3C%2Fstyle%3E%3C%2Fdefs%3E%3Ctext%20font-family%3D%22bracketse552f5417ff4680c6b50499%22%20font-size%3D%2218%22%20text-anchor%3D%22start%22%20x%3D%221.5%22%20y%3D%2217%22%3E%26%23x239B%3B%3C%2Ftext%3E%3Ctext%20font-family%3D%22brack_sm2882ad605b1e27be87c7468%22%20font-size%3D%2218%22%20text-anchor%3D%22start%22%20x%3D%221.5%22%20y%3D%2223%22%3E%26%23x239C%3B%3C%2Ftext%3E%3Ctext%20font-family%3D%22brack_sm2882ad605b1e27be87c7468%22%20font-size%3D%2218%22%20text-anchor%3D%22start%22%20x%3D%221.5%22%20y%3D%2229%22%3E%26%23x239C%3B%3C%2Ftext%3E%3Ctext%20font-family%3D%22bracketse552f5417ff4680c6b50499%22%20font-size%3D%2218%22%20text-anchor%3D%22start%22%20x%3D%221.5%22%20y%3D%2245%22%3E%26%23x239D%3B%3C%2Ftext%3E%3Ctext%20font-family%3D%22bracketse552f5417ff4680c6b50499%22%20font-size%3D%2218%22%20text-anchor%3D%22start%22%20x%3D%2273.5%22%20y%3D%2217%22%3E%26%23x239E%3B%3C%2Ftext%3E%3Ctext%20font-family%3D%22brack_sm2882ad605b1e27be87c7468%22%20font-size%3D%2218%22%20text-anchor%3D%22start%22%20x%3D%2273.5%22%20y%3D%2223%22%3E%26%23x239F%3B%3C%2Ftext%3E%3Ctext%20font-family%3D%22brack_sm2882ad605b1e27be87c7468%22%20font-size%3D%2218%22%20text-anchor%3D%22start%22%20x%3D%2273.5%22%20y%3D%2229%22%3E%26%23x239F%3B%3C%2Ftext%3E%3Ctext%20font-family%3D%22bracketse552f5417ff4680c6b50499%22%20font-size%3D%2218%22%20text-anchor%3D%22start%22%20x%3D%2273.5%22%20y%3D%2245%22%3E%26%23x23A0%3B%3C%2Ftext%3E%3Ctext%20font-family%3D%22Times%20New%20Roman%22%20font-size%3D%2218%22%20text-anchor%3D%22middle%22%20x%3D%2211.5%22%20y%3D%2230%22%3E0%3C%2Ftext%3E%3Ctext%20font-family%3D%22math1e187b16a932af07655c1c2eab9%22%20font-size%3D%2216%22%20text-anchor%3D%22middle%22%20x%3D%2218.5%22%20y%3D%2230%22%3E%2C%3C%2Ftext%3E%3Cline%20stroke%3D%22%23000%22%20stroke-linecap%3D%22square%22%20stroke-width%3D%221%22%20x1%3D%2227.5%22%20x2%3D%2269.5%22%20y1%3D%2223.5%22%20y2%3D%2223.5%22%2F%3E%3Ctext%20font-family%3D%22Times%20New%20Roman%22%20font-size%3D%2218%22%20font-style%3D%22italic%22%20text-anchor%3D%22middle%22%20x%3D%2248.5%22%20y%3D%2216%22%3EL%3C%2Ftext%3E%3Ctext%20font-family%3D%22Times%20New%20Roman%22%20font-size%3D%2218%22%20text-anchor%3D%22middle%22%20x%3D%2233.5%22%20y%3D%2241%22%3E1%3C%2Ftext%3E%3Ctext%20font-family%3D%22math1e187b16a932af07655c1c2eab9%22%20font-size%3D%2216%22%20text-anchor%3D%22middle%22%20x%3D%2246.5%22%20y%3D%2241%22%3E%2B%3C%2Ftext%3E%3Ctext%20font-family%3D%22Times%20New%20Roman%22%20font-size%3D%2218%22%20font-style%3D%22italic%22%20text-anchor%3D%22middle%22%20x%3D%2261.5%22%20y%3D%2241%22%3EC%3C%2Ftext%3E%3C%2Fsvg%3E)
There are no roots
There is a horizontal asymptote at y = L
This is called the carrying capacity
This is the upper limit of the function
For example: it could represent the limit of a population size
There is a horizontal asymptote at y = 0
The graph is always increasing
Ready to test your students on this topic?
- Create exam-aligned tests in minutes
- Differentiate easily with tiered difficulty
- Trusted for all assessment types

Did this page help you?