Trigonometric Graphs (AQA GCSE Further Maths): Revision Note
Exam code: 8365

Graphs of trigonometric functions
What is meant by graphs of trigonometric functions?
The graphs are
Why do I need to know what graphs of trigonometric functions look like?
Trigonometric graphs (trig graphs) are used in various applications of mathematics
e.g. the oscillating / wave-like nature of sine and/or cosine can be used to model how a pendulum swings or tide heights
How do I sketch trig graphs?
As with other graphs, being familiar with the general style of trig graphs will help you sketch them quickly
They can then be used to find values or angles alongside, or instead of, your calculator
All trig graphs follow a pattern – a “starting point” and then “something happens every 90°”
The diagrams below show the graphs of sin, cos and tan from -360° to 360°
Most questions will focus on the postive part of the graph for angles between 0° and 360°
Worked Example
On the axes provided, sketch the graph of ![]() for
for ![]() .
.
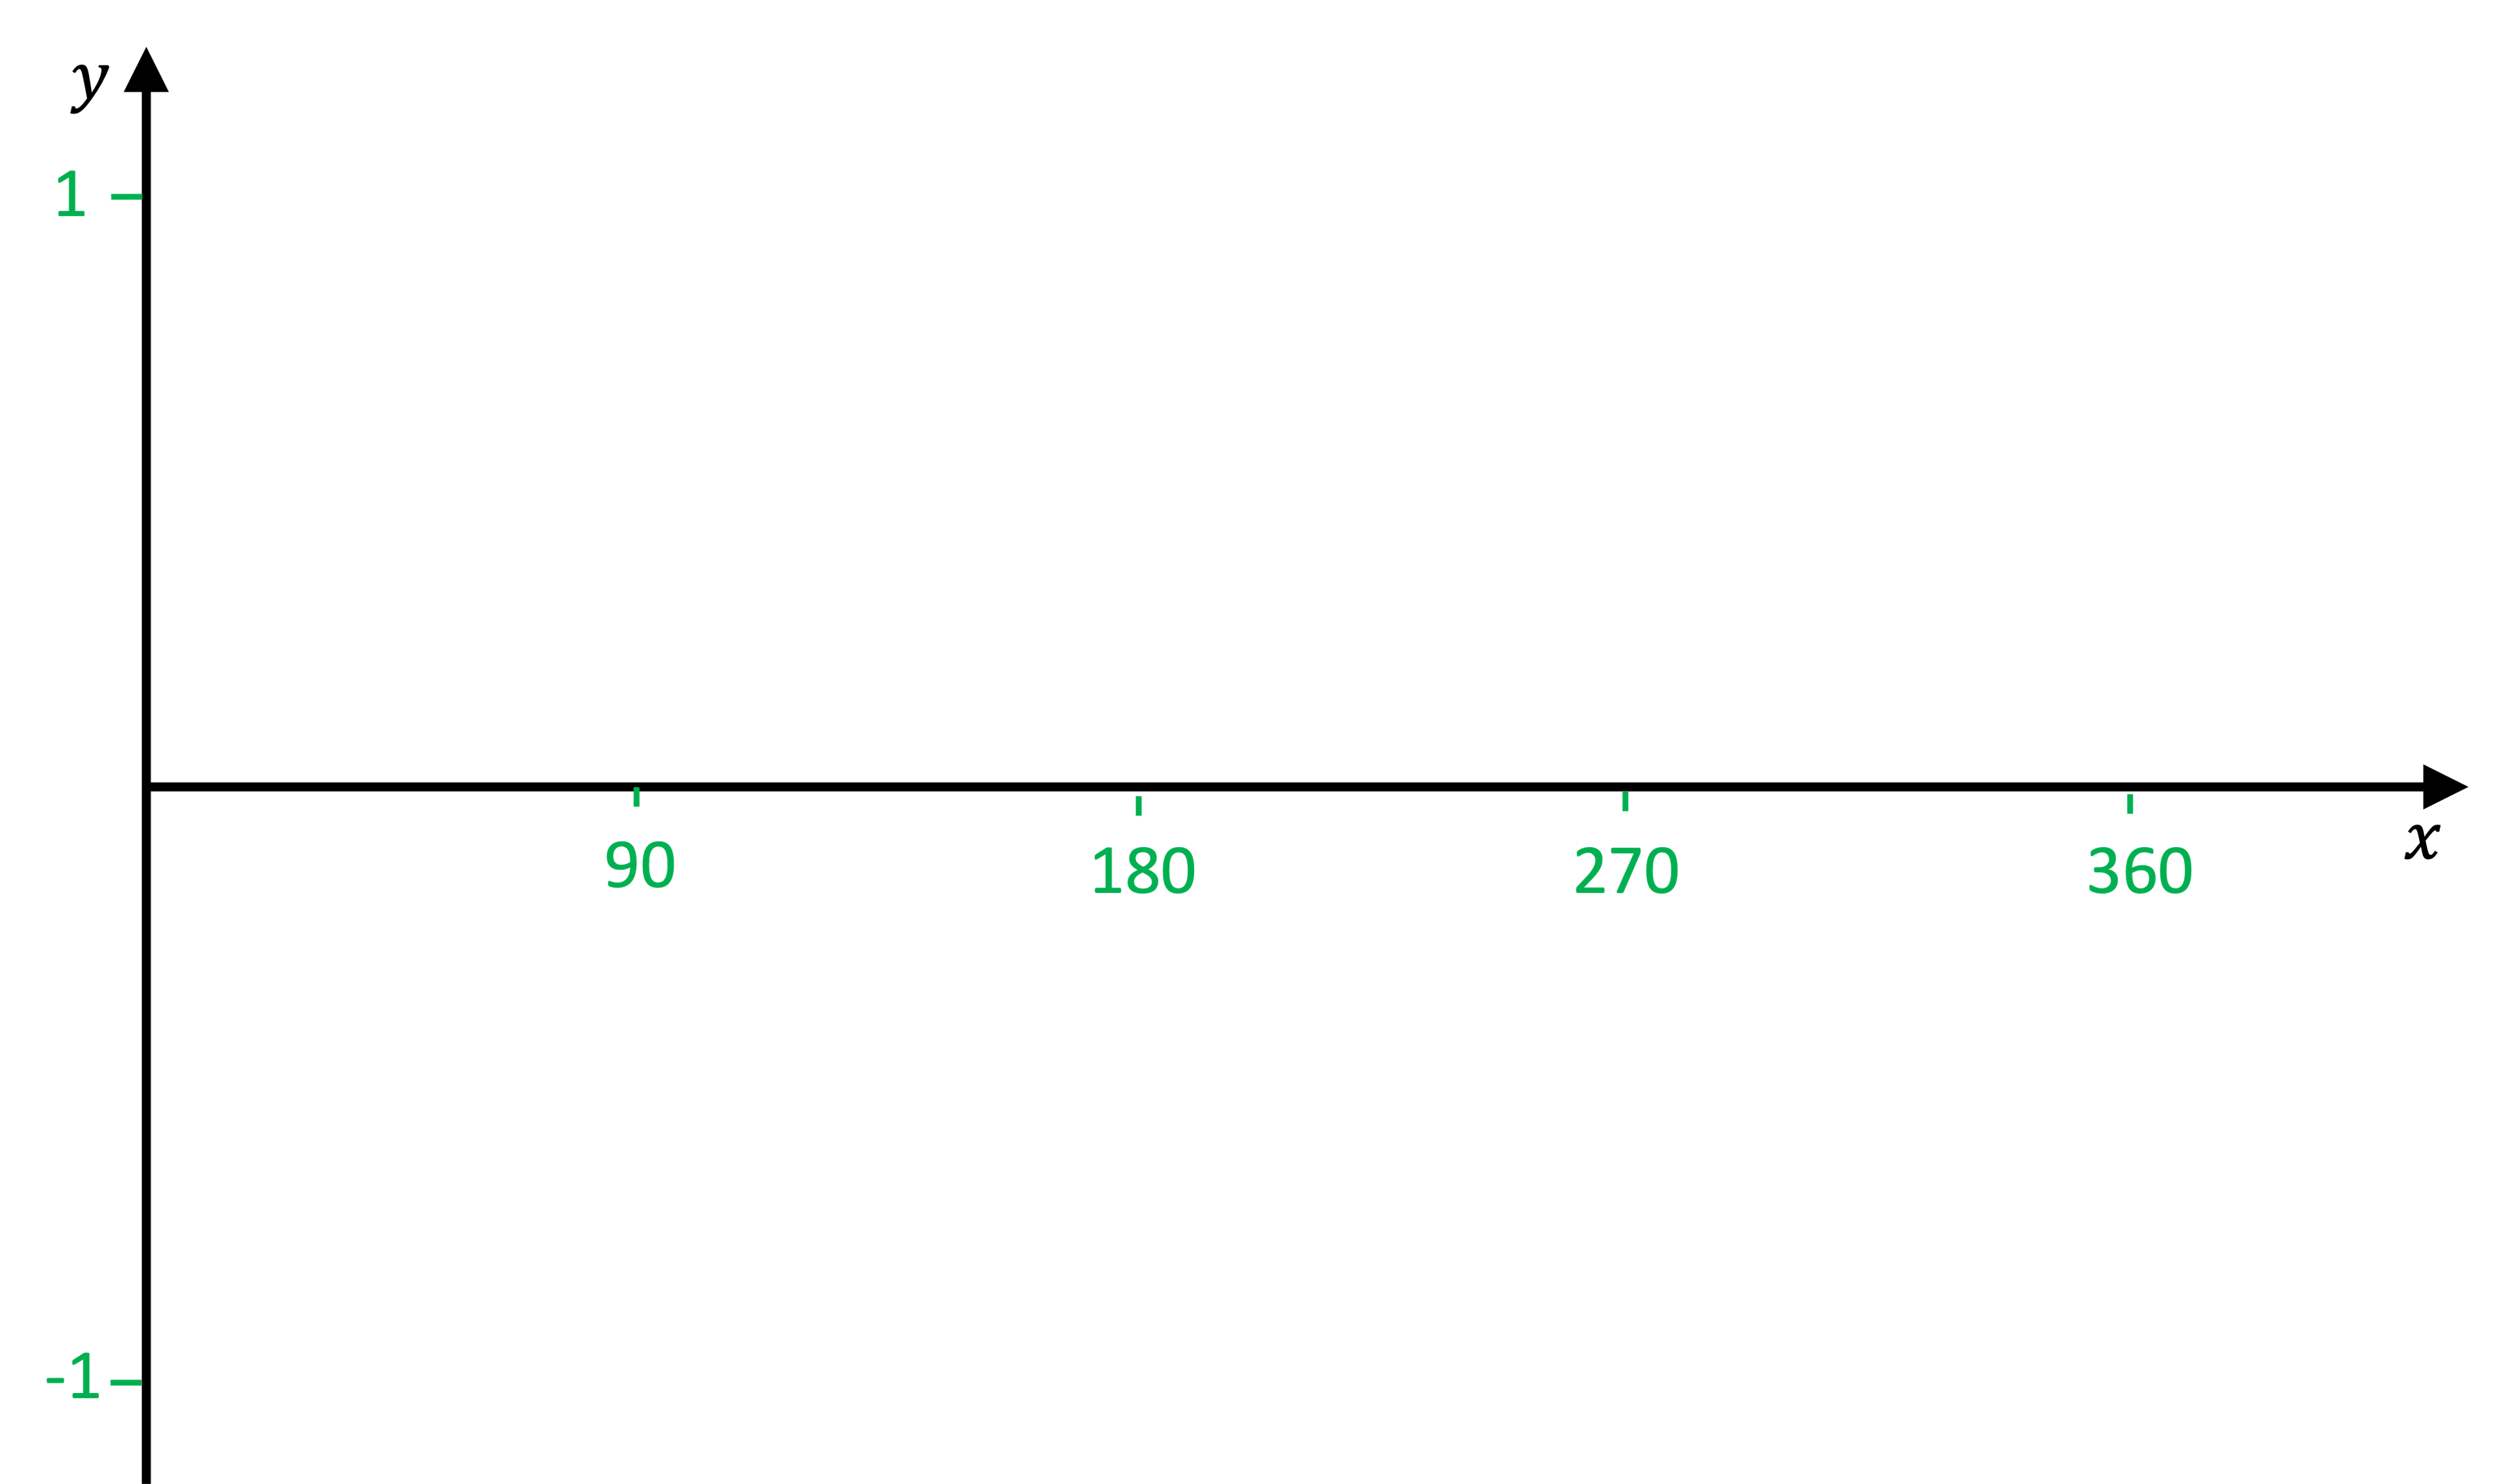
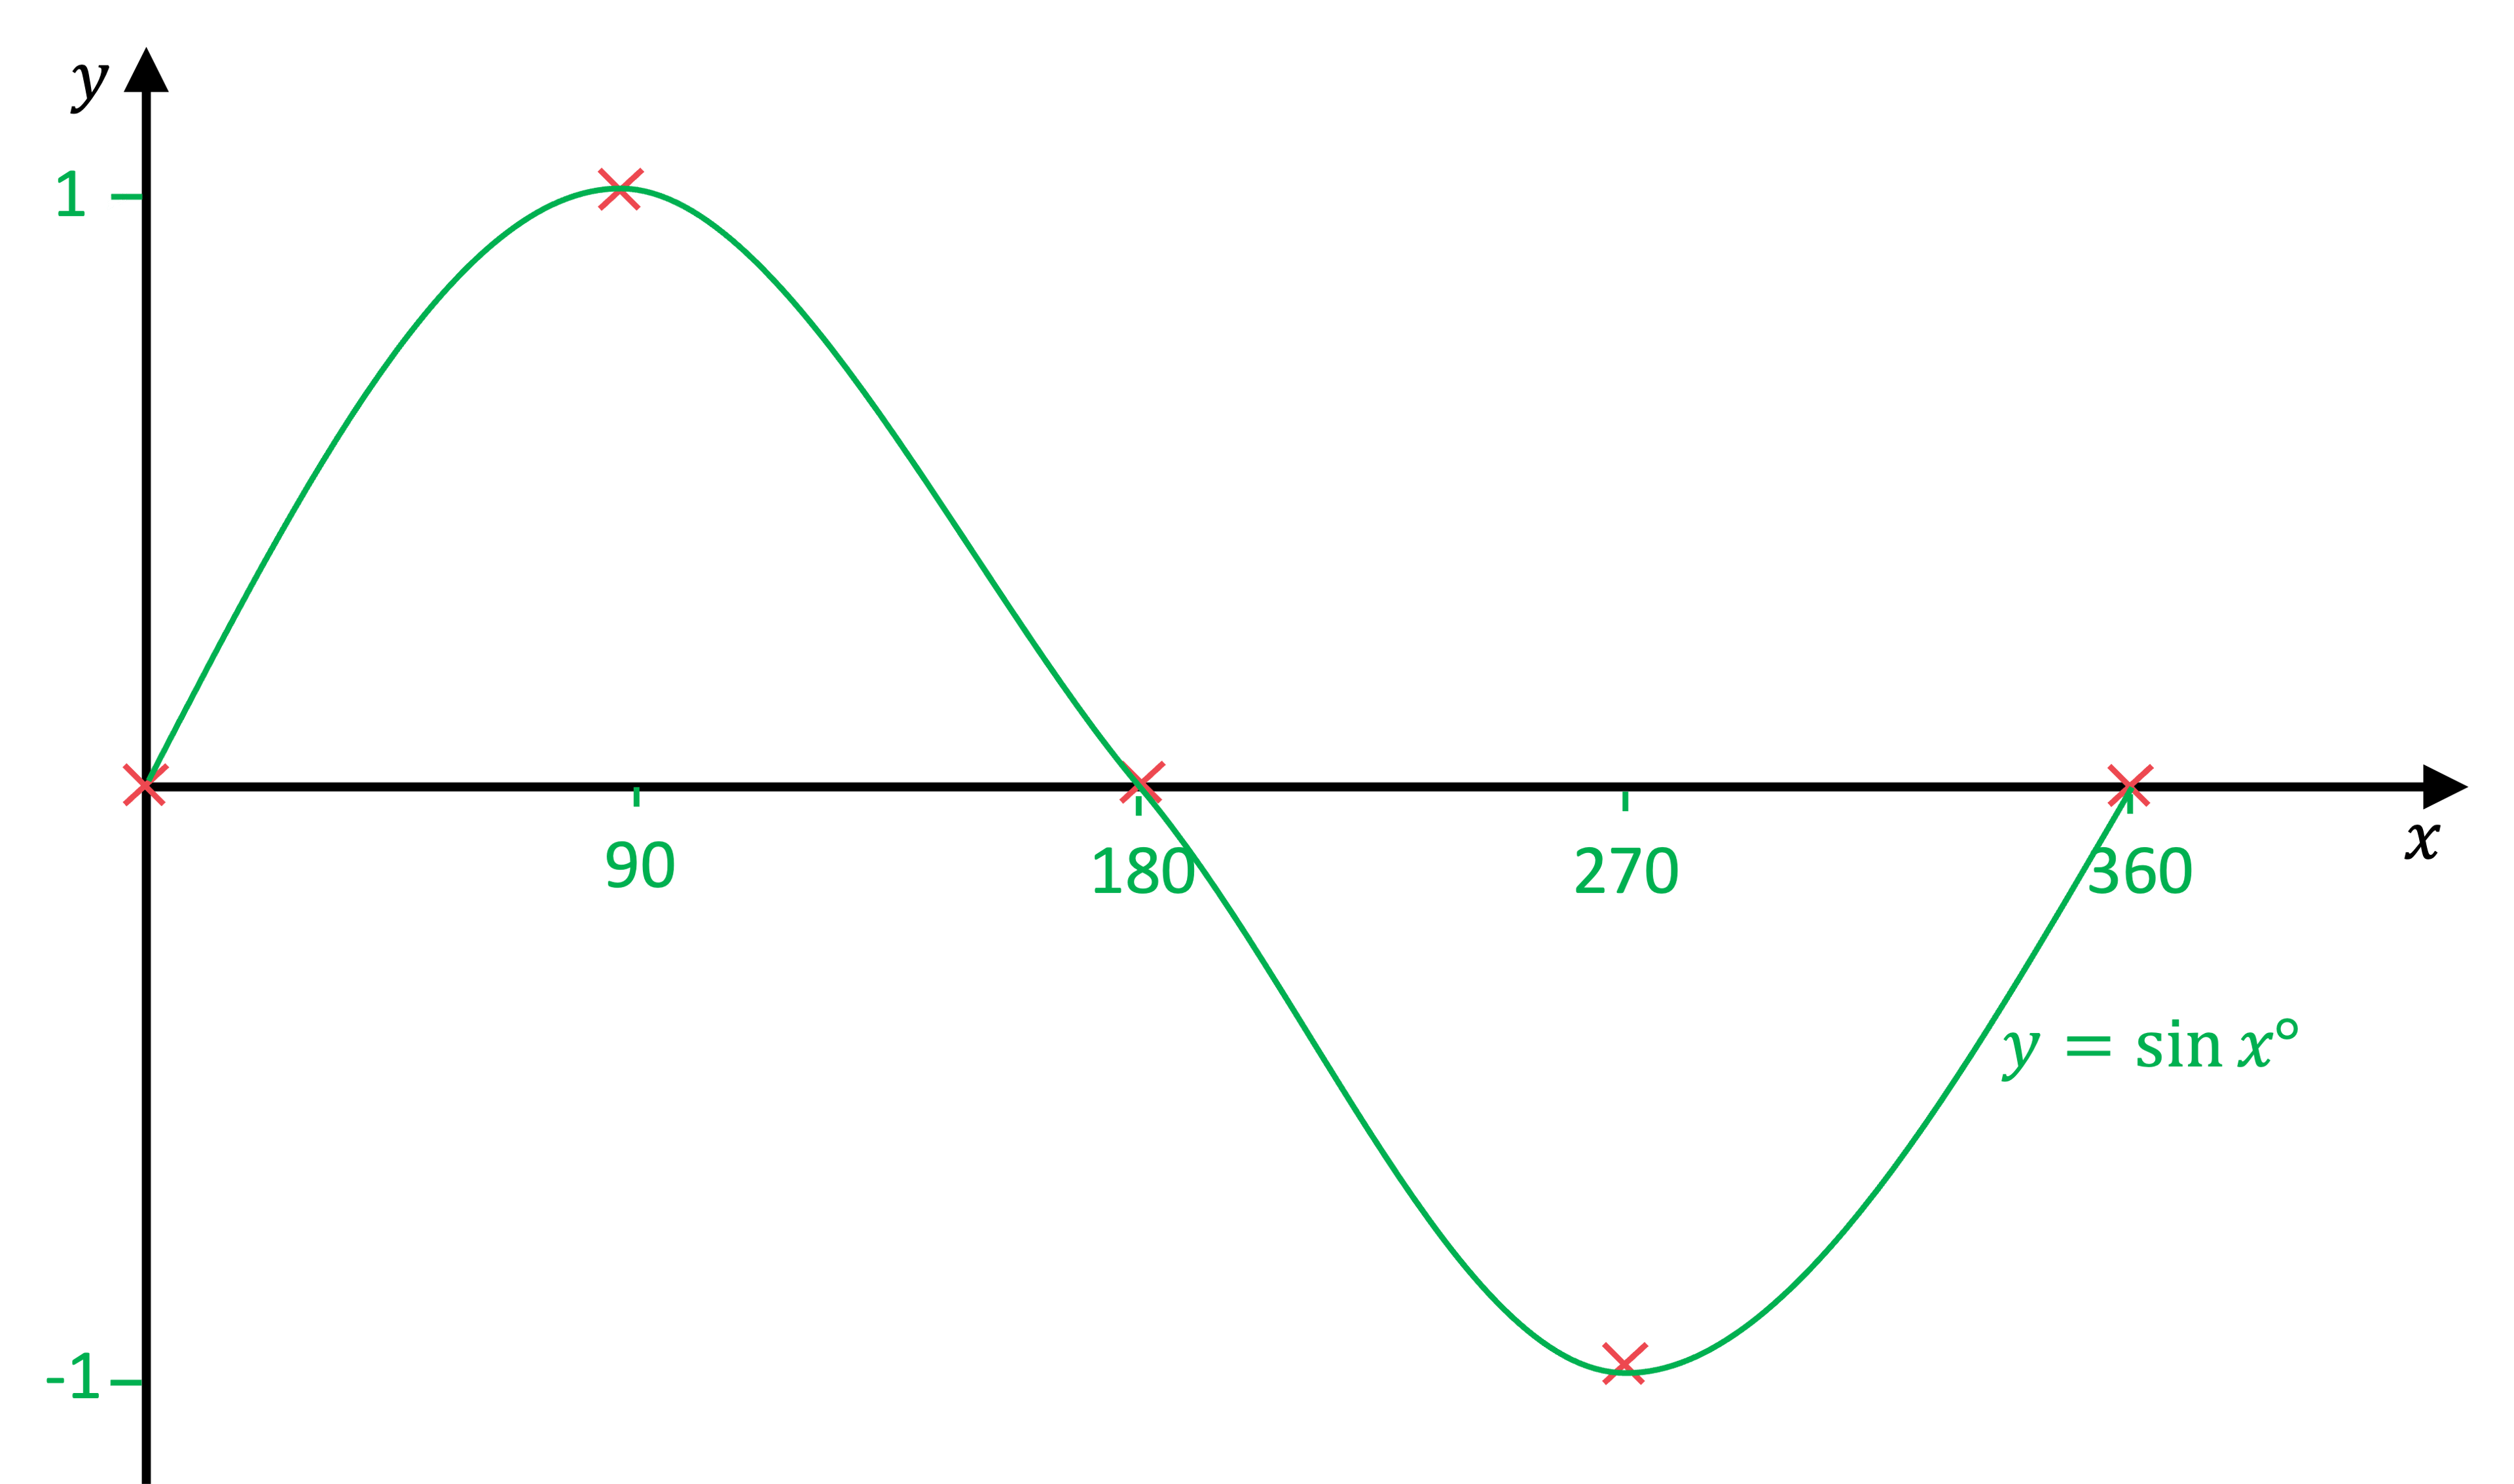
Mark key values on the axes provided; 1and −1 on the y-axis and 90, 180, 270 and 360 on the x-axis
Try to space them evenly apart but also remember this is a sketch!
![]() starts at (0, 0) then every 90° it cycles though 1, 0 , −1, 0, ...
starts at (0, 0) then every 90° it cycles though 1, 0 , −1, 0, ...
Mark these points on the axes
Finally, join the points with a smooth curve
You will get better at this with practice but again remember it is a sketch so do not spend ages making it look perfect!
It is best practice to label the curve with its equation
Properties of trigonometric graphs
What is meant by the properties of trigonometric graphs?
Properties refers to any special features or patterns
The graphs
format('truetype')%3Bfont-weight%3Anormal%3Bfont-style%3Anormal%3B%7D%3C%2Fstyle%3E%3C%2Fdefs%3E%3Ctext%20font-family%3D%22Times%20New%20Roman%22%20font-size%3D%2218%22%20font-style%3D%22italic%22%20text-anchor%3D%22middle%22%20x%3D%224.5%22%20y%3D%2216%22%3Ey%3C%2Ftext%3E%3Ctext%20font-family%3D%22math10ebb3c113d02fd51a017c38df2%22%20font-size%3D%2216%22%20text-anchor%3D%22middle%22%20x%3D%2218.5%22%20y%3D%2216%22%3E%3D%3C%2Ftext%3E%3Ctext%20font-family%3D%22Times%20New%20Roman%22%20font-size%3D%2218%22%20text-anchor%3D%22middle%22%20x%3D%2237.5%22%20y%3D%2216%22%3Esin%3C%2Ftext%3E%3Ctext%20font-family%3D%22Times%20New%20Roman%22%20font-size%3D%2218%22%20font-style%3D%22italic%22%20text-anchor%3D%22middle%22%20x%3D%2256.5%22%20y%3D%2216%22%3Ex%3C%2Ftext%3E%3Ctext%20font-family%3D%22math10ebb3c113d02fd51a017c38df2%22%20font-size%3D%2216%22%20text-anchor%3D%22middle%22%20x%3D%2264.5%22%20y%3D%2216%22%3E%2C%3C%2Ftext%3E%3Ctext%20font-family%3D%22Times%20New%20Roman%22%20font-size%3D%2218%22%20font-style%3D%22italic%22%20text-anchor%3D%22middle%22%20x%3D%2275.5%22%20y%3D%2216%22%3Ey%3C%2Ftext%3E%3Ctext%20font-family%3D%22math10ebb3c113d02fd51a017c38df2%22%20font-size%3D%2216%22%20text-anchor%3D%22middle%22%20x%3D%2289.5%22%20y%3D%2216%22%3E%3D%3C%2Ftext%3E%3Ctext%20font-family%3D%22Times%20New%20Roman%22%20font-size%3D%2218%22%20text-anchor%3D%22middle%22%20x%3D%22110.5%22%20y%3D%2216%22%3Ecos%3C%2Ftext%3E%3Ctext%20font-family%3D%22Times%20New%20Roman%22%20font-size%3D%2218%22%20font-style%3D%22italic%22%20text-anchor%3D%22middle%22%20x%3D%22130.5%22%20y%3D%2216%22%3Ex%3C%2Ftext%3E%3C%2Fsvg%3E) and
and format('truetype')%3Bfont-weight%3Anormal%3Bfont-style%3Anormal%3B%7D%3C%2Fstyle%3E%3C%2Fdefs%3E%3Ctext%20font-family%3D%22Times%20New%20Roman%22%20font-size%3D%2218%22%20font-style%3D%22italic%22%20text-anchor%3D%22middle%22%20x%3D%224.5%22%20y%3D%2216%22%3Ey%3C%2Ftext%3E%3Ctext%20font-family%3D%22math17f39f8317fbdb1988ef4c628eb%22%20font-size%3D%2216%22%20text-anchor%3D%22middle%22%20x%3D%2218.5%22%20y%3D%2216%22%3E%3D%3C%2Ftext%3E%3Ctext%20font-family%3D%22Times%20New%20Roman%22%20font-size%3D%2218%22%20text-anchor%3D%22middle%22%20x%3D%2238.5%22%20y%3D%2216%22%3Etan%3C%2Ftext%3E%3Ctext%20font-family%3D%22Times%20New%20Roman%22%20font-size%3D%2218%22%20font-style%3D%22italic%22%20text-anchor%3D%22middle%22%20x%3D%2257.5%22%20y%3D%2216%22%3Ex%3C%2Ftext%3E%3C%2Fsvg%3E) are all periodic
are all periodicThis means their graphs/curves repeat every so often
The frequency (rate) at which they repeat is called the period
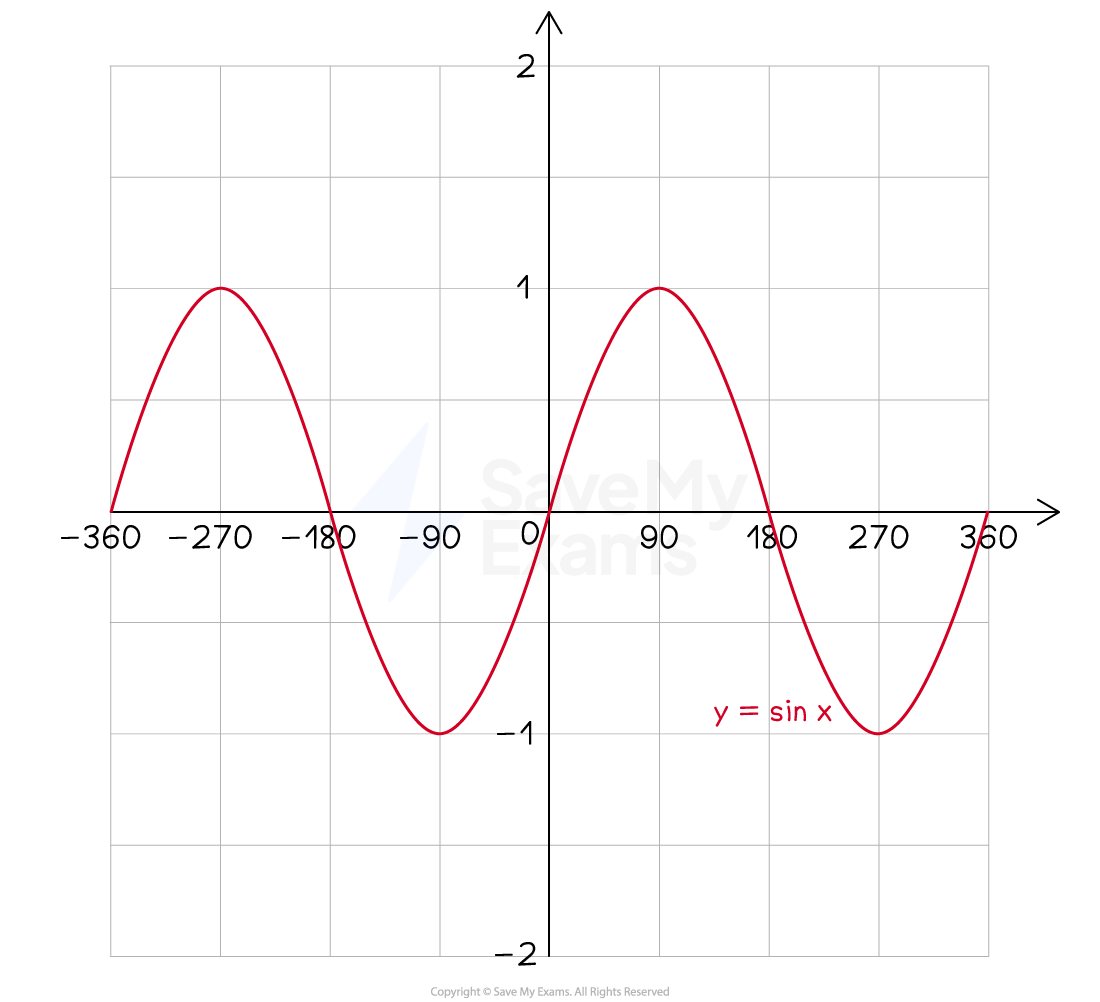
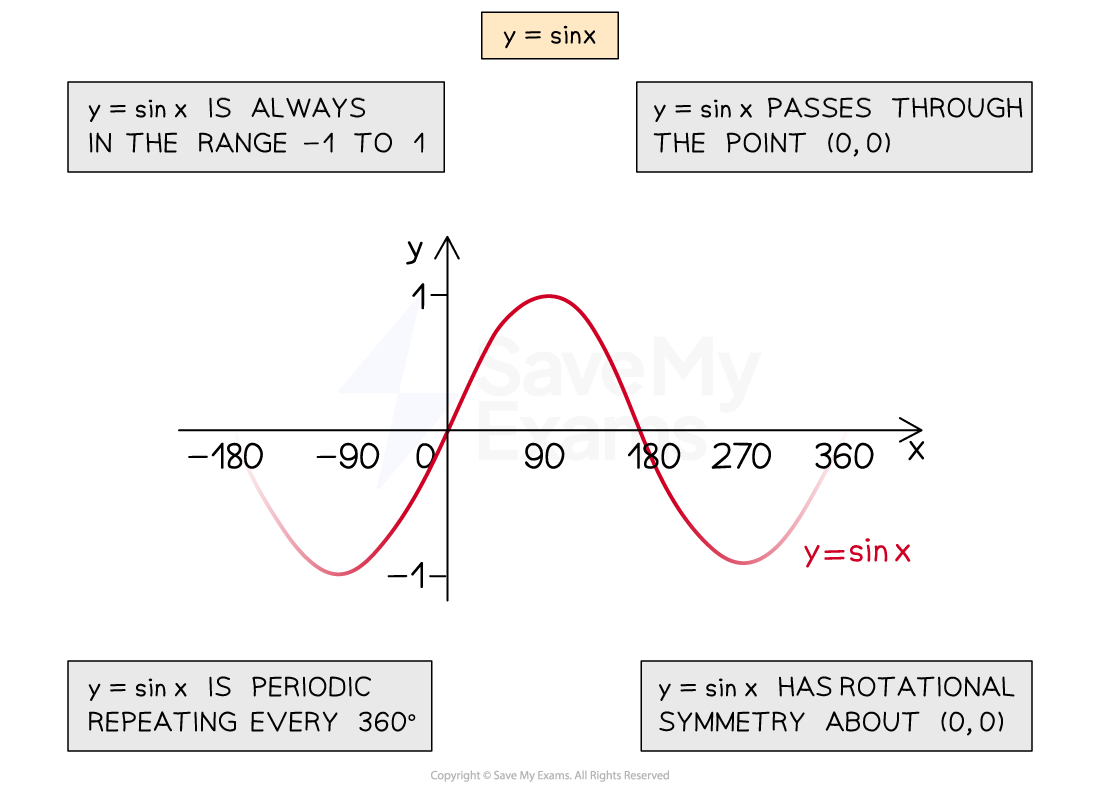
What are the properties of the graph y = sin x?
Angles will always be on the x-axis
Values of sine run between -1 and 1
So the y-axis will only need to run between -1 and 1
You may see this referred to as the range of
format('truetype')%3Bfont-weight%3Anormal%3Bfont-style%3Anormal%3B%7D%3C%2Fstyle%3E%3C%2Fdefs%3E%3Ctext%20font-family%3D%22Times%20New%20Roman%22%20font-size%3D%2218%22%20font-style%3D%22italic%22%20text-anchor%3D%22middle%22%20x%3D%224.5%22%20y%3D%2216%22%3Ey%3C%2Ftext%3E%3Ctext%20font-family%3D%22math17f39f8317fbdb1988ef4c628eb%22%20font-size%3D%2216%22%20text-anchor%3D%22middle%22%20x%3D%2218.5%22%20y%3D%2216%22%3E%3D%3C%2Ftext%3E%3Ctext%20font-family%3D%22Times%20New%20Roman%22%20font-size%3D%2218%22%20text-anchor%3D%22middle%22%20x%3D%2237.5%22%20y%3D%2216%22%3Esin%3C%2Ftext%3E%3Ctext%20font-family%3D%22Times%20New%20Roman%22%20font-size%3D%2218%22%20font-style%3D%22italic%22%20text-anchor%3D%22middle%22%20x%3D%2256.5%22%20y%3D%2216%22%3Ex%3C%2Ftext%3E%3C%2Fsvg%3E) (
(format('truetype')%3Bfont-weight%3Anormal%3Bfont-style%3Anormal%3B%7D%3C%2Fstyle%3E%3C%2Fdefs%3E%3Ctext%20font-family%3D%22math1ca1a29523a31a98778ef30b146%22%20font-size%3D%2216%22%20text-anchor%3D%22middle%22%20x%3D%226.5%22%20y%3D%2216%22%3E%26%23x2212%3B%3C%2Ftext%3E%3Ctext%20font-family%3D%22Times%20New%20Roman%22%20font-size%3D%2218%22%20text-anchor%3D%22middle%22%20x%3D%2217.5%22%20y%3D%2216%22%3E1%3C%2Ftext%3E%3Ctext%20font-family%3D%22math1ca1a29523a31a98778ef30b146%22%20font-size%3D%2216%22%20text-anchor%3D%22middle%22%20x%3D%2230.5%22%20y%3D%2216%22%3E%26%23x2264%3B%3C%2Ftext%3E%3Ctext%20font-family%3D%22Times%20New%20Roman%22%20font-size%3D%2218%22%20font-style%3D%22italic%22%20text-anchor%3D%22middle%22%20x%3D%2242.5%22%20y%3D%2216%22%3Ey%3C%2Ftext%3E%3Ctext%20font-family%3D%22math1ca1a29523a31a98778ef30b146%22%20font-size%3D%2216%22%20text-anchor%3D%22middle%22%20x%3D%2256.5%22%20y%3D%2216%22%3E%26%23x2264%3B%3C%2Ftext%3E%3Ctext%20font-family%3D%22Times%20New%20Roman%22%20font-size%3D%2218%22%20text-anchor%3D%22middle%22%20x%3D%2268.5%22%20y%3D%2216%22%3E1%3C%2Ftext%3E%3C%2Fsvg%3E) )
)
The graph
repeats every 360° (has period 360)The graph 'starts' at (0, 0) (but can have negative angles too)
'Something' happens every 90°
- cycles between 0, 1, 0, -1, 0, 1, 0, -1, ...
... every 90° starting at (0, 0)
Other properties of the the graph of
that can be helpful but do not crop up often include- has rotational symmetry around the origin
The graph has an amplitude of 1
Amplitude means the height of the sine graph above zero
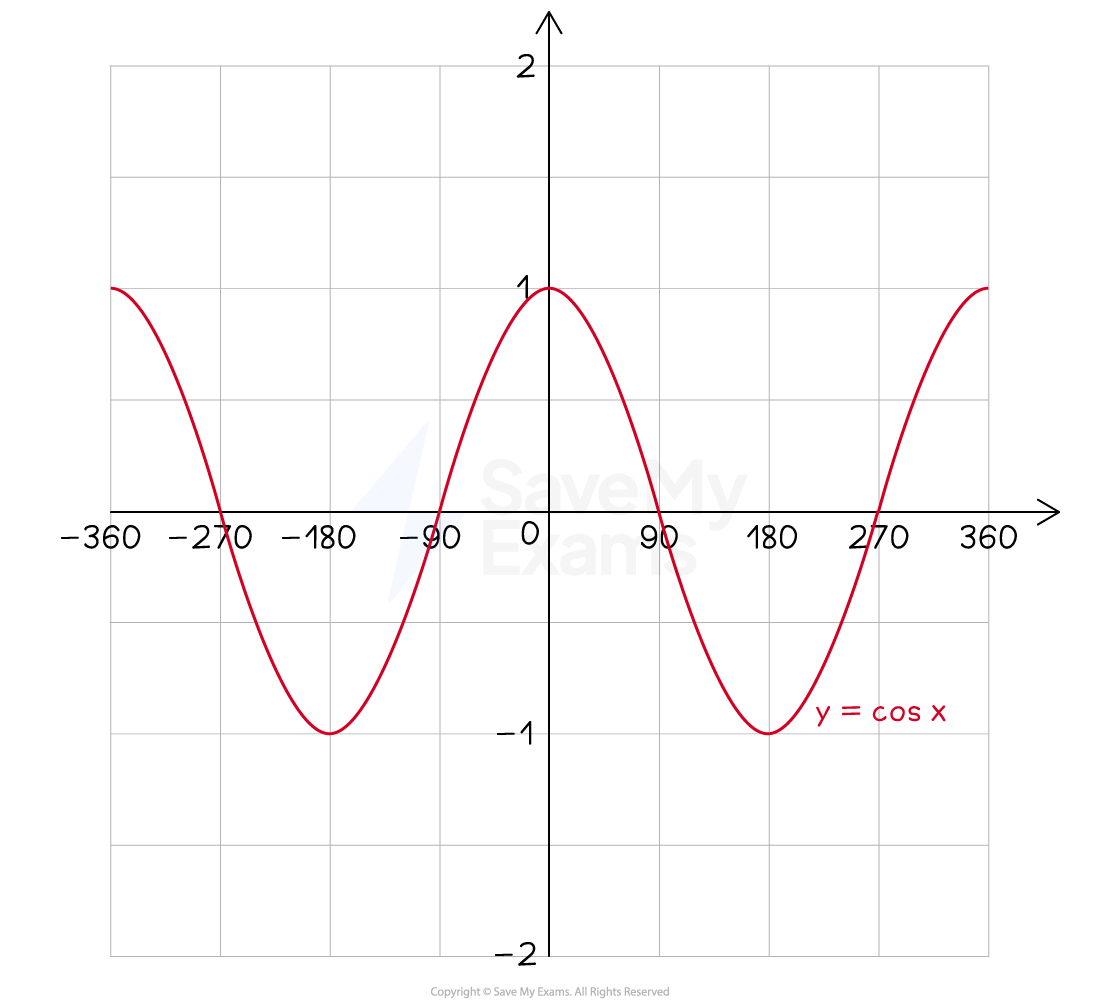
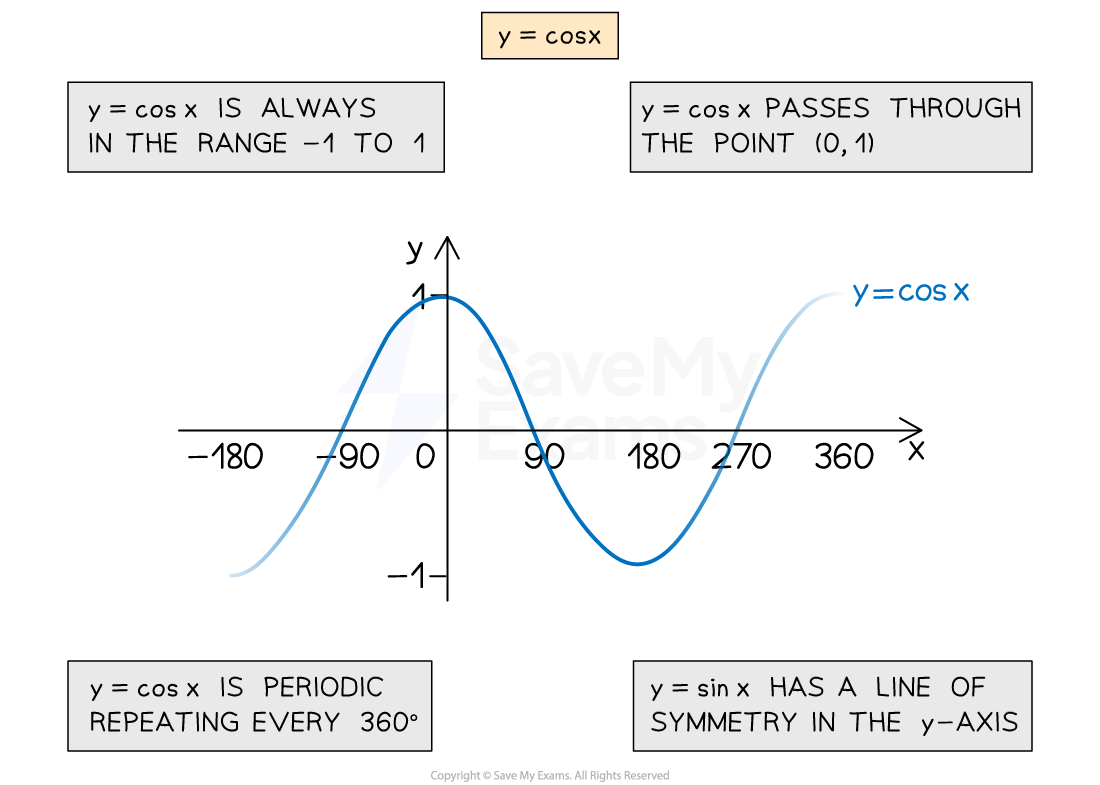
What are the properties of the graph y = cos x?
The graph of
format('truetype')%3Bfont-weight%3Anormal%3Bfont-style%3Anormal%3B%7D%3C%2Fstyle%3E%3C%2Fdefs%3E%3Ctext%20font-family%3D%22Times%20New%20Roman%22%20font-size%3D%2218%22%20font-style%3D%22italic%22%20text-anchor%3D%22middle%22%20x%3D%224.5%22%20y%3D%2216%22%3Ey%3C%2Ftext%3E%3Ctext%20font-family%3D%22math17f39f8317fbdb1988ef4c628eb%22%20font-size%3D%2216%22%20text-anchor%3D%22middle%22%20x%3D%2218.5%22%20y%3D%2216%22%3E%3D%3C%2Ftext%3E%3Ctext%20font-family%3D%22Times%20New%20Roman%22%20font-size%3D%2218%22%20text-anchor%3D%22middle%22%20x%3D%2239.5%22%20y%3D%2216%22%3Ecos%3C%2Ftext%3E%3Ctext%20font-family%3D%22Times%20New%20Roman%22%20font-size%3D%2218%22%20font-style%3D%22italic%22%20text-anchor%3D%22middle%22%20x%3D%2259.5%22%20y%3D%2216%22%3Ex%3C%2Ftext%3E%3C%2Fsvg%3E) is almost the same as the graph of
is almost the same as the graph of but it has a different starting point
at (0, 1)
Angles will always be on the x-axis
Values of cosine run between -1 and 1
So the y-axis will only need to run between -1 and 1
You may see this referred to as the range of
()
The graph
repeats every 360° (has period 360)The graph 'starts' at (0, 1) (but can have negative angles too)
'Something' happens every 90°
- cycles between 1, 0, -1, 0, 1, 0, -1, ...
... every 90° starting at (0, 1)
Other properties of the the graph of
that can be helpful but do not crop up often include- has a line of symmetry in the y-axis (the line with equation
format('truetype')%3Bfont-weight%3Anormal%3Bfont-style%3Anormal%3B%7D%3C%2Fstyle%3E%3C%2Fdefs%3E%3Ctext%20font-family%3D%22Times%20New%20Roman%22%20font-size%3D%2218%22%20font-style%3D%22italic%22%20text-anchor%3D%22middle%22%20x%3D%224.5%22%20y%3D%2216%22%3Ex%3C%2Ftext%3E%3Ctext%20font-family%3D%22math17f39f8317fbdb1988ef4c628eb%22%20font-size%3D%2216%22%20text-anchor%3D%22middle%22%20x%3D%2218.5%22%20y%3D%2216%22%3E%3D%3C%2Ftext%3E%3Ctext%20font-family%3D%22Times%20New%20Roman%22%20font-size%3D%2218%22%20text-anchor%3D%22middle%22%20x%3D%2231.5%22%20y%3D%2216%22%3E0%3C%2Ftext%3E%3C%2Fsvg%3E) )
) The graph has an amplitude of 1
Amplitude means the height of the cosine graph above zero
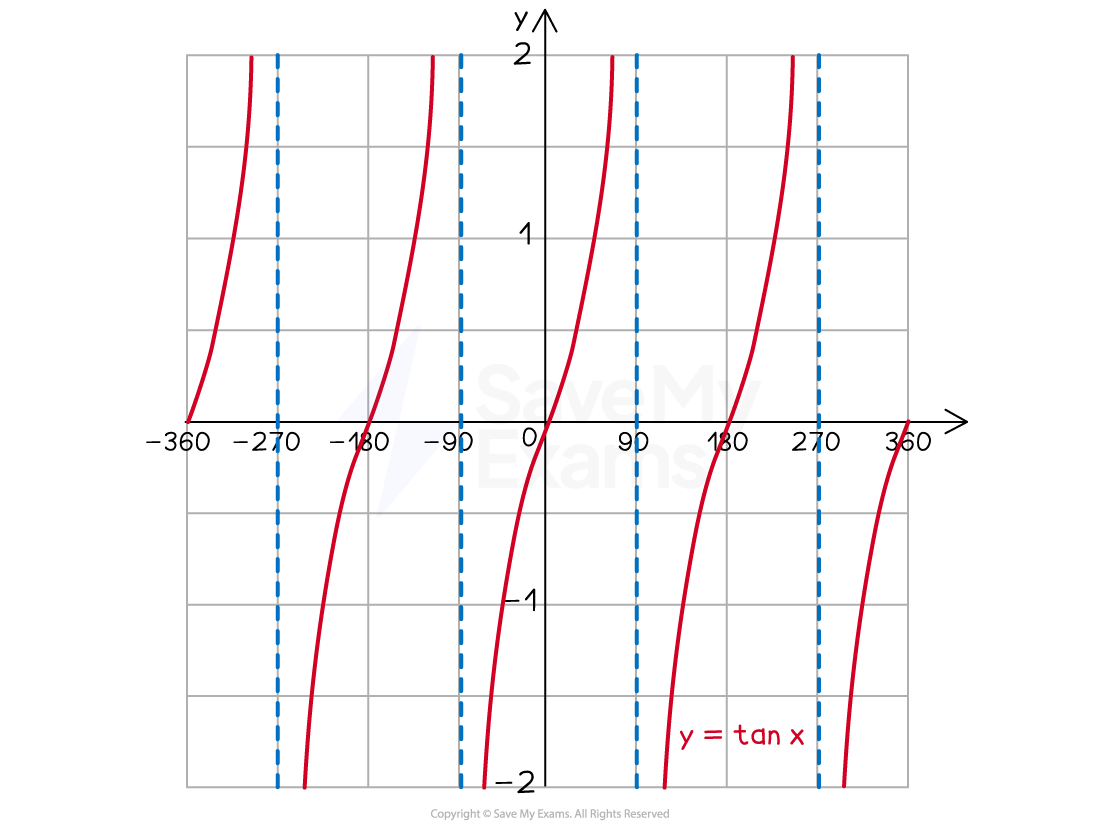
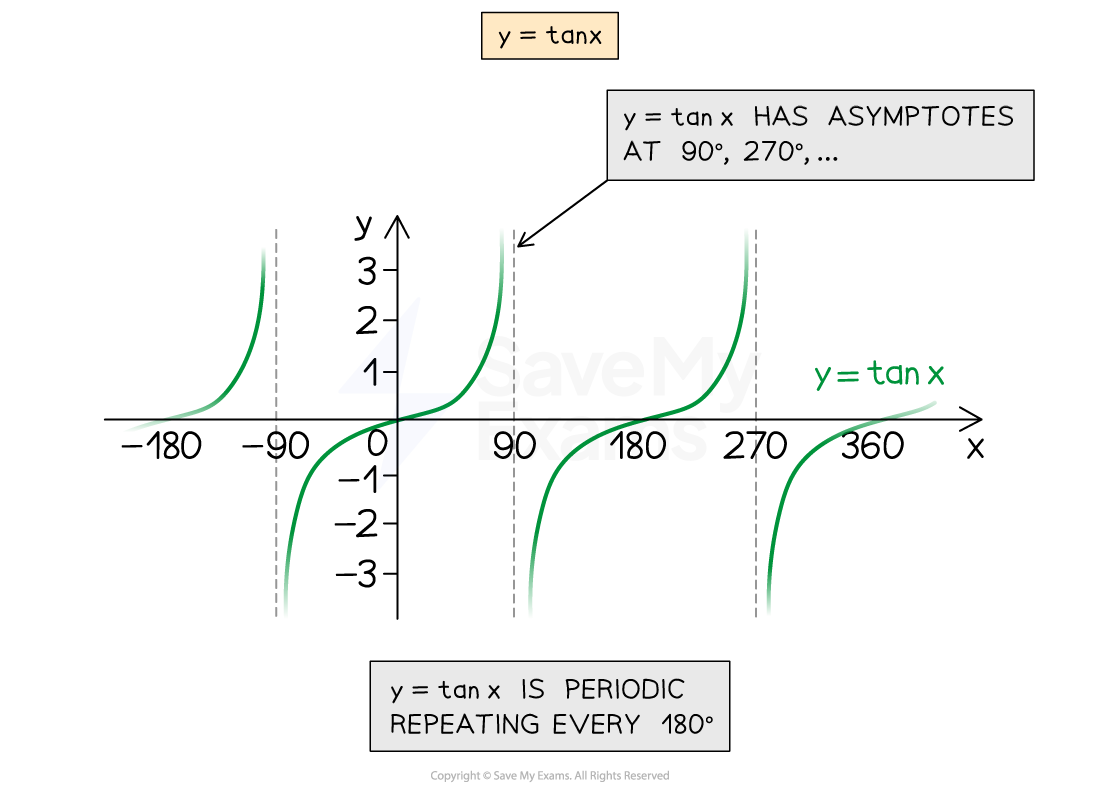
What are the properties of the graph of y = tan x?
Angles will always be on the x-axis
Values of tangent have no limit
So in general the y-axis will not need to have any labels on it
but a label referring to a particular value in a question may be helpful
The graph
repeats every 180° (has period 180)The graph 'starts' at (0, 0) (but can have negative angles too)
The graph has asymptotes (also known as discontinuities) which are vertical lines that the graph approaches
but never intersects (touches or crosses)
asymptotes are drawn as dotted vertical lines on graphs
the asymptote arises when trying to divide by zero (which is undefined)
'Something' happens every 90°
- cycles between 0, asymptote, 0, asymptote, 0, ...
... every 90° starting at (0, 0)
Other properties of the the graph of
that can be helpful but do not crop up often include- has rotational symmetry around the origin
Examiner Tips and Tricks
Sketch all three trig graphs on your exam paper so you can refer to them as many times as you need to!
Worked Example
The graph of ![]() between 0° and 360° passes through the point with coordinates
between 0° and 360° passes through the point with coordinates ![]() .
.
Using a symmetry argument, find the value of ![]() such that
such that ![]() is a different point on graph.
is a different point on graph.
Sketch the graph of y = sin x and mark on the point where x = 30 and y = 0.5

On the graph, mark on another point with the same y-height of 0.5
By symmetry of the curve between 0° and 180°, this will have an x-coordinate of 180 - 30
the coordinates are (180 - 30, 0.5)
The value of k is 180 - 30 = 150
k = 150

Unlock more, it's free!
Join the 100,000+ Students that ❤️ Save My Exams
the (exam) results speak for themselves:

Was this revision note helpful?
