Quadratic Inequalities (AQA GCSE Further Maths): Revision Note
Exam code: 8365

Solving quadratic inequalities
What are quadratic inequalities?
A quadratic inequality has the form
There is an term and any inequality sign,
They can usually be factorised
For example,
Solutions to quadratic inequalities are ranges of values
For example,
How do I solve a quadratic inequality?
Quadratic inequalities are solved by sketching a graph
The solutions then appears along the -axis
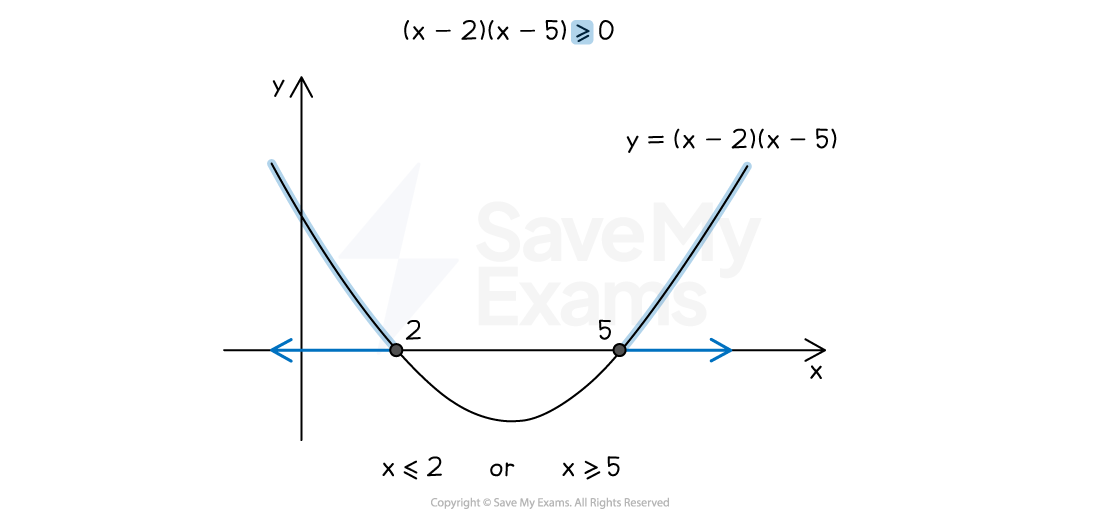
For example, to solve
Sketch the graph of
Show the -intercepts of 2 and 5
These come from solving
As the inequality is , shade any parts of the curve that are above the -axis
These are left of and right of
The solutions are the ranges on the -axis for those shaded parts
or
Use the word "or" for two separate parts
What do I do if the sign of the inequality changes?
If the quadratic inequality is where is positive
then shade the parts of the curve above the -axis
If the quadratic inequality is where is positive
then shade the part of the curve below the -axis
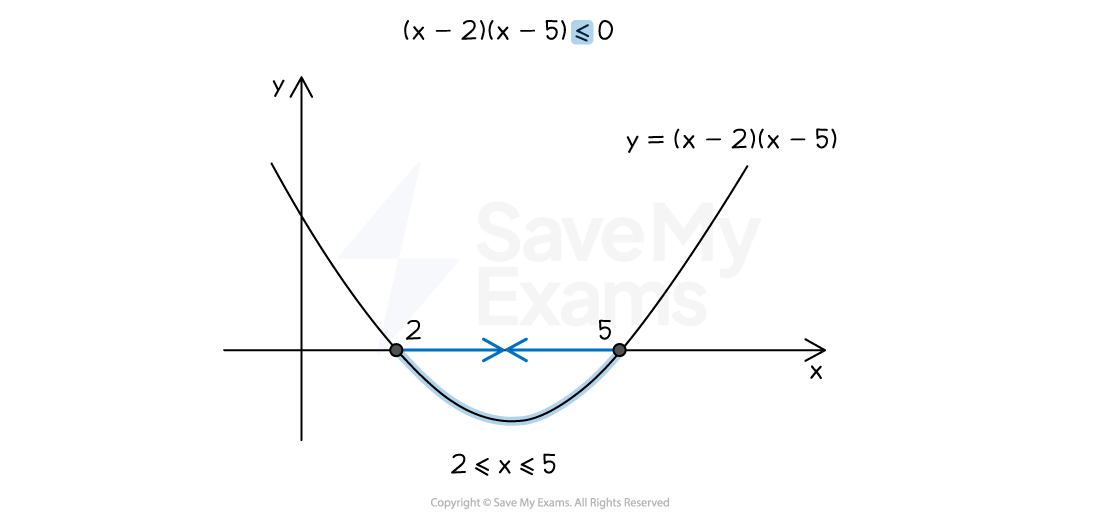
For example, to solve
Repeat the process above but shade where the curve is below the -axis
The solution is
(You do not use the word "or", but could say "and" )
If strict inequality signs are used, or
then you must use strict inequalities in your final answer
How can quadratic inequalities be made harder?
You may need to bring all the terms to one side first
For example becomes
It is easier to pick the side with a positive
You may have to factorise the quadratic inequality first
This may involve factorising
into double brackets
(the difference of two squares)
(factorising out an )
If it does not factorise, you may need the quadratic formula to find -intercepts
You may be given a quadratic inequality where is negative
This means the sketch will be an shape
For example, solve
The intercepts are found from giving
The same process is then applied, but the graph has an shape

Examiner Tips and Tricks
Think of inequalities with terms as graph-sketching questions in the exam.
Worked Example
Solve .
Bring all the terms to one side
It is easiest to use the left-hand side (giving a positive term)
Simplify the inequality by dividing both sides by 2
Factorise the quadratic expression on the left-hand side
Find the -intercepts of the graph
To do this, solve
gives or
Sketch (showing the -intercepts of -1 and 2)
The inequality is so shade the parts of the curve above the -axis
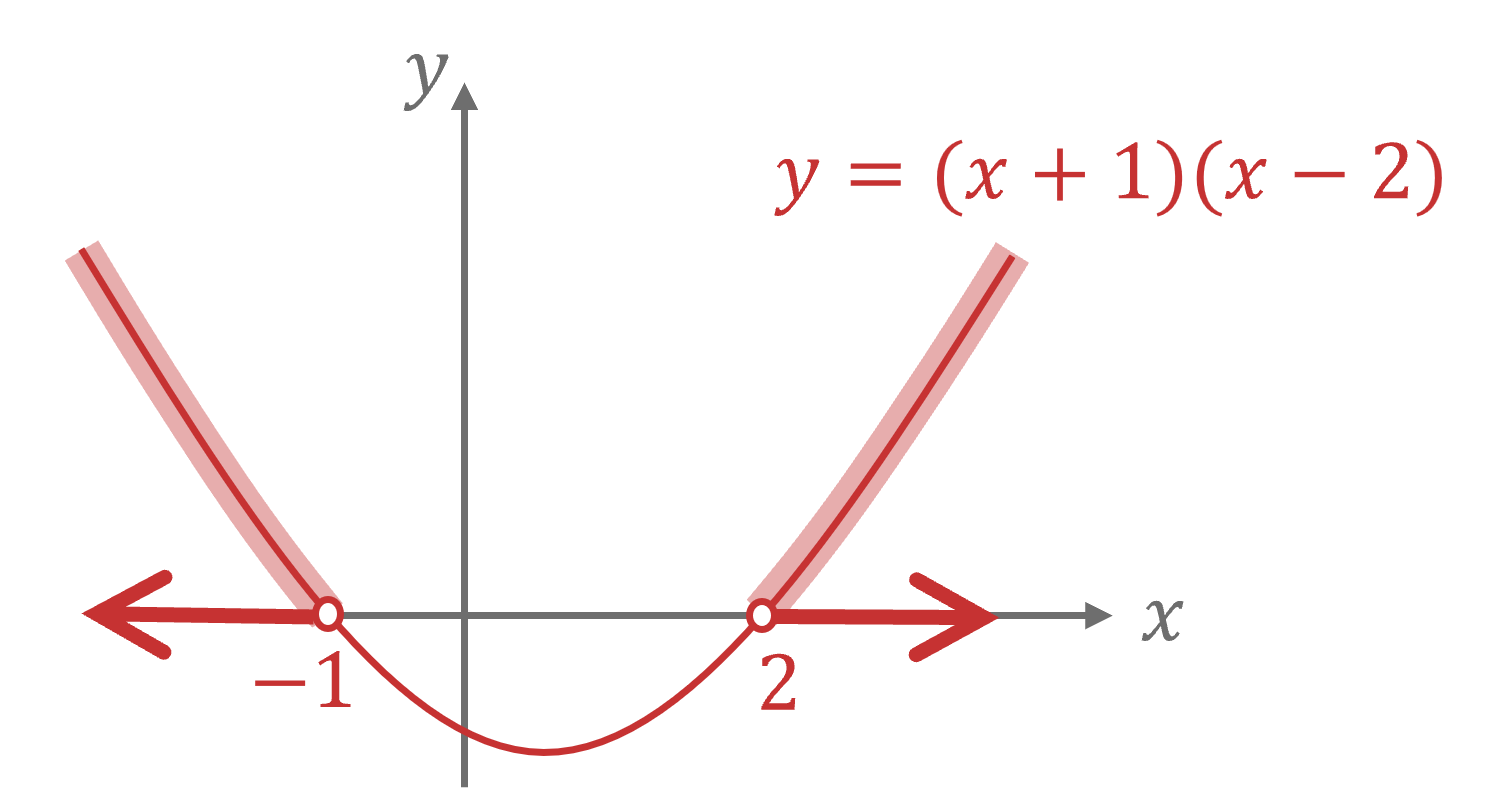
Write down the ranges on the -axis for the shaded parts above
Use the word "or" to separate the two solutions
or

Unlock more, it's free!
Join the 100,000+ Students that ❤️ Save My Exams
the (exam) results speak for themselves:

Was this revision note helpful?
Build on this topic
