Exponential Graphs (AQA GCSE Further Maths): Revision Note
Exam code: 8365

Exponential graphs
What is an exponential?
An exponential is a function where the power is a variable, usually
is an example of an exponential
In this course exponentials will be in either of the following forms
Where and are rational numbers, and is a variable
can be equal to 1, resulting in or
All of the following are examples of exponentials you may encounter
What does an exponential graph look like?
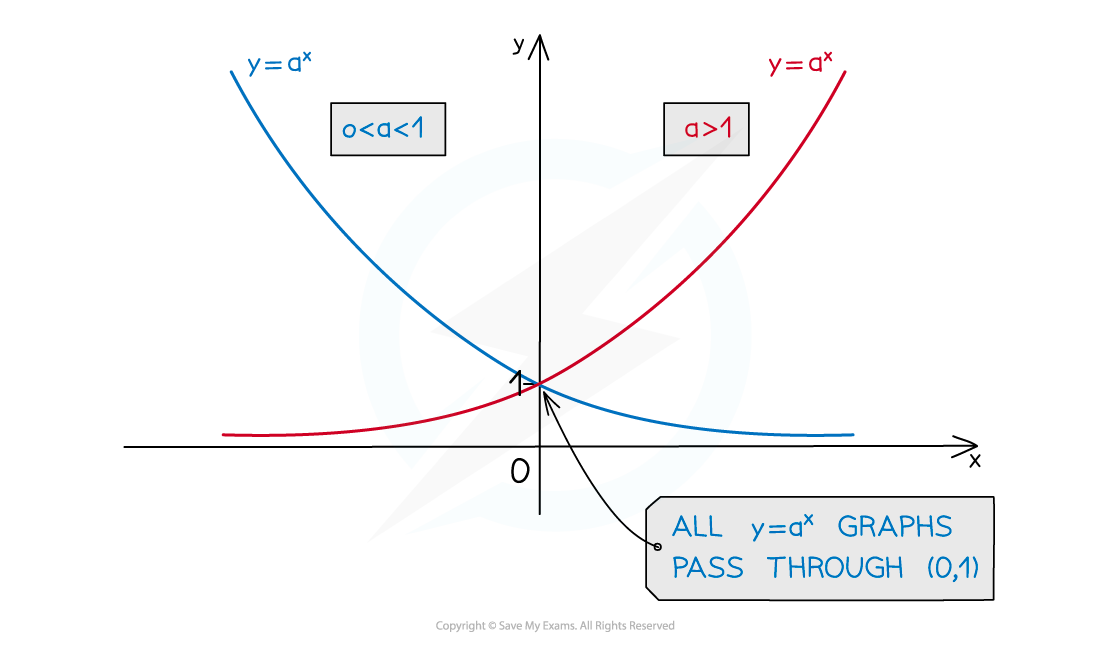
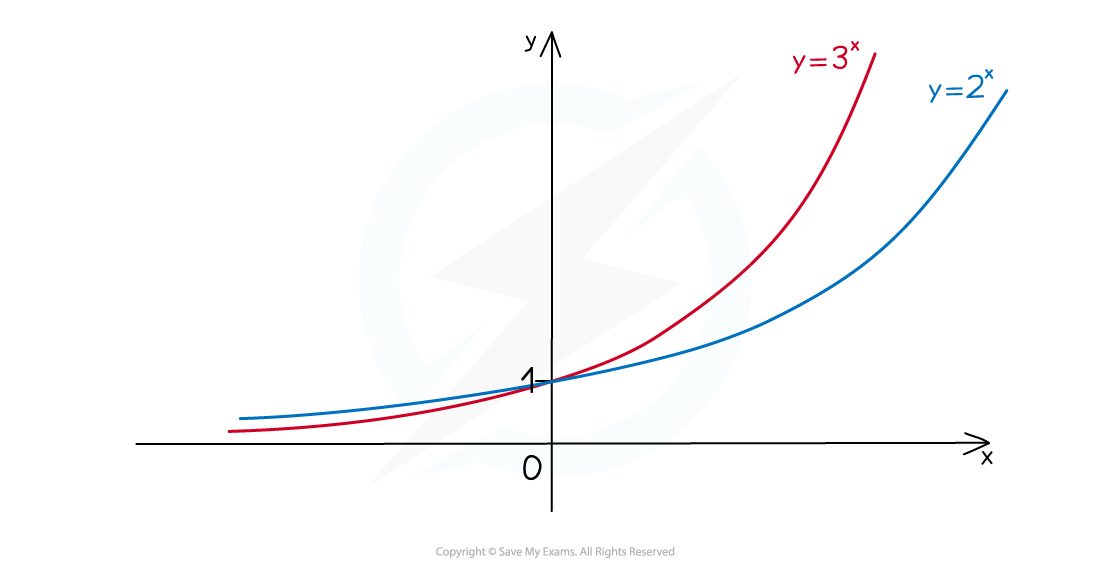
A graph of the form where is positive and larger than 1 will be increasing as increases
is increasing
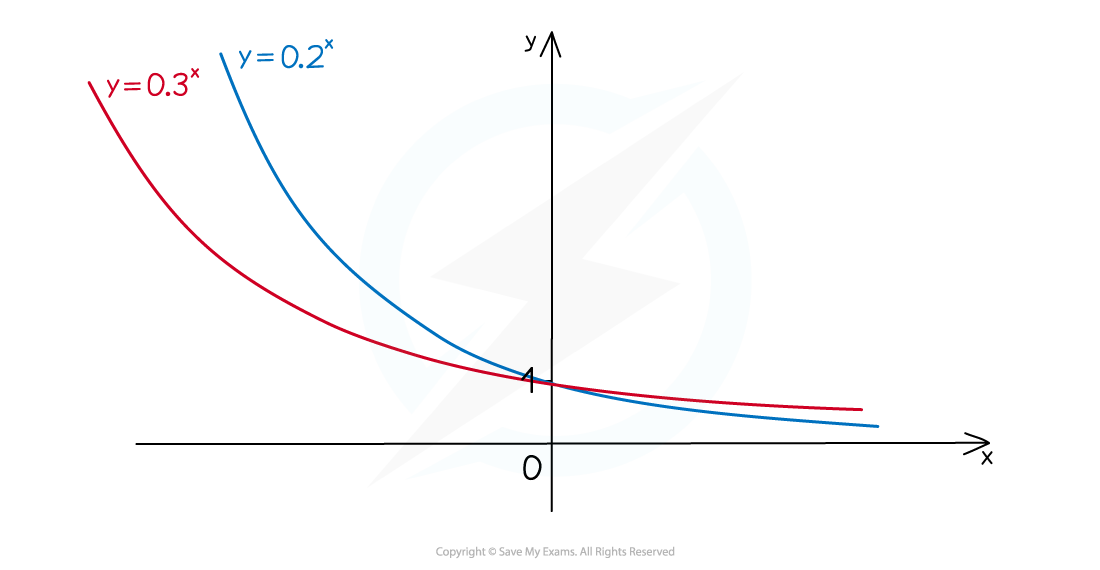
A graph of the form where is positive and larger than 1 will be decreasing as increases
is decreasing
If is between 0 and 1, then the opposite is true
is decreasing
is increasing
An equation of the form stretches the graph of vertically by scale factor
If is negative, then this would also reflect the graph in the -axis
The -intercept of and will be
You can show this by substituting into the equation
Substituting into or will reduce both to
This means that for an exponential in the form or , the -intercept will simply be (0,1)
The graphs do not cross the -axis anywhere
Exponential graphs do not have any minimum or maximum points
They are either always increasing, or always decreasing
How can I find the equation of an exponential graph?
A typical exam question may give you one or two co-ordinates that lie on a curve, and an approximate form for the equation of the graph
e.g. or
Remember that all co-ordinates on the curve must satisfy the equation
You can therefore substitute each coordinate into the given equation, and solve to find any unknown constants
Examiner Tips and Tricks
Remember that the intercept can often be found by inspection, which may save you some working
For or the -intercept is
For or the -intercept is
Worked Example
Here is a sketch of the curve where and are positive constants.
and lie on the curve.

Work out the values of and .
The value of can be found by inspection. The -intercept is (0, 6) so
The value of can be found by substituting the second coordinate into the equation and solving.
Solve to find .
must be positive, so disregard the negative value.

Unlock more, it's free!
Join the 100,000+ Students that ❤️ Save My Exams
the (exam) results speak for themselves:

Was this revision note helpful?
Build on this topic
