Shapes of Graphs (AQA GCSE Further Maths): Exam Questions

Exam code: 8365

48 mins14 questions
1a
Sme Calculator
1 mark

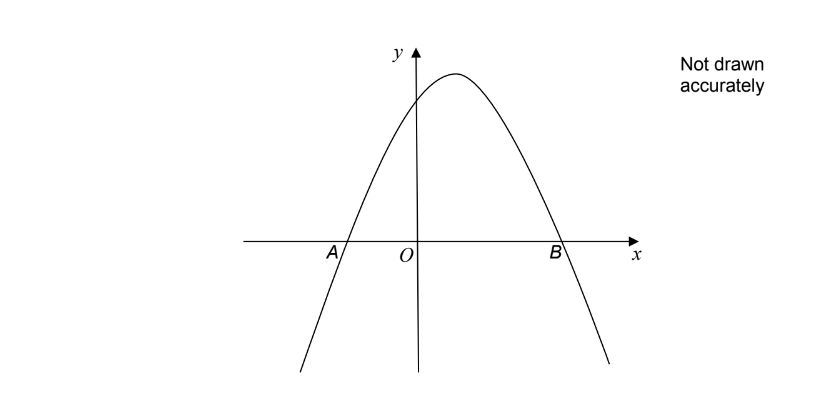
Here is a sketch of y=f(x) where f(x) is a quadratic function.

The graph

  • intersects the x-axis at A(1, 0) and B

  • has a maximum point at (0.5, 6)

q5-paper2-spec2020-aqa-gcse-furthermaths

Work out the coordinates of B.

1b
Sme Calculator
1 mark

The equation f(x)=k has exactly one solution.

Write down the value of k.

2a
Sme Calculator
2 marks

Here is a sketch of y=kx   where   k>0

A(2, 3116) is a point on the curve.

q13-paper1-nov2021-aqa-gcse-furthermaths

Work out the value of k.

2b
Sme Calculator
1 mark

B is a point on the curve with x-coordinate 1

Work out the y-coordinate of B.

3a
Sme Calculator
1 mark

The function   f(x)=x24x+1   has domain  1x5   

Here is the graph of   y=f(x)

qp2-2016-paper-2-aqa-gcse-further-maths

Write down the equation of the line of symmetry of the graph.

3b
Sme Calculator
2 marks

Use the graph to work out the solutions of   x24x+1=5

Give your answers to 1 decimal place.

4
Sme Calculator
3 marks

Here is the graph of y=x26x+5 for values of x between 0 and 6

q17-paper1-nov2021-aqa-gcse-furthermaths

By drawing a suitable linear graph on the grid, work out approximate solutions to

x27x+9=0

5
Sme Calculator
2 marks

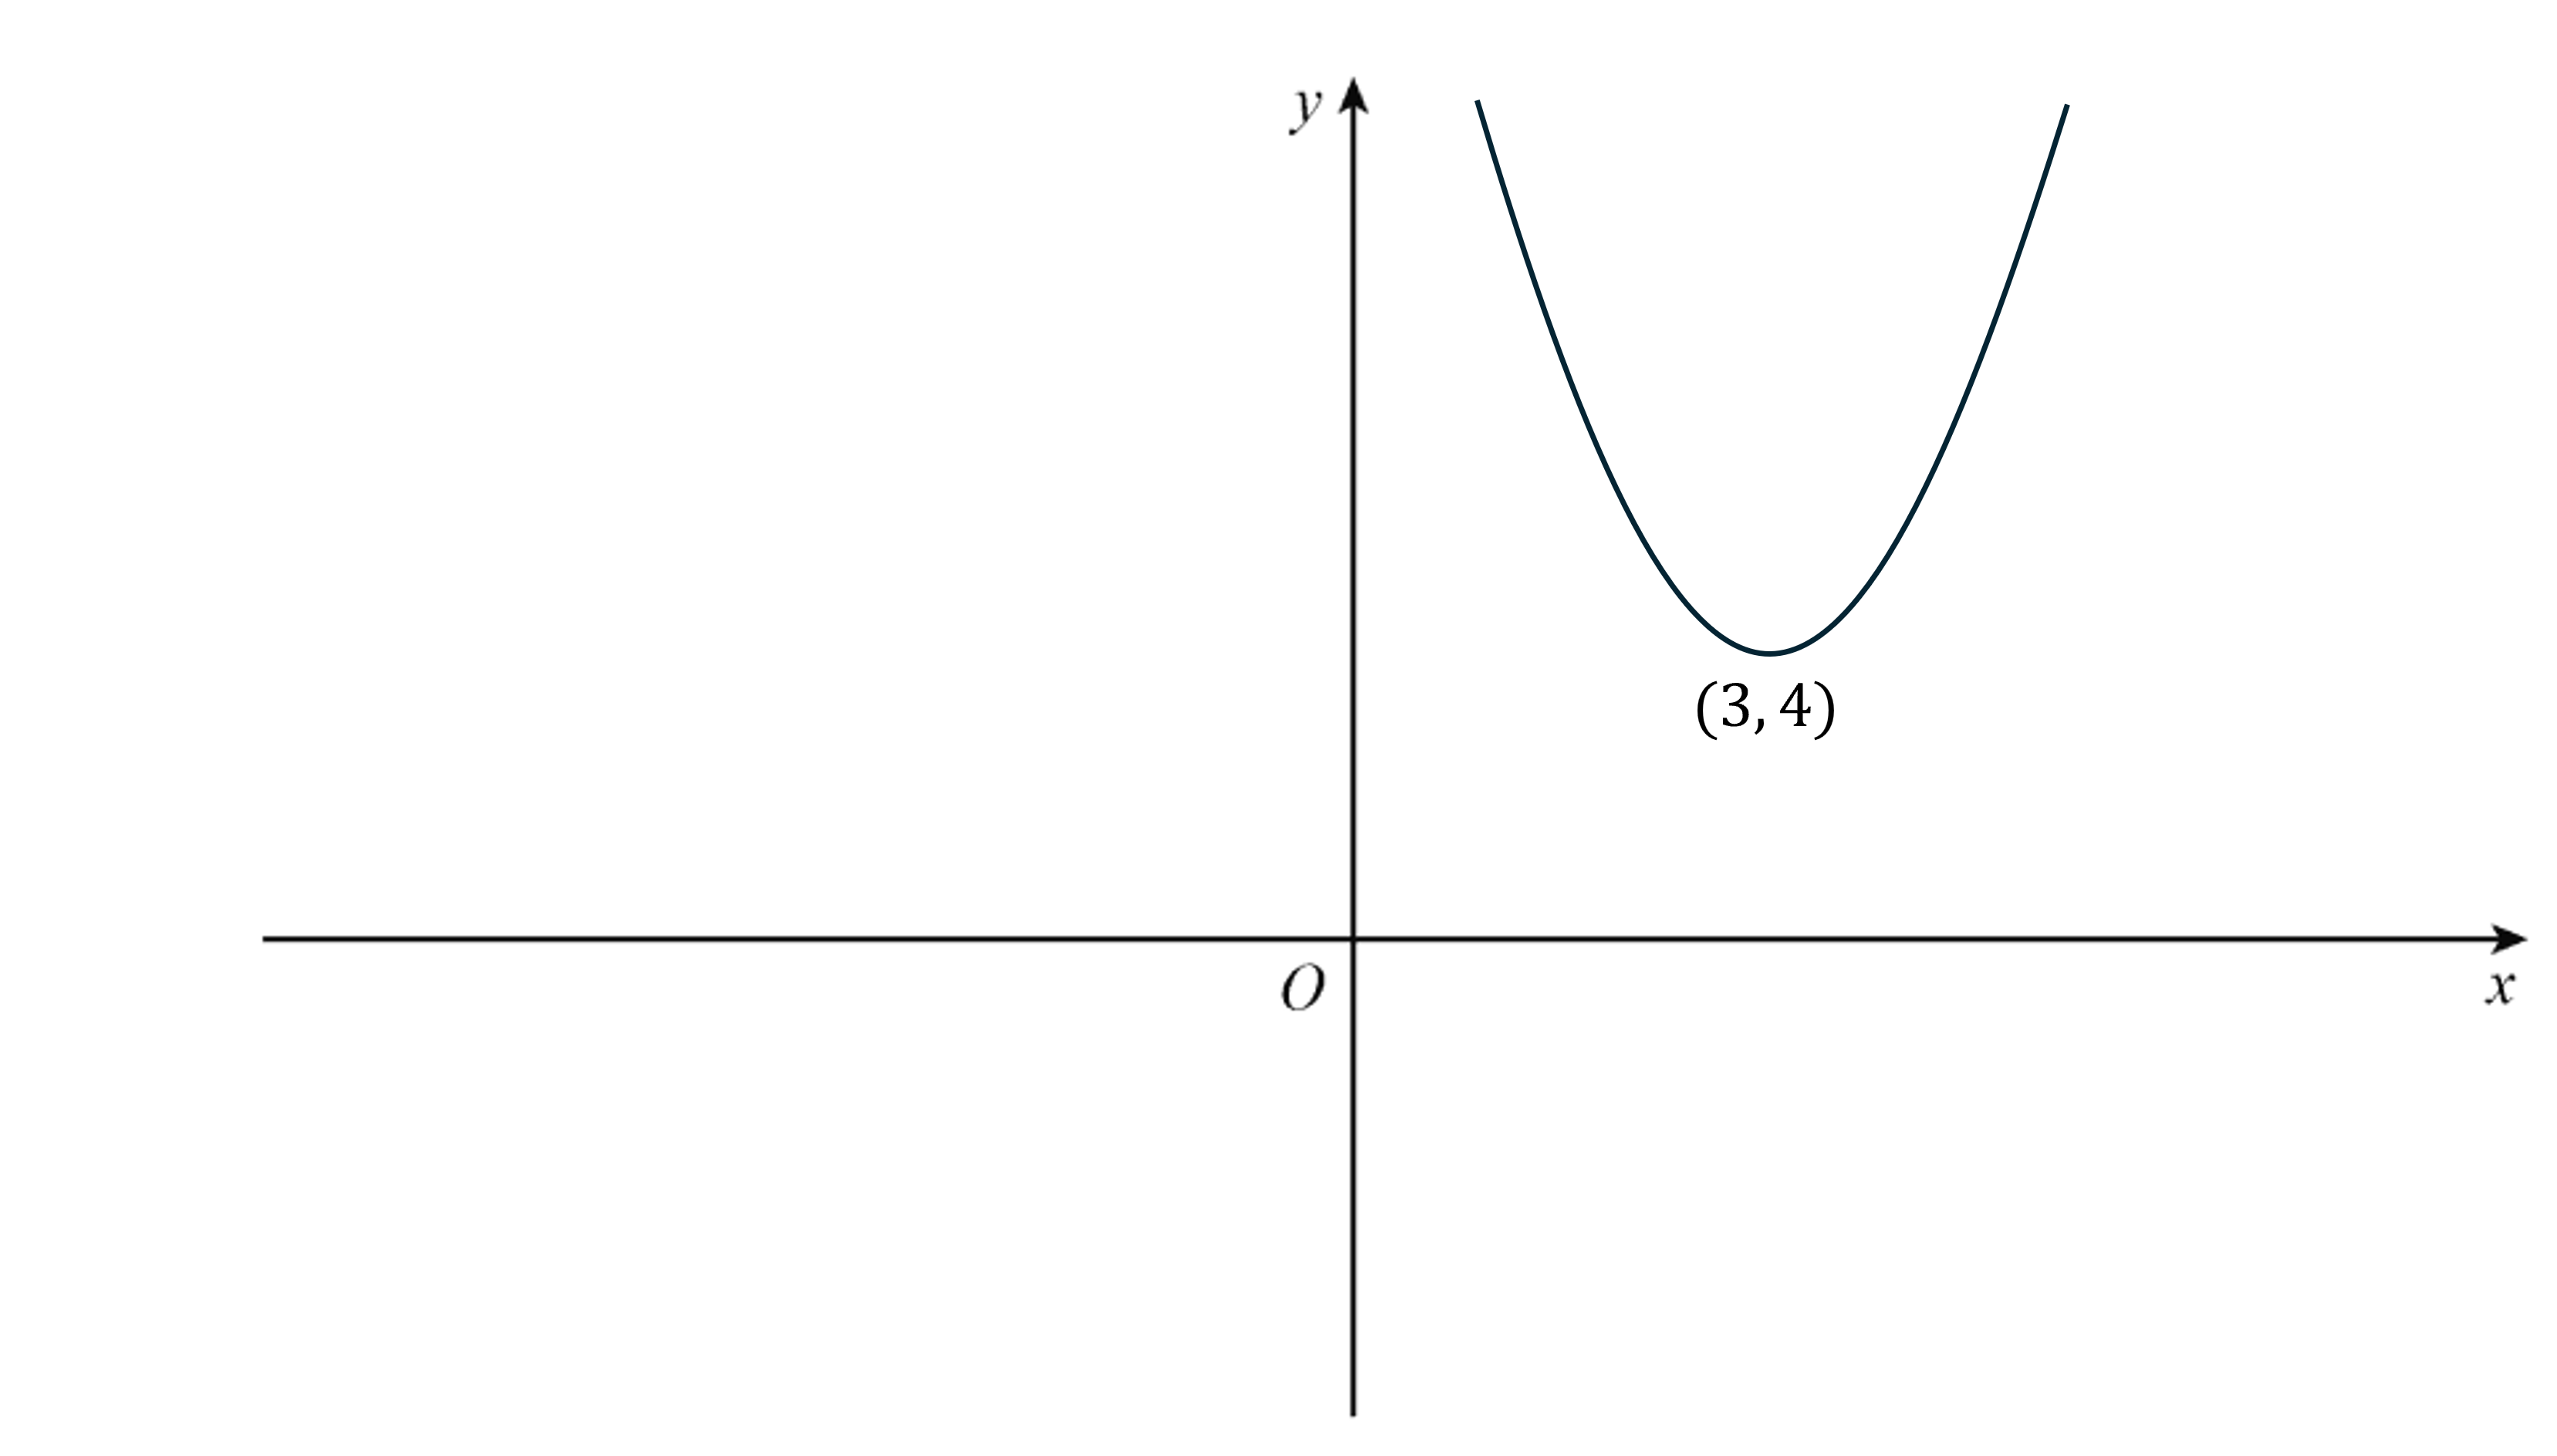
The graph shown has the equation y=(x+p)2+q

It has a stationary point at  (3, 4)

Graph of a quadratic parabola opening upwards, vertex at point (3, 4), on Cartesian plane with labelled axes x and y.

Work out the values of p and q.

6
Sme Calculator
3 marks

The curve y=2x33x212x+6

      has a maximum point at L (1, 13)

      has a minimum point at M (2, 14)

      intersects the y-axis at N.

The curve crosses the x-axis at three distinct points.

On the axes below, sketch the curve.

Label the points L, M and Non your sketch.

q8-paper1-spec2018-aqa-gcse-furthermaths
1
Sme Calculator
4 marks

Here is a sketch of the curve  y=abx where a and b are positive constants.

(0, 3) and (2, 0.48) lie on the curve.

q15-paper2-spec2020-aqa-gcse-furthermaths

Work out the values of a and b.

a = ...............................    

b = ...............................

2a
Sme Calculator
2 marks

Here is a sketch of the curve y=(2x+3)(x2)

The curve intersects the x-axis at A and B.

qp6-2019-paper-2-aqa-gcse-further-maths

Complete the coordinates of A and B.

A (...... , 0 )    B (....... , 0 )

2b
Sme Calculator
1 mark

Write down the range of values for x for which   (2x+3)(x2)<0

3
Sme Calculator
4 marks

Here is the graph of  y=3xx2 for values of x from 1 to 4

qp15-2018-paper-1-aqa-gcse-further-maths

By drawing a suitable linear graph on the grid, work out approximate solutions to

x24x+2=0

4
Sme Calculator
4 marks

Here is a sketch of  y=a+bx2x2  where a and b are constants.

The graph intersects the x-axis at (1, 0) and (72, 0) and the y-axis at point P.

qp13-2016-paper-2-aqa-gcse-further-maths

Work out the coordinates of point P.

You must show your working.

5
Sme Calculator
5 marks

The graph of y=(xp)(x5p) is shown, where p>0.

Graph showing a quadratic parabola opening upwards with its vertex in the bottom right quadrant on a Cartesian plane featuring x and y axes.

The line y=1 intersects the graph exactly once.

Find the value of p.

1
Sme Calculator
4 marks

y=f(x) is a cubic curve with a maximum and a minimum stationary point.

dydx=x2+2x3

The y-coordinate of the minimum point is  213.

The y-coordinate of the maximum point is  13.

(0, 4) is a point on the curve.

The tangent at (0, 4) has a negative gradient.

Sketch the curve on the grid below and show the coordinates of the stationary points.

2
Sme Calculator
3 marks

The continuous curve y=g(x)  has exactly two stationary points.

The stationary points are

  • a maximum point at P(3a, b) where a>0 and b<0

  •  a minimum point at Q(a, 3b)

On the axes below, sketch the curve.

Label points P and Q on your sketch.

qp19-2016-paper-2-aqa-gcse-further-maths
3
Sme Calculator
5 marks

The graph of y=abx is shown, where a and b are positive constants.

Graph of a curve plotted on and x, y coordinate grid. The curve passes through the y axis at the point 1/4 and bends upward sharply. It also passes through the point (2/3, 1).

The graph has a y-intercept of 14 and passes through the point (23, 1)

By finding the values of a and b, work out the equation of the graph.

Give your answer in the form y=cpx+q where p and q are integers and where c is the smallest positive integer possible.