Describing Wave Motion (Edexcel IGCSE Science (Double Award)): Revision Note
Exam code: 4SD0

Did this video help you?
Describing wave motion
When describing wave motion, there are several terms which are important to know, including:
amplitude
wavelength
frequency
time period
Amplitude
Amplitude is defined as:
The maximum displacement of a wave from its undisturbed position
It is given the symbol
 and is measured in metres (m)
On a graph where the vertical axis is displacement, amplitude is measured from the undisturbed position to either the highest point of the wave (peak) or the lowest point (trough)
Wavelength
Wavelength is defined as:
The distance from one point on the wave to the same point on the next wave
In a transverse wave:
The wavelength can be measured from one peak to the next peak
In a longitudinal wave:
The wavelength can be measured from the centre of one compression to the centre of the next
Wavelength is given the symbol
 (lambda) and is measured in metres (m)
On a graph where the horizontal axis is distance, the wavelength can be determined by measuring the distance from one point on the wave to the same point on the next wave
Using a graph to determine wavelength and amplitude
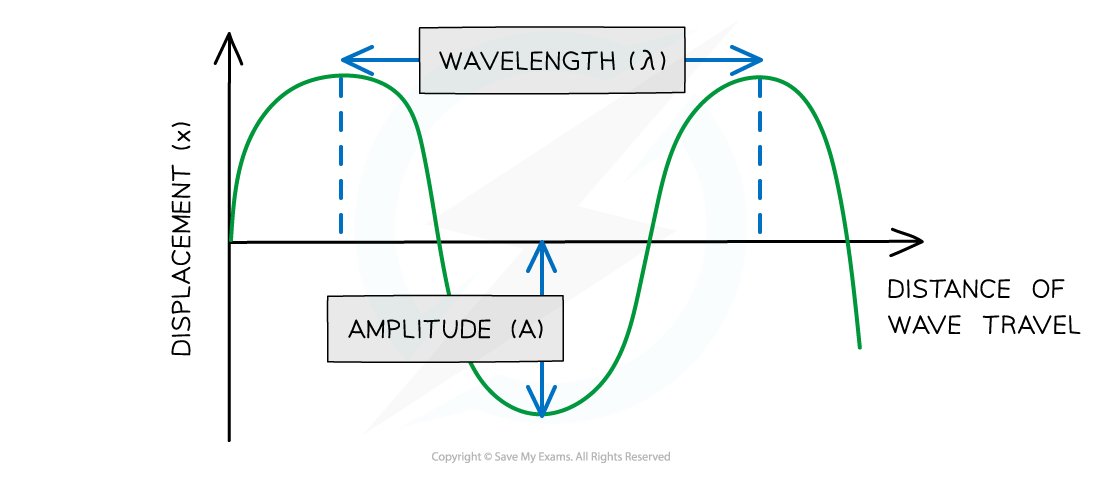
Diagram showing the amplitude and wavelength of a transverse wave
Frequency
Frequency is defined as:
The number of waves passing a point in a second
Frequency is given the symbol
 and is measured in hertz (Hz)
The unit hertz is equivalent to 'per second'
5 Hz = 5 waves per second
Waves with a higher frequency transfer a higher amount of energy
Time period
The time period (or sometimes just 'period') of a wave is defined as:
The time taken for a single wave to pass a point
Time period is given the symbol
 and is measured in seconds (s)
The equation linking frequency and time period is explained in Frequency & time period
On a graph where the horizontal axis is time, the period can be determined by measuring the time from one point on the wave to the same point on the next wave
Using a graph to determine time period
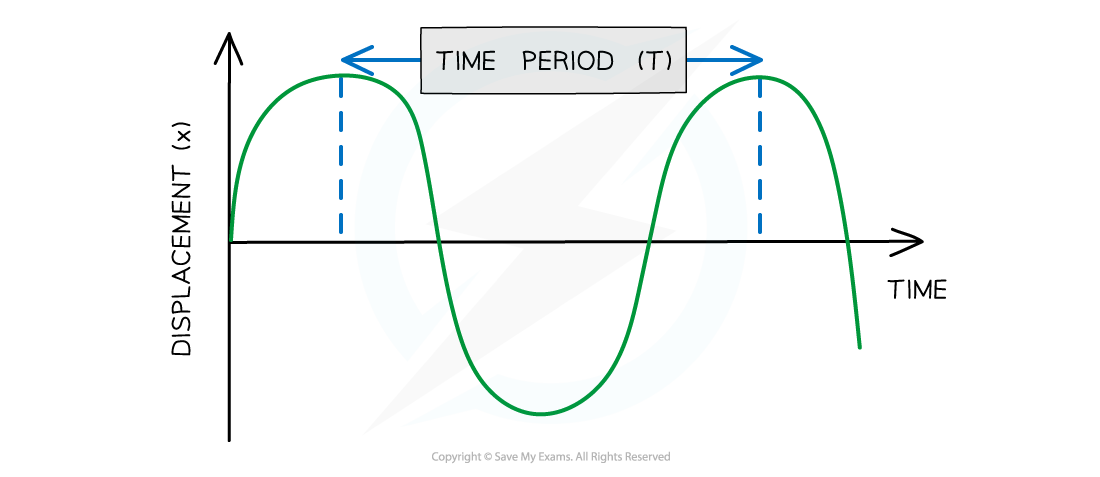
Diagram showing the time period of a wave
Examiner Tips and Tricks
In your exam, you are expected to be able to define these keywords and identify their values from diagrams or scenarios.
The wavelength is often shown graphically between the peaks of two consecutive waves. However, the wavelength can be shown between two corresponding points on two successive waves - the distance will be the same!

Unlock more, it's free!
Did this page help you?