Graphs of Trigonometric Functions (DP IB Applications & Interpretation (AI)): Revision Note

Did this video help you?
Graphs of trigonometric functions
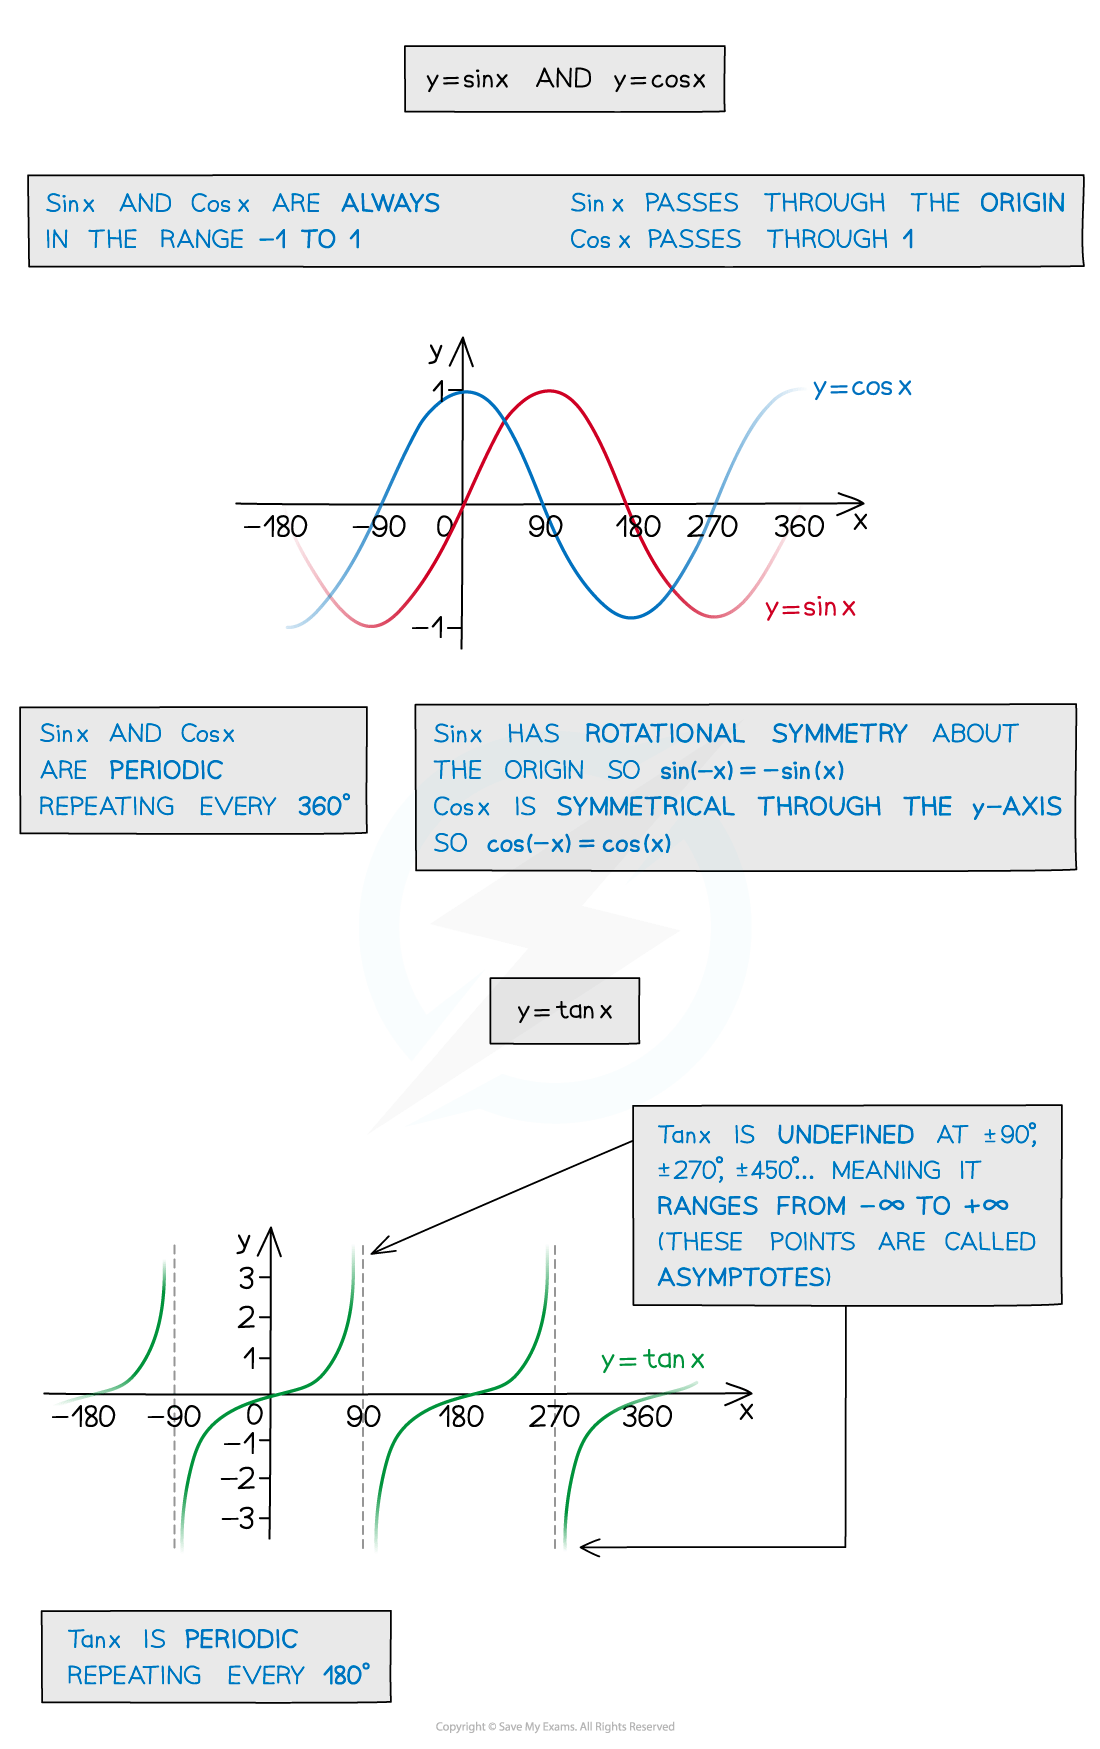
What are the properties of the graphs of y = sin x and y = cos x?
The graphs of sin x and cos x are very similar
They are transformations of each other
They intersect the y-axis at different places
sin x passes through the origin
cos x passes through (0, 1)
Both graphs have the same domain and range
Domain:
format('truetype')%3Bfont-weight%3Anormal%3Bfont-style%3Anormal%3B%7D%3C%2Fstyle%3E%3C%2Fdefs%3E%3Ctext%20font-family%3D%22Times%20New%20Roman%22%20font-size%3D%2218%22%20text-anchor%3D%22middle%22%20x%3D%224.5%22%20y%3D%2216%22%3E%7B%3C%2Ftext%3E%3Ctext%20font-family%3D%22Times%20New%20Roman%22%20font-size%3D%2218%22%20text-anchor%3D%22middle%22%20x%3D%2285.5%22%20y%3D%2216%22%3E%7D%3C%2Ftext%3E%3Ctext%20font-family%3D%22Times%20New%20Roman%22%20font-size%3D%2218%22%20font-style%3D%22italic%22%20text-anchor%3D%22middle%22%20x%3D%2213.5%22%20y%3D%2216%22%3Ex%3C%2Ftext%3E%3Ctext%20font-family%3D%22math110fad8c4e8597264278582a569%22%20font-size%3D%2216%22%20text-anchor%3D%22middle%22%20x%3D%2226.5%22%20y%3D%2216%22%3E%7C%3C%2Ftext%3E%3Ctext%20font-family%3D%22Times%20New%20Roman%22%20font-size%3D%2218%22%20font-style%3D%22italic%22%20text-anchor%3D%22middle%22%20x%3D%2238.5%22%20y%3D%2216%22%3Ex%3C%2Ftext%3E%3Ctext%20font-family%3D%22math110fad8c4e8597264278582a569%22%20font-size%3D%2216%22%20text-anchor%3D%22middle%22%20x%3D%2256.5%22%20y%3D%2216%22%3E%26%23x2208%3B%3C%2Ftext%3E%3Ctext%20font-family%3D%22math110fad8c4e8597264278582a569%22%20font-size%3D%2216%22%20text-anchor%3D%22middle%22%20x%3D%2274.5%22%20y%3D%2216%22%3E%26%23x211D%3B%3C%2Ftext%3E%3C%2Fsvg%3E)
Range:
format('truetype')%3Bfont-weight%3Anormal%3Bfont-style%3Anormal%3B%7D%3C%2Fstyle%3E%3C%2Fdefs%3E%3Ctext%20font-family%3D%22Times%20New%20Roman%22%20font-size%3D%2218%22%20text-anchor%3D%22middle%22%20x%3D%224.5%22%20y%3D%2216%22%3E%7B%3C%2Ftext%3E%3Ctext%20font-family%3D%22Times%20New%20Roman%22%20font-size%3D%2218%22%20text-anchor%3D%22middle%22%20x%3D%22128.5%22%20y%3D%2216%22%3E%7D%3C%2Ftext%3E%3Ctext%20font-family%3D%22Times%20New%20Roman%22%20font-size%3D%2218%22%20font-style%3D%22italic%22%20text-anchor%3D%22middle%22%20x%3D%2213.5%22%20y%3D%2216%22%3Ey%3C%2Ftext%3E%3Ctext%20font-family%3D%22math105870d177921851ce329aaa3b2%22%20font-size%3D%2216%22%20text-anchor%3D%22middle%22%20x%3D%2226.5%22%20y%3D%2216%22%3E%7C%3C%2Ftext%3E%3Ctext%20font-family%3D%22math105870d177921851ce329aaa3b2%22%20font-size%3D%2216%22%20text-anchor%3D%22middle%22%20x%3D%2238.5%22%20y%3D%2216%22%3E%26%23x2212%3B%3C%2Ftext%3E%3Ctext%20font-family%3D%22Times%20New%20Roman%22%20font-size%3D%2218%22%20text-anchor%3D%22middle%22%20x%3D%2251.5%22%20y%3D%2216%22%3E1%3C%2Ftext%3E%3Ctext%20font-family%3D%22math105870d177921851ce329aaa3b2%22%20font-size%3D%2216%22%20text-anchor%3D%22middle%22%20x%3D%2269.5%22%20y%3D%2216%22%3E%26%23x2264%3B%3C%2Ftext%3E%3Ctext%20font-family%3D%22Times%20New%20Roman%22%20font-size%3D%2218%22%20font-style%3D%22italic%22%20text-anchor%3D%22middle%22%20x%3D%2285.5%22%20y%3D%2216%22%3Ey%3C%2Ftext%3E%3Ctext%20font-family%3D%22math105870d177921851ce329aaa3b2%22%20font-size%3D%2216%22%20text-anchor%3D%22middle%22%20x%3D%22103.5%22%20y%3D%2216%22%3E%26%23x2264%3B%3C%2Ftext%3E%3Ctext%20font-family%3D%22Times%20New%20Roman%22%20font-size%3D%2218%22%20text-anchor%3D%22middle%22%20x%3D%22119.5%22%20y%3D%2216%22%3E1%3C%2Ftext%3E%3C%2Fsvg%3E)
The graphs are both periodic
They repeat every 360° (2π radians)
The amplitude of the graphs of sin x and cos x is 1
What are the properties of the graph of y = tan x?
The graph of tan x intersects the y-axis at the origin
The graph is undefined at the points ± 90°, ± 270° etc
There are asymptotes at these points on the graph
In radians this is at the points ±
format('truetype')%3Bfont-weight%3Anormal%3Bfont-style%3Anormal%3B%7D%3C%2Fstyle%3E%3C%2Fdefs%3E%3Cline%20stroke%3D%22%23000%22%20stroke-linecap%3D%22square%22%20stroke-width%3D%221%22%20x1%3D%222.5%22%20x2%3D%2216.5%22%20y1%3D%2218.5%22%20y2%3D%2218.5%22%2F%3E%3Ctext%20font-family%3D%22math1437d7d1d97917cd627a34a6a0f%22%20font-size%3D%2214%22%20text-anchor%3D%22middle%22%20x%3D%229.5%22%20y%3D%2214%22%3E%26%23x3C0%3B%3C%2Ftext%3E%3Ctext%20font-family%3D%22Times%20New%20Roman%22%20font-size%3D%2216%22%20text-anchor%3D%22middle%22%20x%3D%2210.5%22%20y%3D%2235%22%3E2%3C%2Ftext%3E%3C%2Fsvg%3E) , ±
, ± format('truetype')%3Bfont-weight%3Anormal%3Bfont-style%3Anormal%3B%7D%3C%2Fstyle%3E%3C%2Fdefs%3E%3Cline%20stroke%3D%22%23000%22%20stroke-linecap%3D%22square%22%20stroke-width%3D%221%22%20x1%3D%222.5%22%20x2%3D%2224.5%22%20y1%3D%2220.5%22%20y2%3D%2220.5%22%2F%3E%3Ctext%20font-family%3D%22Times%20New%20Roman%22%20font-size%3D%2216%22%20text-anchor%3D%22middle%22%20x%3D%228.5%22%20y%3D%2215%22%3E3%3C%2Ftext%3E%3Ctext%20font-family%3D%22math1437d7d1d97917cd627a34a6a0f%22%20font-size%3D%2214%22%20text-anchor%3D%22middle%22%20x%3D%2217.5%22%20y%3D%2215%22%3E%26%23x3C0%3B%3C%2Ftext%3E%3Ctext%20font-family%3D%22Times%20New%20Roman%22%20font-size%3D%2216%22%20text-anchor%3D%22middle%22%20x%3D%2214.5%22%20y%3D%2237%22%3E2%3C%2Ftext%3E%3C%2Fsvg%3E) etc
etc
The domain and range of the graph is
Domain:
format('truetype')%3Bfont-weight%3Anormal%3Bfont-style%3Anormal%3B%7D%40font-face%7Bfont-family%3A'brack_sm1837c52e4f2c6bfec104885'%3Bsrc%3Aurl(data%3Afont%2Ftruetype%3Bcharset%3Dutf-8%3Bbase64%2CAAEAAAAMAIAAAwBAT1MvMi7PH4UAAADMAAAATmNtYXA3kjw6AAABHAAAAGxjdnQgAQYDiAAAAYgAAAASZ2x5ZkyYQ7YAAAGcAAACQmhlYWQLyR8fAAAD4AAAADZoaGVhAq0XCAAABBgAAAAkaG10eDEjA%2FUAAAQ8AAAAJGxvY2EAAEKZAAAEYAAAAChtYXhwBJsEcQAABIgAAAAgbmFtZW7QvZAAAASoAAAB5XBvc3QArQBVAAAGkAAAACBwcmVwu5WEAAAABrAAAAAHAAACDAGQAAUAAAQABAAAAAAABAAEAAAAAAAAAQEAAAAAAAAAAAAAAAAAAAAAAAAAAAAAAAAAAAAAACAgICAAAAAg9AMD%2FP%2F8AAABVAABAAAAAAACAAEAAQAAABQAAwABAAAAFAAEAFgAAAASABAAAwACI6cjqCOpI6ojqyOsI60jrv%2F%2FAAAjpyOoI6kjqiOrI6wjrSOu%2F%2F%2FcWtxa3FrcWtxa3FrcWtxaAAEAAAAAAAAAAAAAAAAAAAAAAAAAAAFUAFQBAAArAIwAgACoAAcAAAACAAAAAADVAQEAAwAHAAAxMxEjFyM1M9XVq4CAAQHWqwABAAAAAAEAAVUABwAjGAGxAAA%2FsQcC%2FbEDB%2FywBDwAsQAAP7AHPLEDAfaxBAT9MTAxNDY3FQ4BFWuVa0BrwCoqK8BAAAH%2FgAAAAFUBVAAJACEYAbEFAD%2BwATyxBgL9sAA8ALEFAD%2BwBjyxAQE%2FsAA8MTATIxQHFhUzNCc2VVWAgFWAgAFUVVRWVVVWVAABAAAAAAEAAVQABwAjGAGxAAA%2FsQcC%2FbEDB%2FywBDwAsQABP7AHPLEDAfaxBAT9MTARFBYXNS4BNWuVa0ABVGrAKispwEAAAQAAAAAAVQFUAAMAIBgBsAQQsAA8sAM8sQEC9bACPACwAy%2BwAjyxAAH1sAE8ETMRI1VVAVT%2BrAABAAAAAAEAAVQABwAlGAGwCS%2BwADyxAQL9sQUH%2FLAEPACxAAA%2FsAE8sQUB9rEEBP0xMCEjNCYnNR4BAQBVQGuVaz%2FAKyoqwQABAKsAAAGAAVQACQAiGAGwCy%2BxBgA8PLEFAv2wATwAsQUAP7AGPLEBAT%2BwADwxMAEjFBcGFTM0NyYBAFWAgFWAgAFUVFVWVVVWVQABAAAAAAEAAVQABwAlGAGwCS%2BwADyxAQL9sQUH%2FLAEPACxAAE%2FsAE8sQUB9rEEBP0xMAEjFAYHFT4BAQBVQWqVawFUVKsqKyvAAAEAqwAAAQABVAADACAYAbAFL7ABPLACPLEAAvWwAzwAsAMvsAI8sQAB9bABPBMzESOrVVUBVP6sAAAAAQAAAAEAAIsesexfDzz1AAMEAP%2F%2F%2F%2F%2FVre5k%2F%2F%2F%2F%2F9Wt7mT%2FgP%2F%2FAdYBWAAAAAoAAgABAAAAAAABAAABVP%2F%2FAAAXcP%2BA%2F4AB1gABAAAAAAAAAAAAAAAAAAAACQDVAAABAAAAAQD%2FgAEAAAABAAAAAQAAAAEAAKsBAAAAAQAAqwAAAAAAAAAhAAAAZQAAAK4AAAD0AAABLAAAAXQAAAG%2FAAACCQAAAkIAAQAAAAkACgACAAAAAAACAIAEAAAAAAAEAABlAAAAAAAAABUBAgAAAAAAAAABACYAAAAAAAAAAAACAA4AJgAAAAAAAAADAEQANAAAAAAAAAAEACYAeAAAAAAAAAAFABYAngAAAAAAAAAGABMAtAAAAAAAAAAIABwAxwABAAAAAAABACYAAAABAAAAAAACAA4AJgABAAAAAAADAEQANAABAAAAAAAEACYAeAABAAAAAAAFABYAngABAAAAAAAGABMAtAABAAAAAAAIABwAxwADAAEECQABACYAAAADAAEECQACAA4AJgADAAEECQADAEQANAADAAEECQAEACYAeAADAAEECQAFABYAngADAAEECQAGABMAtAADAAEECQAIABwAxwBCAHIAYQBjAGsAZQB0AHMAIABzAG0AYQBsAGwAIABzAGkAegBlAFIAZQBnAHUAbABhAHIATQBhAHQAaABzACAARgBvAHIAIABNAG8AcgBlACAAQgByAGEAYwBrAGUAdABzACAAcwBtAGEAbABsACAAcwBpAHoAZQBCAHIAYQBjAGsAZQB0AHMAIABzAG0AYQBsAGwAIABzAGkAegBlAFYAZQByAHMAaQBvAG4AIAAyAC4AMEJyYWNrZXRzX3NtYWxsX3NpemUATQBhAHQAaABzACAARgBvAHIAIABNAG8AcgBlAAAAAAMAAAAAAAAAqgBVAAAAAAAAAAAAAAAAAAAAAAAAAAC5B%2F8AAo2FAA%3D%3D)format('truetype')%3Bfont-weight%3Anormal%3Bfont-style%3Anormal%3B%7D%3C%2Fstyle%3E%3C%2Fdefs%3E%3Ctext%20font-family%3D%22brack_sm1837c52e4f2c6bfec104885%22%20font-size%3D%2218%22%20text-anchor%3D%22start%22%20x%3D%223.5%22%20y%3D%227%22%3E%26%23x23A7%3B%3C%2Ftext%3E%3Ctext%20font-family%3D%22brack_sm1837c52e4f2c6bfec104885%22%20font-size%3D%2218%22%20text-anchor%3D%22start%22%20x%3D%223.5%22%20y%3D%2213%22%3E%26%23x23AA%3B%3C%2Ftext%3E%3Ctext%20font-family%3D%22brack_sm1837c52e4f2c6bfec104885%22%20font-size%3D%2218%22%20text-anchor%3D%22start%22%20x%3D%223.5%22%20y%3D%2219%22%3E%26%23x23AA%3B%3C%2Ftext%3E%3Ctext%20font-family%3D%22brack_sm1837c52e4f2c6bfec104885%22%20font-size%3D%2218%22%20text-anchor%3D%22start%22%20x%3D%223.5%22%20y%3D%2225%22%3E%26%23x23A8%3B%3C%2Ftext%3E%3Ctext%20font-family%3D%22brack_sm1837c52e4f2c6bfec104885%22%20font-size%3D%2218%22%20text-anchor%3D%22start%22%20x%3D%223.5%22%20y%3D%2231%22%3E%26%23x23AA%3B%3C%2Ftext%3E%3Ctext%20font-family%3D%22brack_sm1837c52e4f2c6bfec104885%22%20font-size%3D%2218%22%20text-anchor%3D%22start%22%20x%3D%223.5%22%20y%3D%2237%22%3E%26%23x23AA%3B%3C%2Ftext%3E%3Ctext%20font-family%3D%22brack_sm1837c52e4f2c6bfec104885%22%20font-size%3D%2218%22%20text-anchor%3D%22start%22%20x%3D%223.5%22%20y%3D%2243%22%3E%26%23x23A9%3B%3C%2Ftext%3E%3Ctext%20font-family%3D%22brack_sm1837c52e4f2c6bfec104885%22%20font-size%3D%2218%22%20text-anchor%3D%22start%22%20x%3D%22184.5%22%20y%3D%227%22%3E%26%23x23AB%3B%3C%2Ftext%3E%3Ctext%20font-family%3D%22brack_sm1837c52e4f2c6bfec104885%22%20font-size%3D%2218%22%20text-anchor%3D%22start%22%20x%3D%22184.5%22%20y%3D%2213%22%3E%26%23x23AE%3B%3C%2Ftext%3E%3Ctext%20font-family%3D%22brack_sm1837c52e4f2c6bfec104885%22%20font-size%3D%2218%22%20text-anchor%3D%22start%22%20x%3D%22184.5%22%20y%3D%2219%22%3E%26%23x23AE%3B%3C%2Ftext%3E%3Ctext%20font-family%3D%22brack_sm1837c52e4f2c6bfec104885%22%20font-size%3D%2218%22%20text-anchor%3D%22start%22%20x%3D%22184.5%22%20y%3D%2225%22%3E%26%23x23AC%3B%3C%2Ftext%3E%3Ctext%20font-family%3D%22brack_sm1837c52e4f2c6bfec104885%22%20font-size%3D%2218%22%20text-anchor%3D%22start%22%20x%3D%22184.5%22%20y%3D%2231%22%3E%26%23x23AE%3B%3C%2Ftext%3E%3Ctext%20font-family%3D%22brack_sm1837c52e4f2c6bfec104885%22%20font-size%3D%2218%22%20text-anchor%3D%22start%22%20x%3D%22184.5%22%20y%3D%2237%22%3E%26%23x23AE%3B%3C%2Ftext%3E%3Ctext%20font-family%3D%22brack_sm1837c52e4f2c6bfec104885%22%20font-size%3D%2218%22%20text-anchor%3D%22start%22%20x%3D%22184.5%22%20y%3D%2243%22%3E%26%23x23AD%3B%3C%2Ftext%3E%3Ctext%20font-family%3D%22Times%20New%20Roman%22%20font-size%3D%2218%22%20font-style%3D%22italic%22%20text-anchor%3D%22middle%22%20x%3D%2213.5%22%20y%3D%2227%22%3Ex%3C%2Ftext%3E%3Ctext%20font-family%3D%22math12eb8730e7a9c2a19e14e19f87f%22%20font-size%3D%2216%22%20text-anchor%3D%22middle%22%20x%3D%2226.5%22%20y%3D%2227%22%3E%7C%3C%2Ftext%3E%3Ctext%20font-family%3D%22Times%20New%20Roman%22%20font-size%3D%2218%22%20font-style%3D%22italic%22%20text-anchor%3D%22middle%22%20x%3D%2238.5%22%20y%3D%2227%22%3Ex%3C%2Ftext%3E%3Ctext%20font-family%3D%22math12eb8730e7a9c2a19e14e19f87f%22%20font-size%3D%2216%22%20text-anchor%3D%22middle%22%20x%3D%2256.5%22%20y%3D%2227%22%3E%26%23x2260%3B%3C%2Ftext%3E%3Cline%20stroke%3D%22%23000000%22%20stroke-linecap%3D%22square%22%20stroke-width%3D%221%22%20x1%3D%2267.5%22%20x2%3D%2283.5%22%20y1%3D%2220.5%22%20y2%3D%2220.5%22%2F%3E%3Ctext%20font-family%3D%22math12eb8730e7a9c2a19e14e19f87f%22%20font-size%3D%2216%22%20font-style%3D%22italic%22%20text-anchor%3D%22middle%22%20x%3D%2275.5%22%20y%3D%2216%22%3E%26%23x3C0%3B%3C%2Ftext%3E%3Ctext%20font-family%3D%22Times%20New%20Roman%22%20font-size%3D%2218%22%20text-anchor%3D%22middle%22%20x%3D%2275.5%22%20y%3D%2238%22%3E2%3C%2Ftext%3E%3Ctext%20font-family%3D%22math12eb8730e7a9c2a19e14e19f87f%22%20font-size%3D%2216%22%20text-anchor%3D%22middle%22%20x%3D%2294.5%22%20y%3D%2227%22%3E%2B%3C%2Ftext%3E%3Ctext%20font-family%3D%22Times%20New%20Roman%22%20font-size%3D%2218%22%20font-style%3D%22italic%22%20text-anchor%3D%22middle%22%20x%3D%22107.5%22%20y%3D%2227%22%3Ek%3C%2Ftext%3E%3Ctext%20font-family%3D%22math12eb8730e7a9c2a19e14e19f87f%22%20font-size%3D%2216%22%20font-style%3D%22italic%22%20text-anchor%3D%22middle%22%20x%3D%22118.5%22%20y%3D%2227%22%3E%26%23x3C0%3B%3C%2Ftext%3E%3Ctext%20font-family%3D%22math12eb8730e7a9c2a19e14e19f87f%22%20font-size%3D%2216%22%20text-anchor%3D%22middle%22%20x%3D%22127.5%22%20y%3D%2227%22%3E%2C%3C%2Ftext%3E%3Ctext%20font-family%3D%22Times%20New%20Roman%22%20font-size%3D%2218%22%20font-style%3D%22italic%22%20text-anchor%3D%22middle%22%20x%3D%22142.5%22%20y%3D%2227%22%3Ek%3C%2Ftext%3E%3Ctext%20font-family%3D%22math12eb8730e7a9c2a19e14e19f87f%22%20font-size%3D%2216%22%20text-anchor%3D%22middle%22%20x%3D%22160.5%22%20y%3D%2227%22%3E%26%23x2208%3B%3C%2Ftext%3E%3Ctext%20font-family%3D%22math12eb8730e7a9c2a19e14e19f87f%22%20font-size%3D%2216%22%20text-anchor%3D%22middle%22%20x%3D%22177.5%22%20y%3D%2227%22%3E%26%23x2124%3B%3C%2Ftext%3E%3C%2Fsvg%3E)
Range:
format('truetype')%3Bfont-weight%3Anormal%3Bfont-style%3Anormal%3B%7D%3C%2Fstyle%3E%3C%2Fdefs%3E%3Ctext%20font-family%3D%22Times%20New%20Roman%22%20font-size%3D%2218%22%20text-anchor%3D%22middle%22%20x%3D%224.5%22%20y%3D%2216%22%3E%7B%3C%2Ftext%3E%3Ctext%20font-family%3D%22Times%20New%20Roman%22%20font-size%3D%2218%22%20text-anchor%3D%22middle%22%20x%3D%2285.5%22%20y%3D%2216%22%3E%7D%3C%2Ftext%3E%3Ctext%20font-family%3D%22Times%20New%20Roman%22%20font-size%3D%2218%22%20font-style%3D%22italic%22%20text-anchor%3D%22middle%22%20x%3D%2213.5%22%20y%3D%2216%22%3Ey%3C%2Ftext%3E%3Ctext%20font-family%3D%22math110fad8c4e8597264278582a569%22%20font-size%3D%2216%22%20text-anchor%3D%22middle%22%20x%3D%2226.5%22%20y%3D%2216%22%3E%7C%3C%2Ftext%3E%3Ctext%20font-family%3D%22Times%20New%20Roman%22%20font-size%3D%2218%22%20font-style%3D%22italic%22%20text-anchor%3D%22middle%22%20x%3D%2238.5%22%20y%3D%2216%22%3Ey%3C%2Ftext%3E%3Ctext%20font-family%3D%22math110fad8c4e8597264278582a569%22%20font-size%3D%2216%22%20text-anchor%3D%22middle%22%20x%3D%2256.5%22%20y%3D%2216%22%3E%26%23x2208%3B%3C%2Ftext%3E%3Ctext%20font-family%3D%22math110fad8c4e8597264278582a569%22%20font-size%3D%2216%22%20text-anchor%3D%22middle%22%20x%3D%2274.5%22%20y%3D%2216%22%3E%26%23x211D%3B%3C%2Ftext%3E%3C%2Fsvg%3E)
The graph of tan x is periodic
It repeats every 180° (π radians)
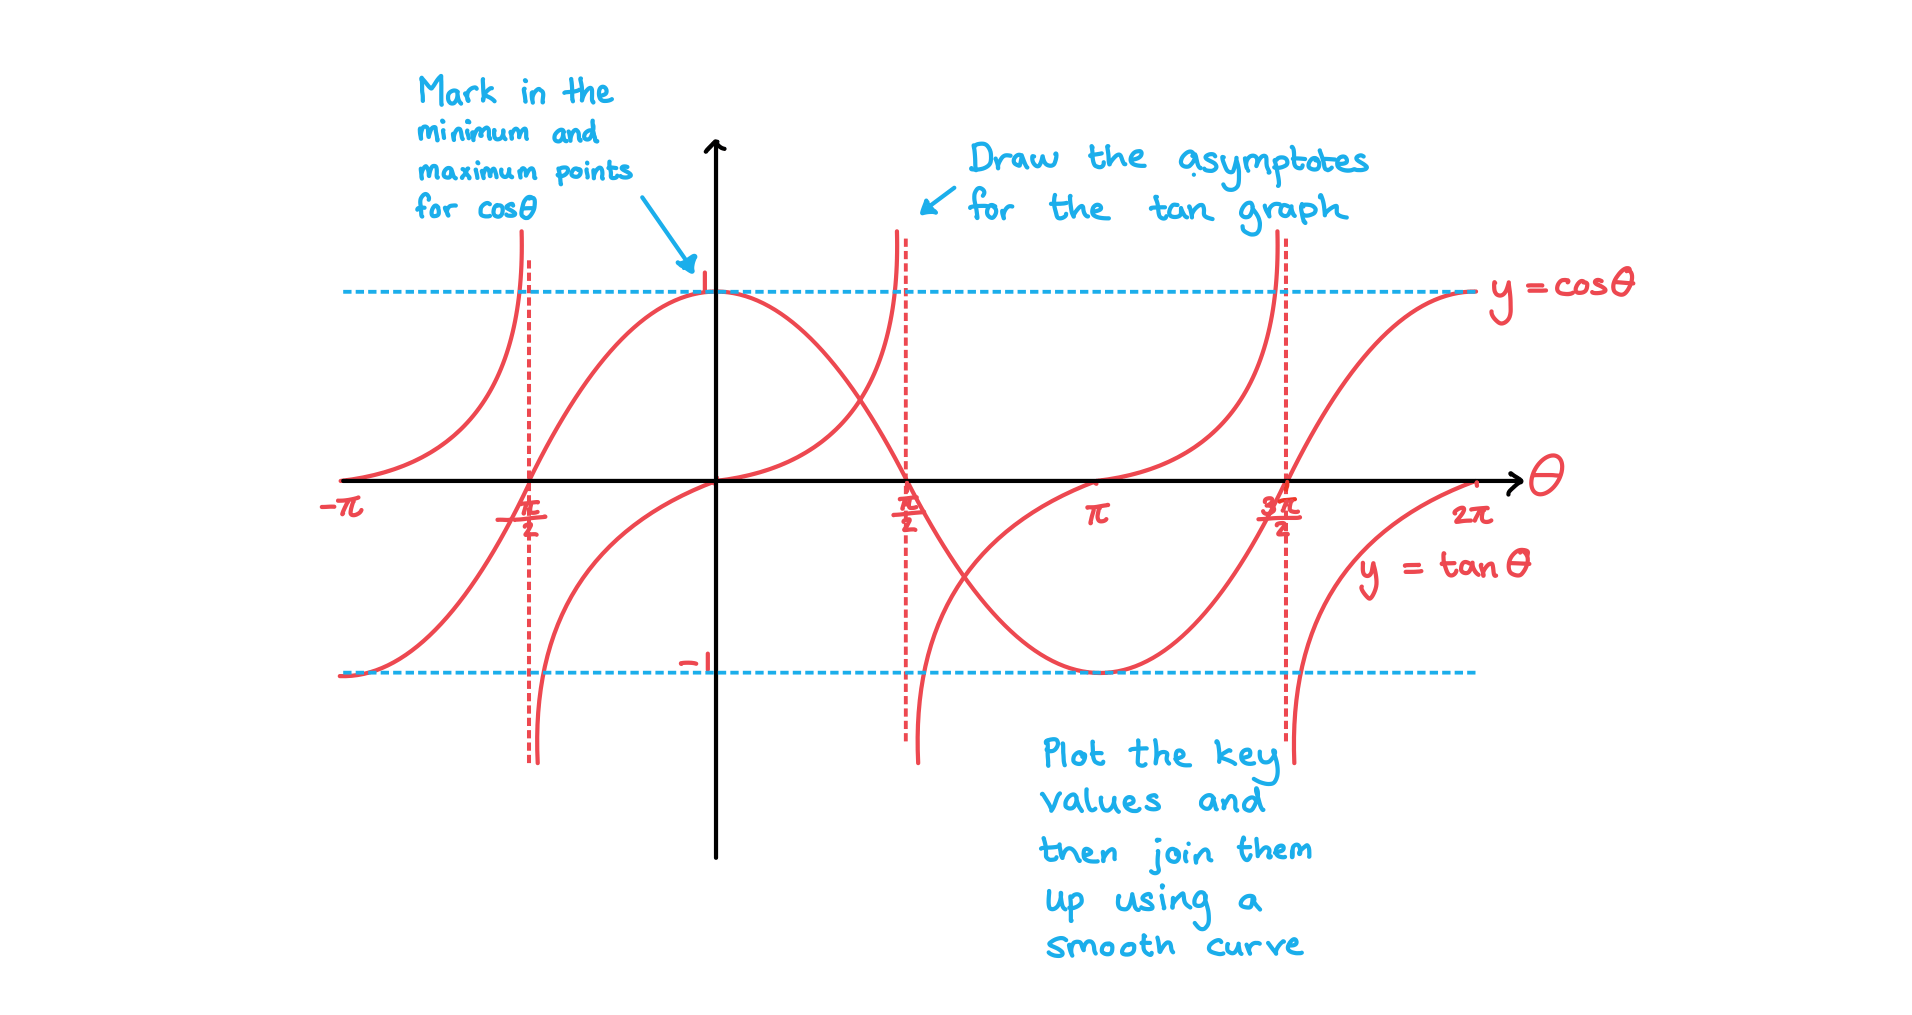
How do I sketch trigonometric graphs?
STEP 1
Check whether you are working in degrees or radiansCheck the domain given for this
STEP 2
Label the x-axis in multiples of 90° (or) Make sure you cover the whole domain on the x-axis
STEP 3
Label the y-axisUse – 1 ≤ y ≤ 1 for sin or cos
Use the whole y-axis for tan
STEP 4
Identify what happens at each multiple of 90° (or) sin0=0, cos0=1, tan0=0
sin90=1, cos90=0, tan90 is undefined
etc
STEP 5
Draw the graph using the general shape
Worked Example
Sketch the graphs of ![]() and
and ![]() on the same set of axes in the interval
on the same set of axes in the interval ![]() . Clearly mark the key features of both graphs.
. Clearly mark the key features of both graphs.
Answer:

Unlock more, it's free!
Join the 100,000+ Students that ❤️ Save My Exams
the (exam) results speak for themselves:

Was this revision note helpful?
