Non-linear Regression (DP IB Applications & Interpretation (AI): HL): Exam Questions

5 hours36 questions
1a
3 marks

Taro discovers a group of rocks and decides to measure their thickness, t cm, and weight, w kg. The results are shown below.

Thickness, t (cm)

2.2

4.5

3.2

2.8

3.7

Weight, w (kg)

2.6

3.6

2.7

3.0

2.9

Taro draws a line of best fit through the data points using the equation w=25t+85.

Draw a scatter diagram of the data and sketch the given line of best fit on the same axes.

q1a_4-3_ib-maths-ai-hl
1b
3 marks

Calculate the residual of each point.

1c
1 mark

Hence find the sum of the squared residuals, SSres.

1d
2 marks

The least squares regression line for these data has SSres=0.184.

Use your answer to part (c) to comment on how well Taro's line fits the data.

2a
1 mark

Syafiqah wants to model the path of the water from a water fountain. She measures the horizontal and vertical distances of specific points on the path that the water takes, with respect to the base of the water spout. These measurements are recorded in the table below.

Horizontal distance, x (m)

0.0

0.2

0.4

0.6

0.8

1.0

1.2

1.4

1.6

Vertical distance, y (m)

1.32

1.47

1.50

1.56

1.39

1.33

0.98

0.63

0.00

State an appropriate type of function to model the path of the water.

2b
2 marks

Use your graphic display calculator to find the equation of the least squares quadratic regression curve for the data.

2c
2 marks

Find the coefficient of determination and comment on the closeness of fit to the original data.

2d
3 marks

Find the maximum height that the water reaches according to the model and the horizontal distance of this point from the base of the water spout.

3a
3 marks

The average price of cooking oil, in USD per litre, was recorded every two years from 2007 until 2021, and the results put in the table below.

Year

2007

2009

2011

2013

2015

2017

2019

2021

Price (USD/L)

0.78

1.32

1.31

1.22

0.99

0.85

0.84

1.24

Let x be the number of years after 2007.

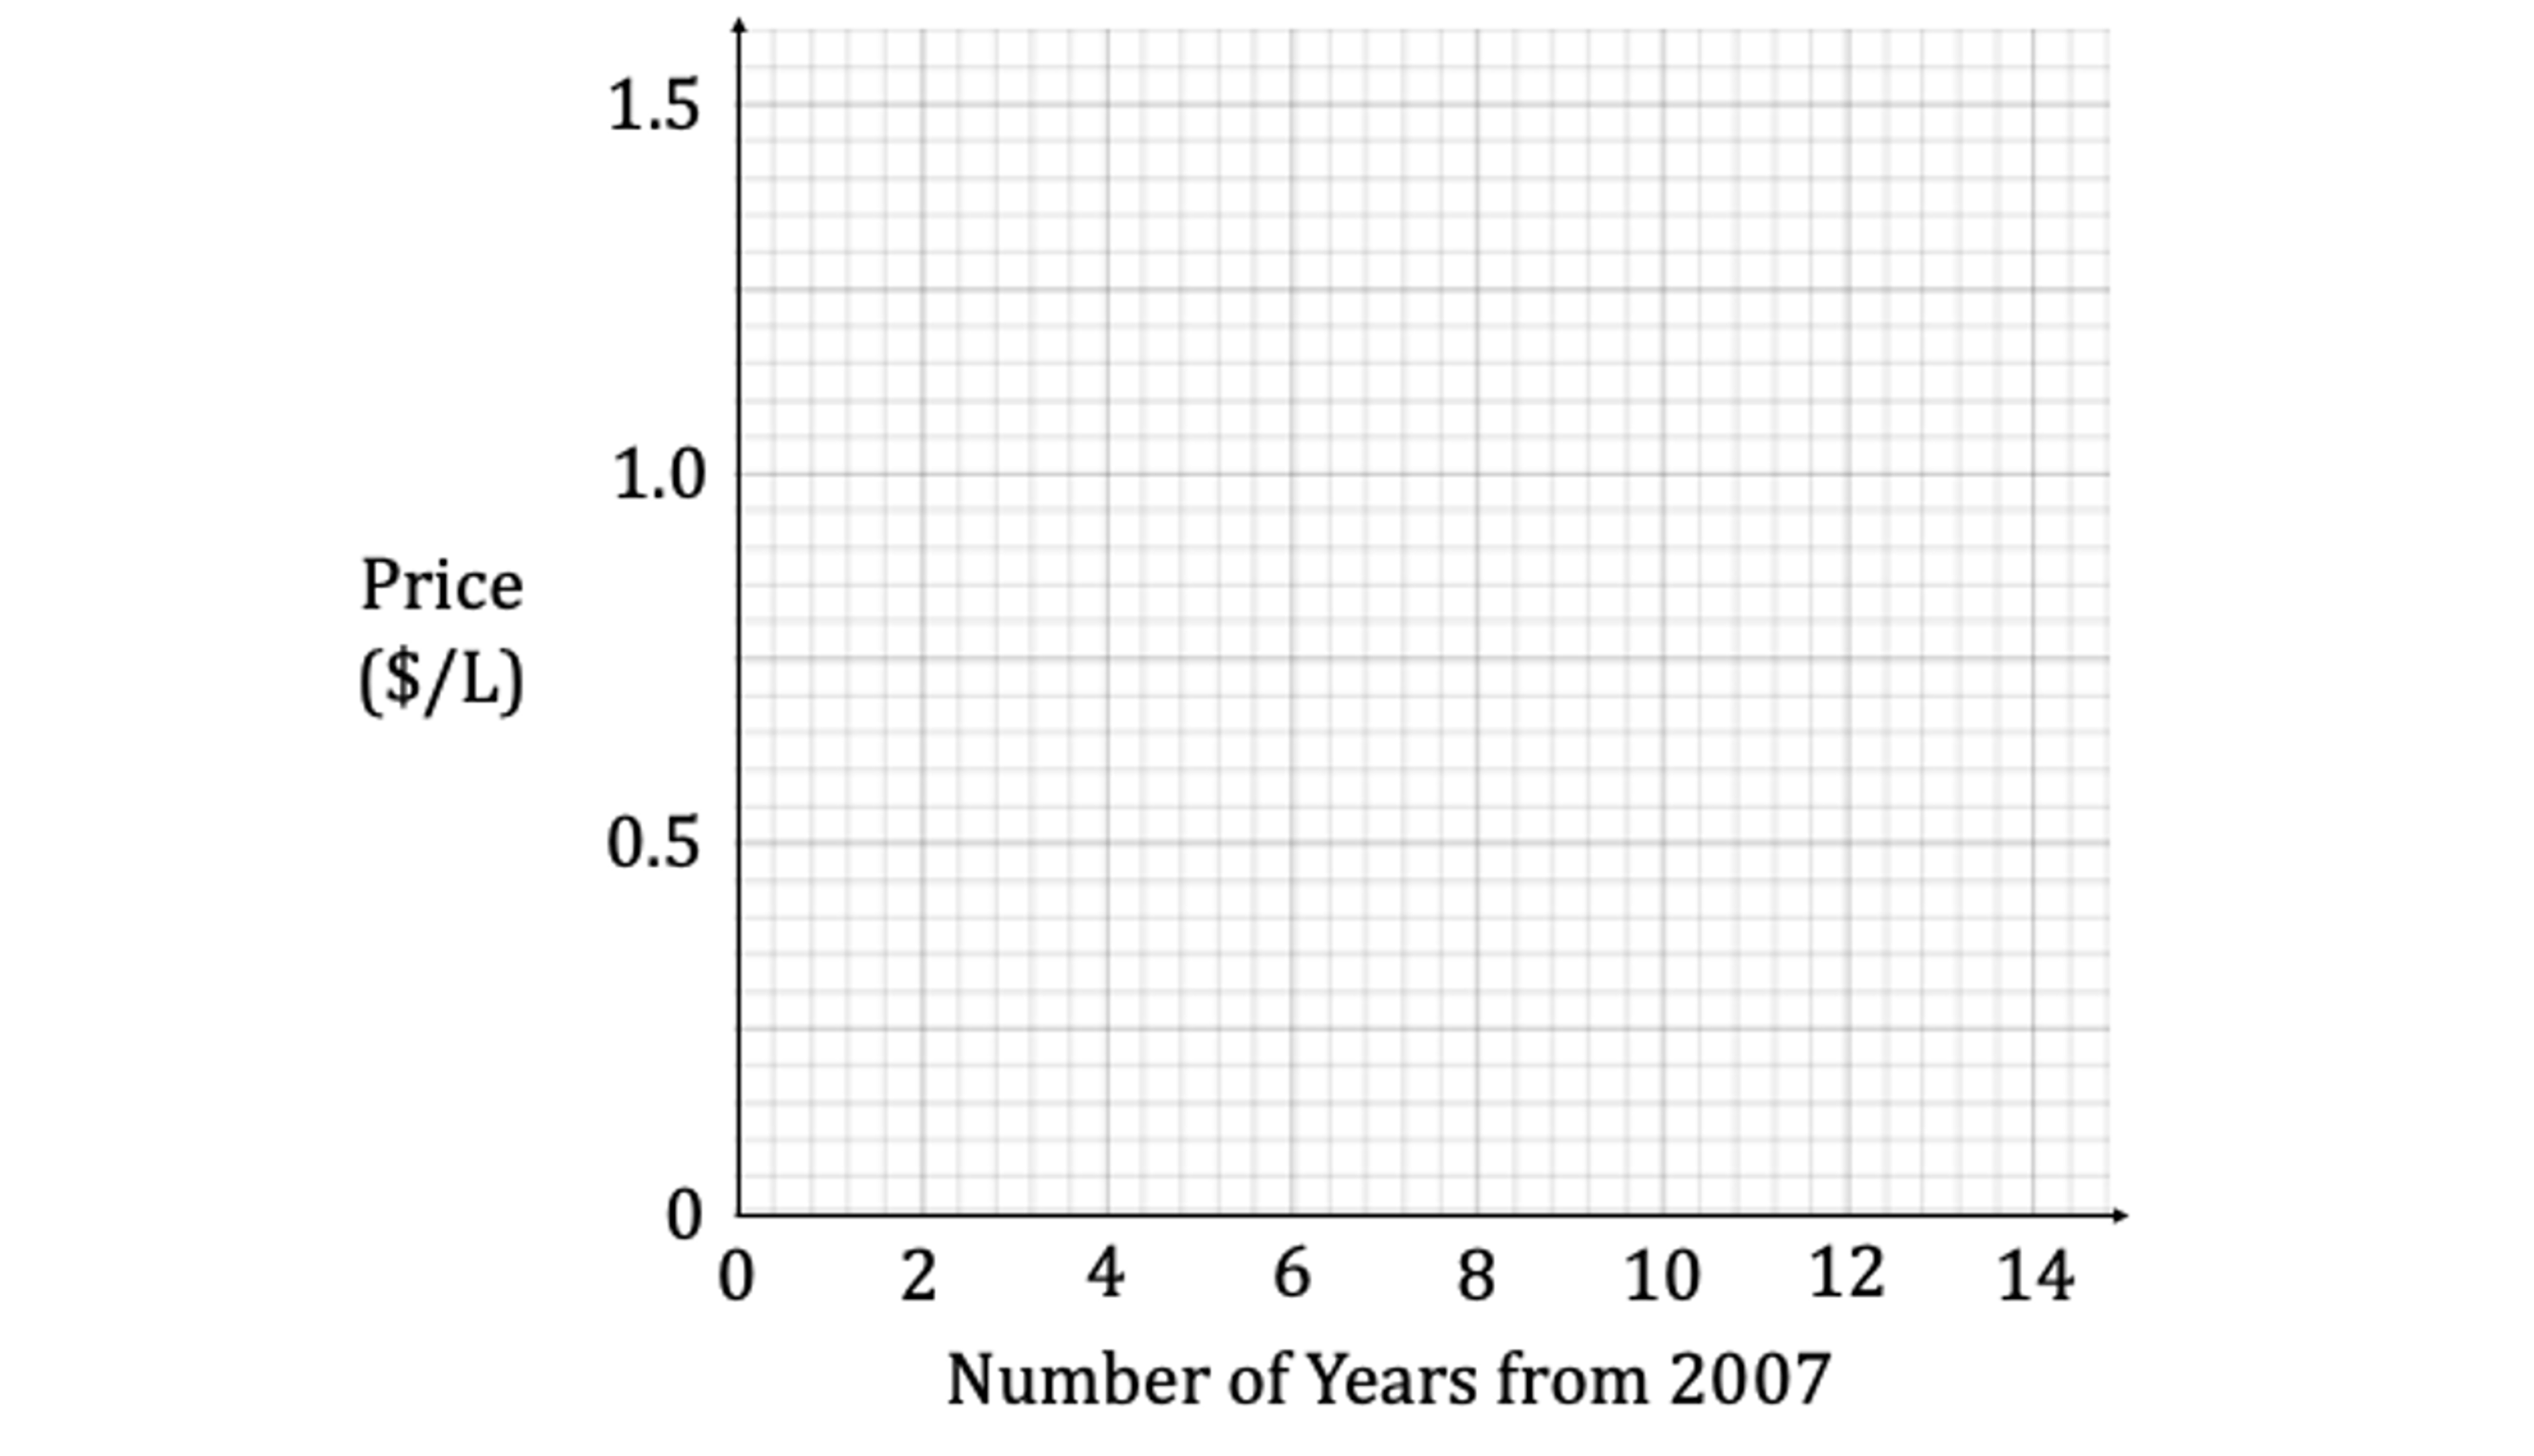
Draw a scatter graph of the data on the axes provided below, with the price in USD per litre against x.

ma3a_4-3_further-correlation-_-regression_medium_ib_ai_hl_maths
3b
1 mark

Suggest a type of function that would be appropriate to model the data, giving a reason for your answer.

3c
2 marks

Use your graphic display calculator to find the equation of the least squares cubic regression curve for the data, where y is the price in USD per litre.

3d
2 marks

Find the coefficient of determination and interpret the result in context.

3e
3 marks

Sketch the model function on top of the scatter graph in part (a) and comment on the closeness of fit to the original data.

4a
3 marks

A scientist who specialises in infectious diseases is investigating the spread of a new disease. She is looking at the number of infections in a community based on the time, in days, since the first recorded case in the area.

She has focused on three sites and recorded the following information.

Site

1

2

3

Time since first recorded case, t (days)

35

180

166

Number of infections, N

9

411

247

The scientist believes that the number of infections in a population can be modelled by an exponential function of the form

N=A(1.2)bt, where A and b are constants.

Given that A=0.6 and b=0.2, find the predicted number of infections and hence the residuals for each site.

4b
2 marks

A second model proposes that A=2.5 and b=0.15.

Find the residuals for each site for the second model.

4c
3 marks

The scientist will use the model that has the lowest value for the sum of the squares of the residuals.

Determine which model the scientist should use.

4d
1 mark

State one concern about the reliability of the model.

5a
2 marks

A unicorn leaves a magical sparkling trail behind him when he jumps off a rock that is 3 metres above ground level and flies away into the sky. The horizontal and vertical distances, in metres, from the base of the rock that the unicorn started from have been measured for several points in the sparkling trail and recorded in the table below.

x

0

2

4

6

7

10

y

3

3

4.2

9.5

15

53.3

Find the equation of the least squares quadratic regression curve for the data.

5b
2 marks

Find the coefficient of determination for the quadratic model and comment on the closeness of fit to the data.

5c
2 marks

By considering the minimum point of the quadratic model, explain why it is not a suitable model for the sparkling trail.

5d
2 marks

Find the equation of the least squares cubic regression curve for the data.

5e
2 marks

Find the coefficient of determination for the cubic model and hence comment on which model is the better fit for the sparkling trail.

6a
2 marks

Grainne records the displacement, s centimetres, of a particle from a fixed point O over the course of 9 seconds. She wishes to find an equation that will model the movement of the particle.

The coordinates of some of the data points of the particle are shown in the table below.

Time, t (s)

0.9

1.2

2.7

3.9

4.2

5.1

5.7

7.7

8.3

Displacement, s (cm)

−5.9

−7.0

−8.2

−4.5

−3.0

−3.2

−5.8

−7.9

−6.0

Explain why a quadratic model would not be a good fit for these data.

6b
1 mark

State a type of function that would be appropriate to model the particle’s movement.

6c
2 marks

Find the equation of the least squares regression curve for the type of function stated in part (b).

6d
3 marks

Given that the displacement of the particle from point O is −4.7 cm, find the time(s) at which this occurs, for 0≤t≤9.

7a
3 marks

A professional skydiver is attempting to perform the highest skydive without the use of specialist breathing equipment. A sensor has been released from a height of 12 000 m to record the atmospheric pressure at different heights above sea level. The data from the sensor is recorded in the table below.

Height above sea level, h (m)

0

2885

5476

7732

9640

12 000

Atmospheric pressure, p (Pa)

1013

766

483

350

301

215

An exponential model of the form p=a(b)h is proposed to model the data, where a and b are constants to be found.

Find the values of a and b, giving the value of b correct to 6 significant figures.

7b
2 marks

State a suitable domain for this model, giving a reason for your answer.

7c
3 marks

It is agreed that an oxygen supply should be used when the atmospheric pressure is less than 365 Pa.

Determine whether a jump from a height of 8000 m could be attempted safely without an oxygen supply.

7d
1 mark

Explain what action could be taken to increase the reliability of the model.

8a
4 marks

A digital artist has taken a photograph of a building and wishes to render it digitally. The photograph is imported to graphing software and the following points that follow the line of the roof are plotted.

x

0

0.7

1.8

2.3

3.3

4.0

4.5

y

1.2

1.5

1.7

2.9

6.5

8.0

13.8

One possible model for the roof is a cubic.

Another possible model for the roof is an exponential function, y=abx, where a, b∈ℝ.

Find the equation of the least squares regression curve for

(i) the cubic model

(ii) the exponential model.

8b
2 marks

Find the coefficient of determination for

(i) the cubic model

(ii) the exponential model.

8c
2 marks

Hence state which function is more appropriate to model the roof line of the building. Give a reason for your answer.

8d
2 marks

Using the model that was chosen in part (c), find the height of the roof when x=4.2.

9a
2 marks

Mo is looking at the growth rate of a particular type of bacteria. She records the number of cells of the bacteria, N, and the time, t minutes, that has elapsed since the start of her observation. The results are recorded in the table below.

Time, t (minutes)

0

2

4

6

8

10

12

14

Number of cells, N

1

3

16

112

2667

6310

210 863

914 113

Let y=logN, where log is to base 10.

Find the value of y at each time, giving your answers correct to 3 decimal places.

9b
3 marks

Mo is not sure whether a linear model or a quadratic model for y against t will fit the data better.

Find the coefficient of determination for

(i) a linear model

(ii) a quadratic model.

9c
1 mark

Hence state which model from part (b) fits the data better.

9d
2 marks

Find the equation of the least squares regression curve for the model chosen in part (c), giving y in terms of t.

10a
2 marks

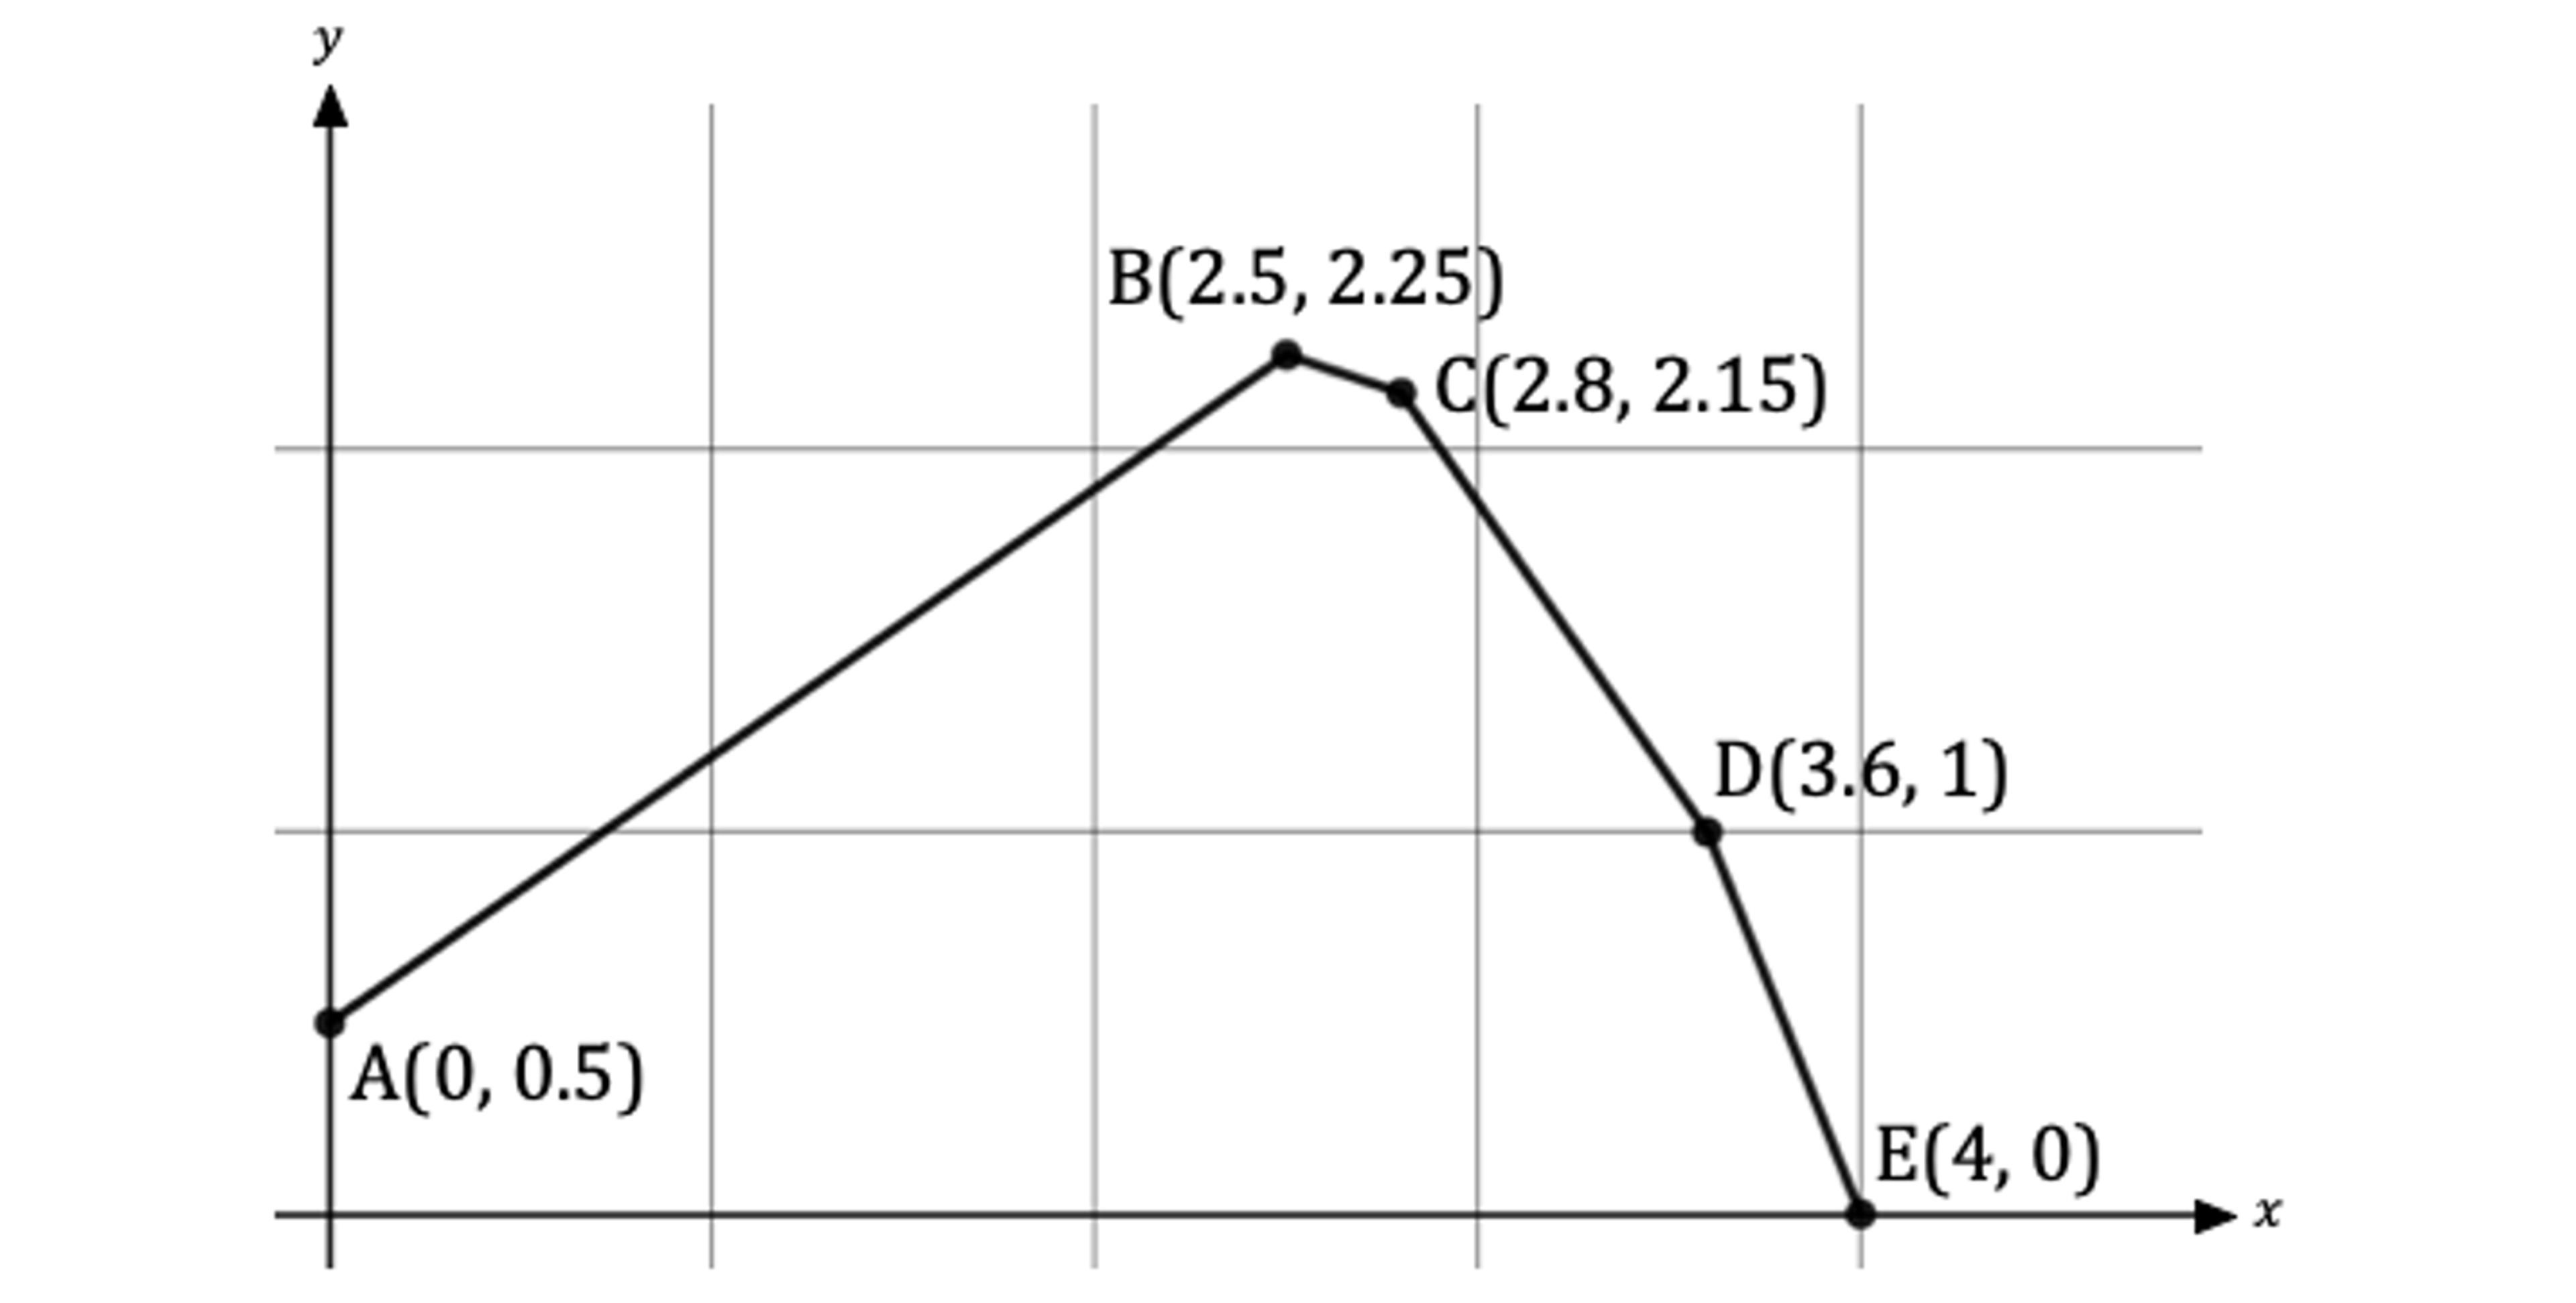
Amelie wants to create a scale model of the cross section of a hill. She has measured the horizontal and vertical distances of several points on the hill from a fixed point O. These points can be seen in the diagram below.

ma10a_4-3_further-correlation-_-regression_medium_ib_ai_hl_maths

Amelie decides to model the first section as a straight line and the second section as a quadratic with equation y=−0.9x2+4.5x−3.3.

Find the equation of the straight line passing through points A and B.

10b
3 marks

Find the residuals for each point B, C, D and E for the quadratic model.

10c
2 marks

Find the equation of the least squares quadratic curve for points B, C, D and E.

10d
3 marks

By examining the sum of the squares of the residuals, show that the model found in part (c) is a better fit for the data.

11a
2 marks

The number of active profiles, N, a new social media platform has t months after launching are shown in the table below.

t

3

5

8

12

15

24

N

542

1122

2345

4254

8621

22 324

logN

Complete the third row of the table above, where log is to base 10.

11b
3 marks

Draw a scatter diagram of logN versus t.

11c
2 marks

The regression line of logN on t can be written in the form logN=a+bt.

Find the values of a and b.

11d
3 marks

Calculate the Pearson's product-moment correlation coefficient, r, between logN and t and comment on the validity of the regression line found in part (c).

11e
1 mark

Based on part (d) suggest a suitable type of regression model for N on t.

12a
2 marks

The surface of a large pond is partly covered by algae. A scientist monitors the area, A m², of the pond covered by algae, d days after the algae is first noticed.

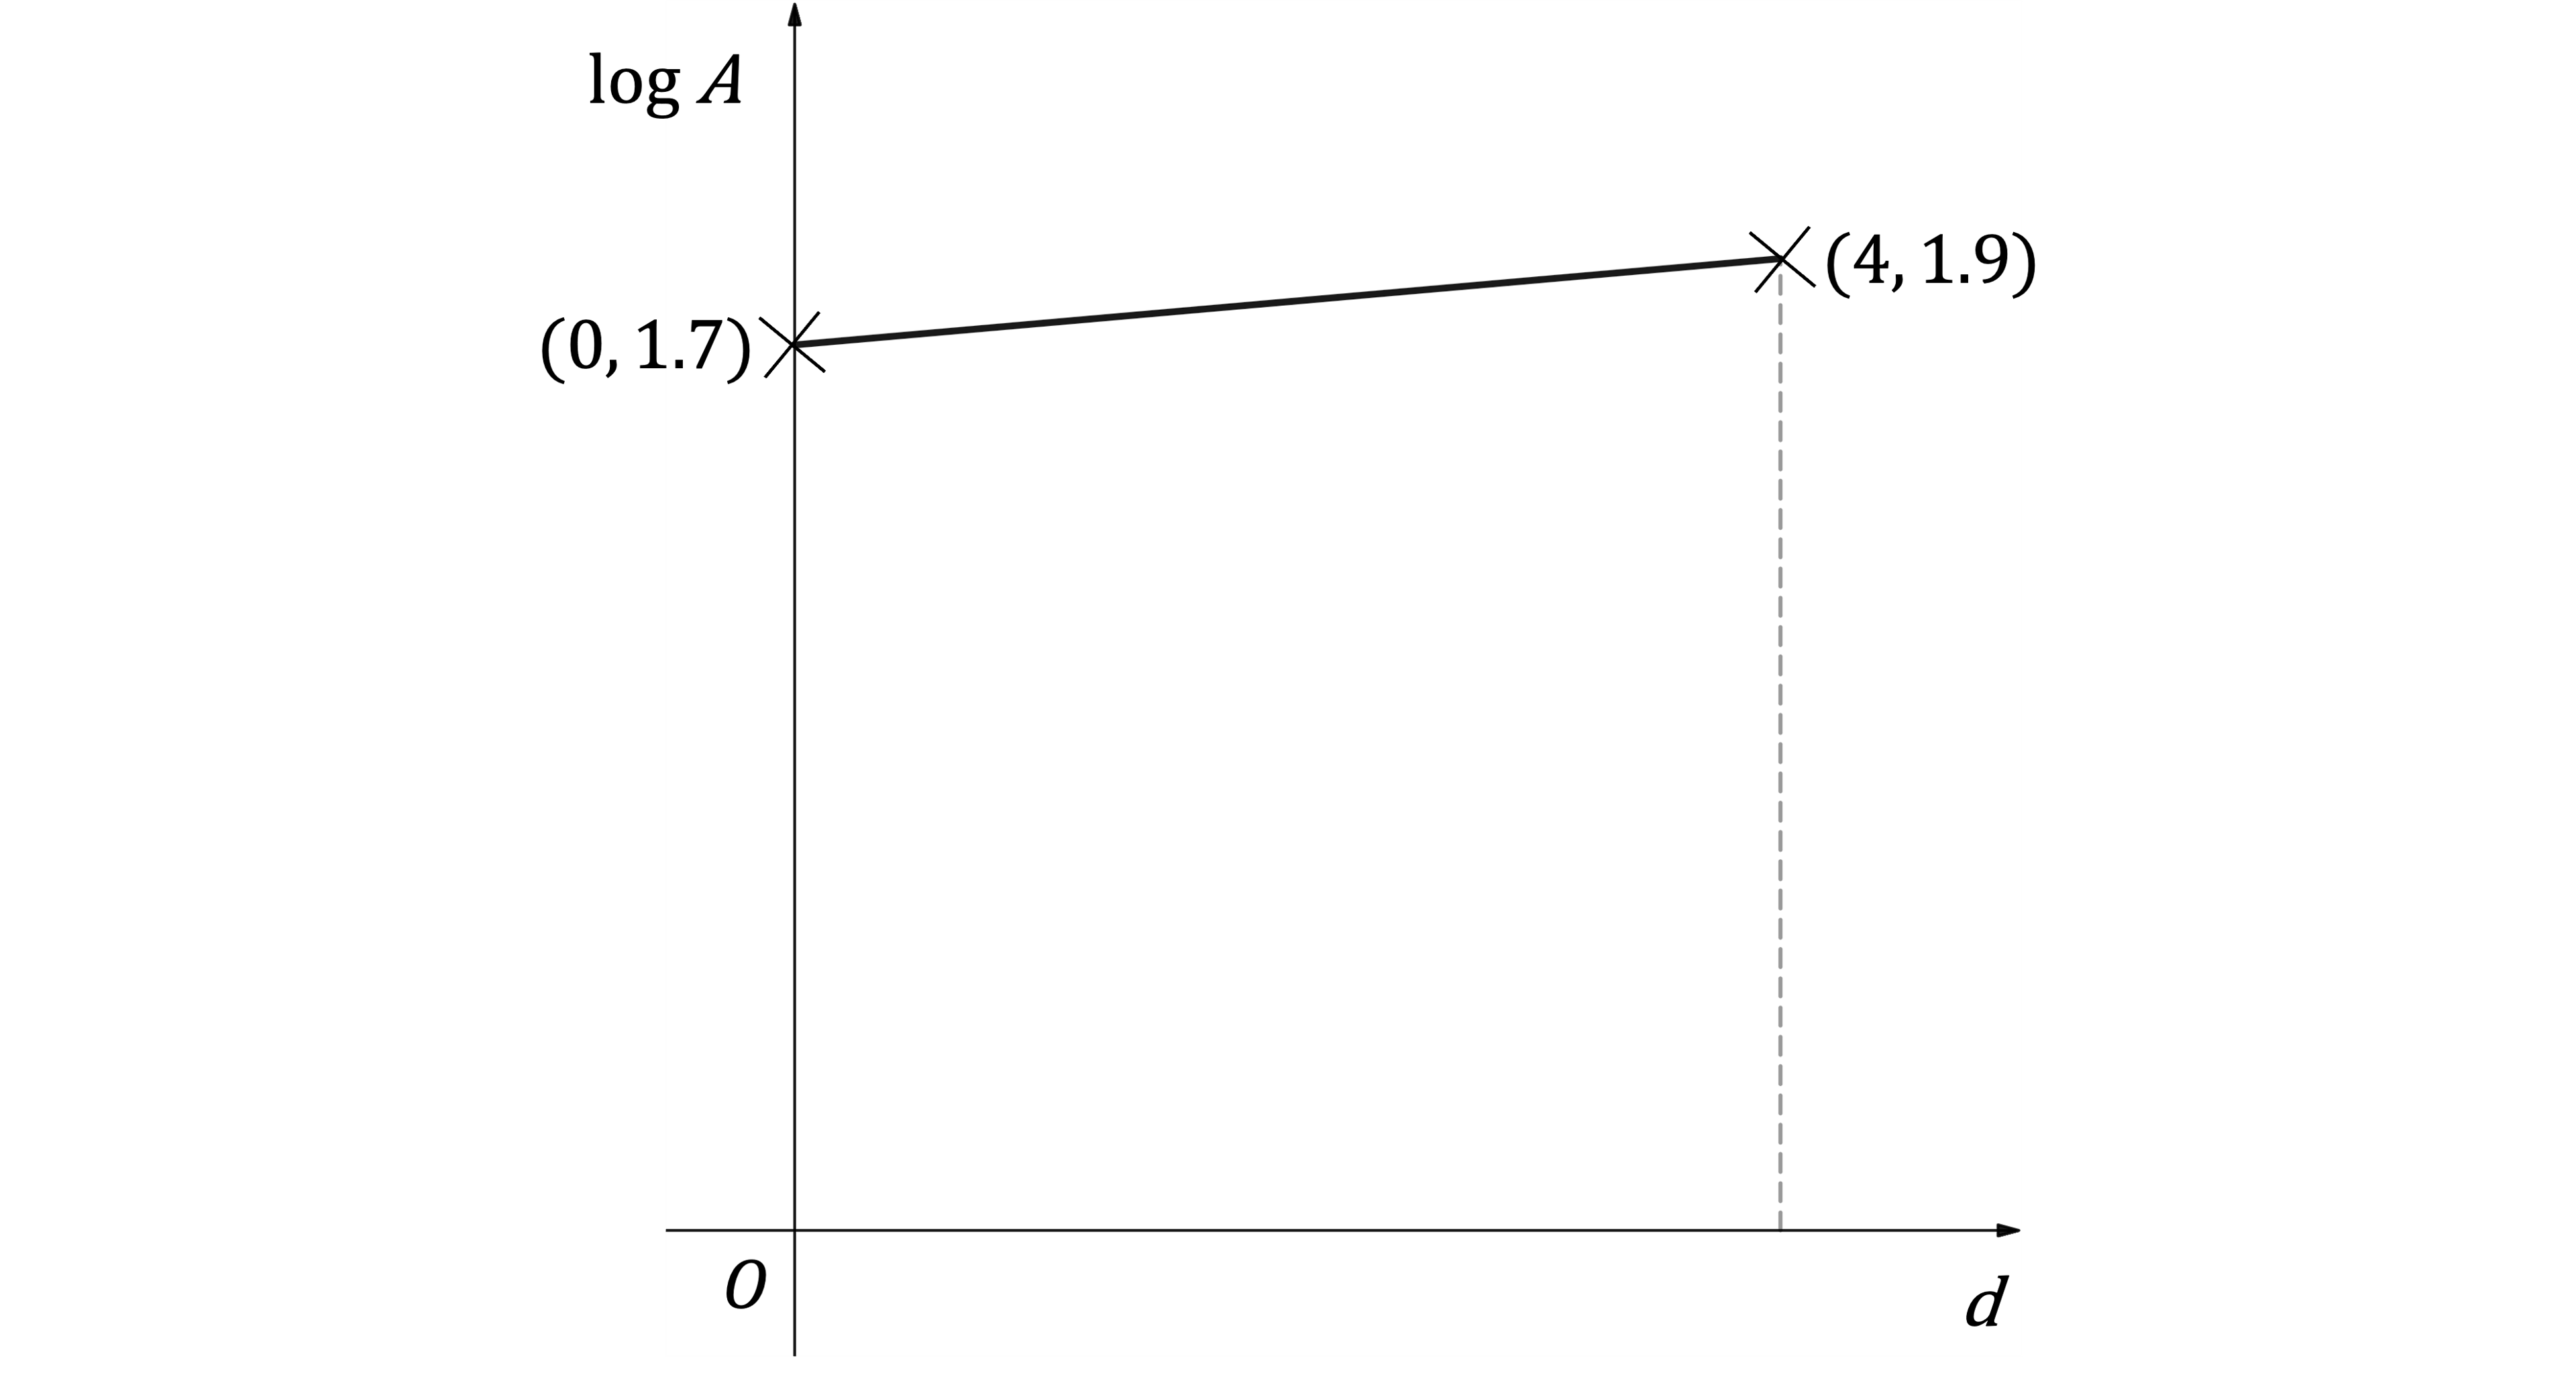
For the first 4 days, the graph of logA against d, where log is to base 10, is a straight line through the points (0,1.7) and (4,1.9), as shown in the diagram.

mi-q12a-2-6-further-modelling-with-functions-ib-ai-hl-medium-maths_dig

The scientist believes that the area covered by algae can be modelled by the equation A=A0bd.

Find the value of A0, giving your answer correct to two significant figures, and explain what it represents in this context.

12b
3 marks

(i) Find the gradient of the straight line.

(ii) Hence find the value of b, giving your answer correct to two significant figures.

12c
2 marks

Using your rounded values of A0 and b, predict the area of the pond that will be covered by algae 20 days after it was first noticed.

12d
1 mark

Comment on the reliability of your answer to part (c).

13a
2 marks

In a manufacturing process, the concentration of a pollutant in the surrounding air, P ppm (parts per million), is monitored t seconds after the process begins.

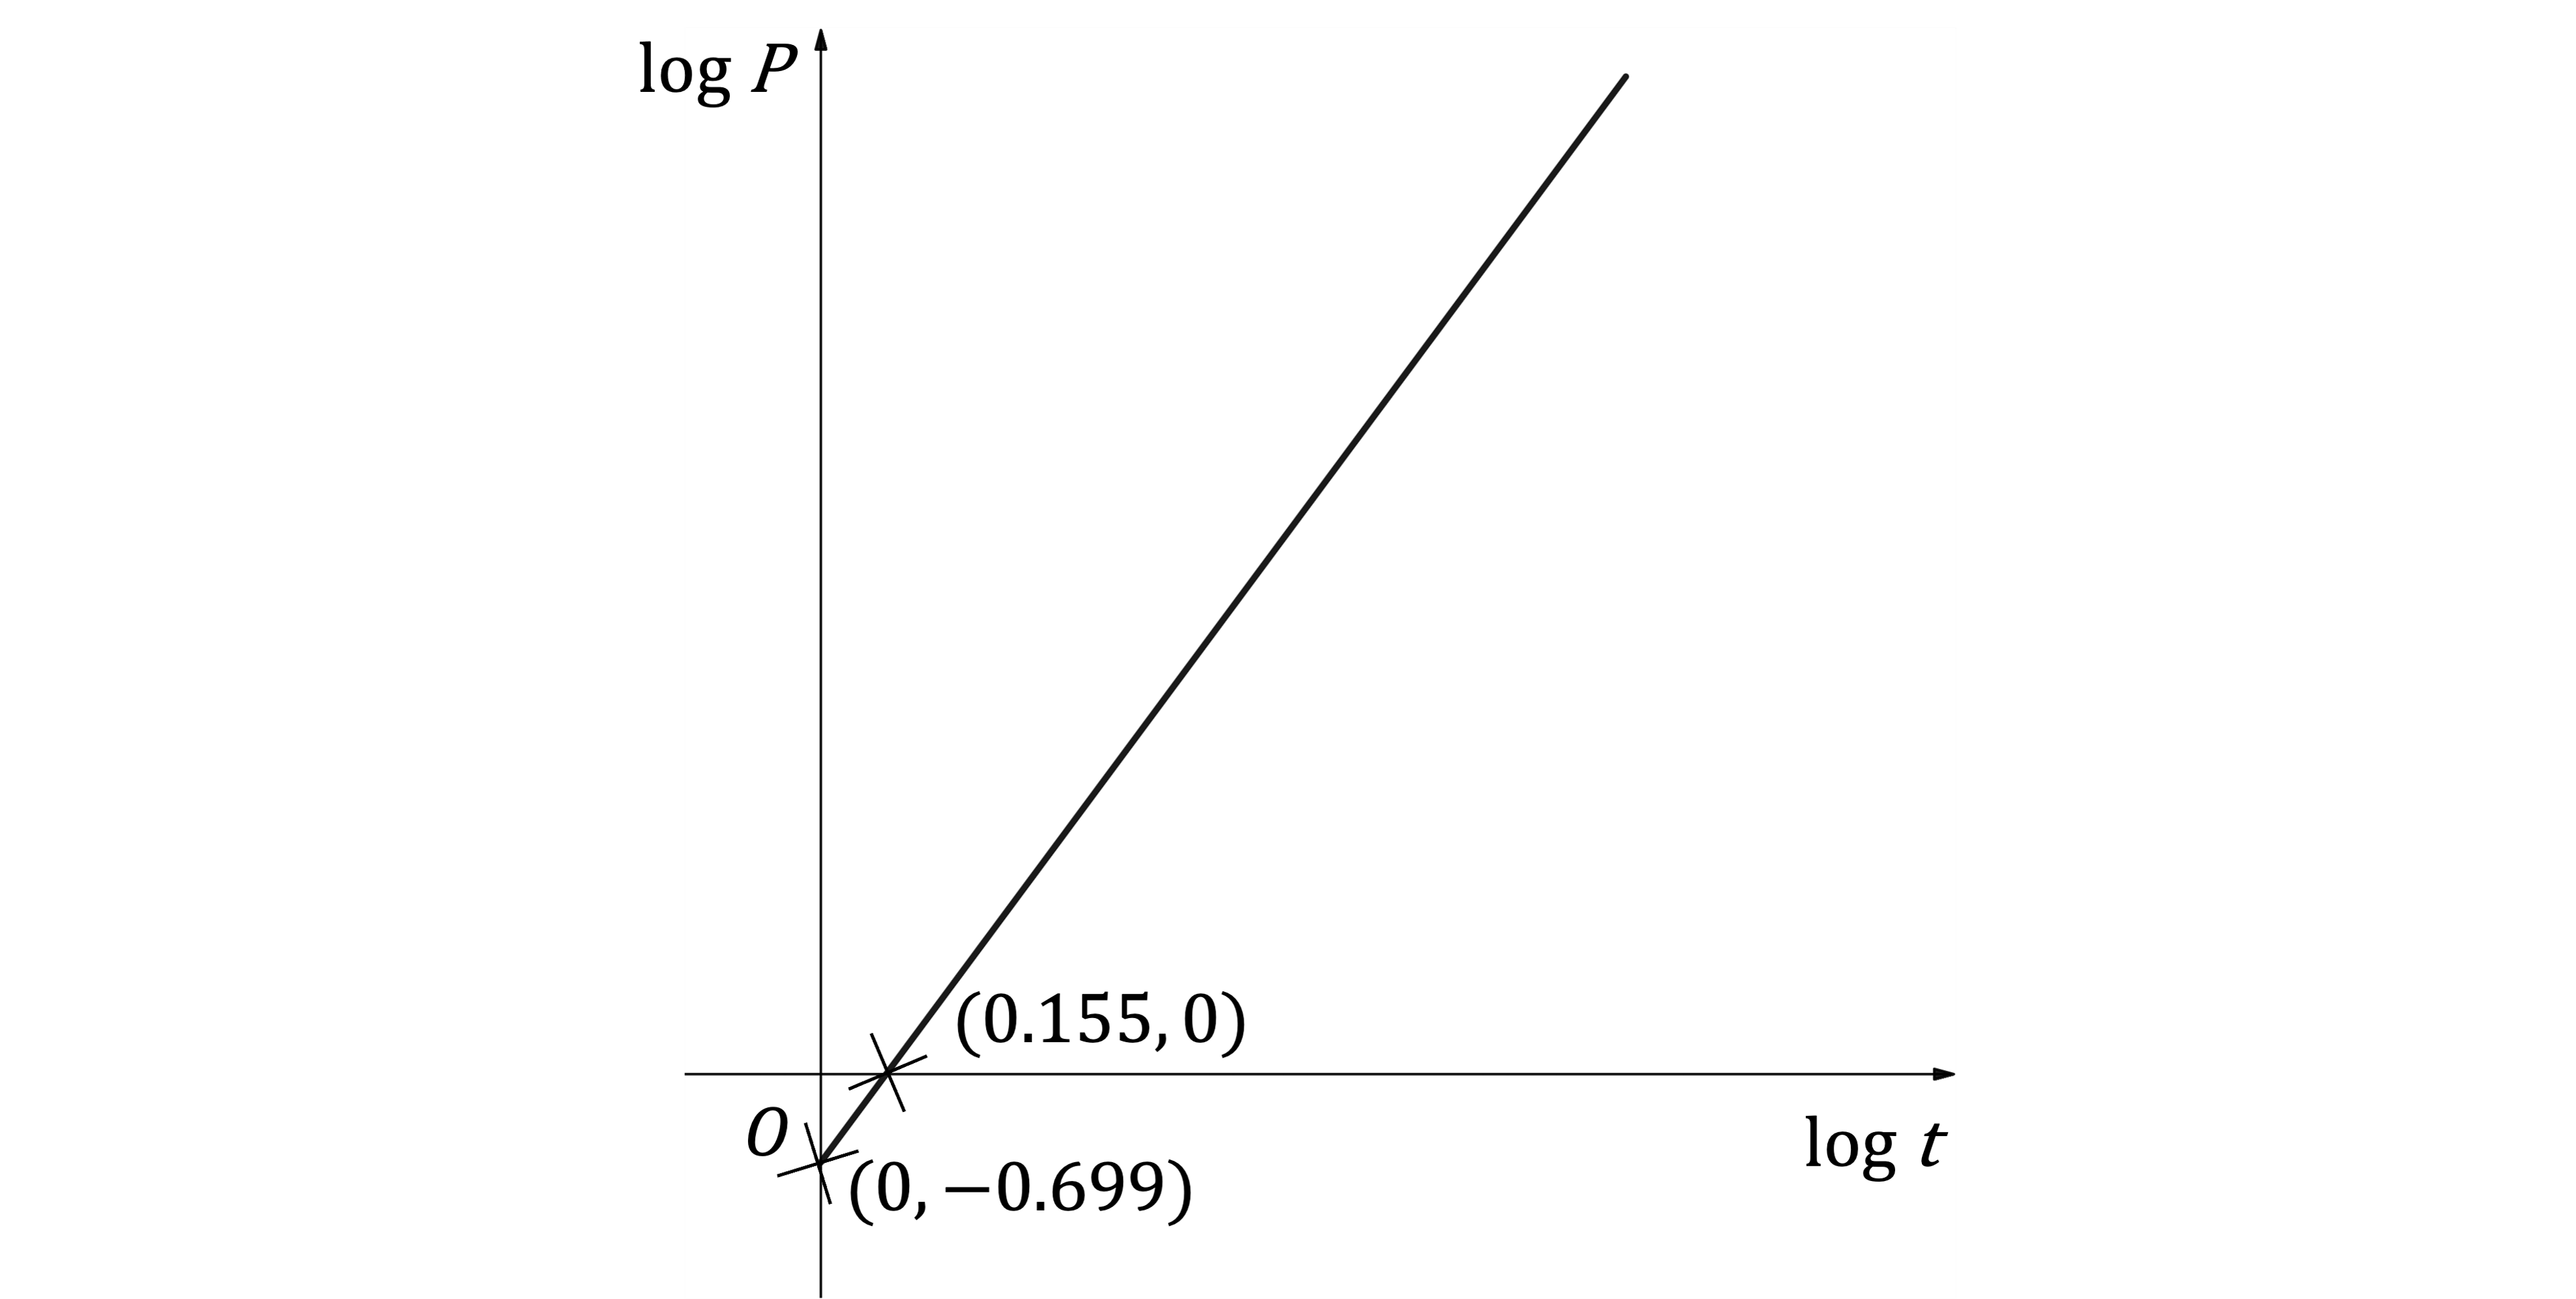
A chemist plots logP against logt, where log is to base 10, and obtains a straight line through the points (0,−0.699) and (0.155,0), as shown in the diagram.

mi-q12-2-6-further-modelling-with-functions-ib-ai-hl-medium-maths_dig

The chemist suggests that the concentration can be modelled by P=atb, where a and b are constants.

Find the gradient of the straight line.

13b
1 mark

Write down the equation of the straight line.

13c
3 marks

Find the values of a and b.

13d
2 marks

The process runs for at most 5 seconds.

Find the greatest concentration of the pollutant in the air while the process runs. Give your answer correct to 2 significant figures.

14a
3 marks

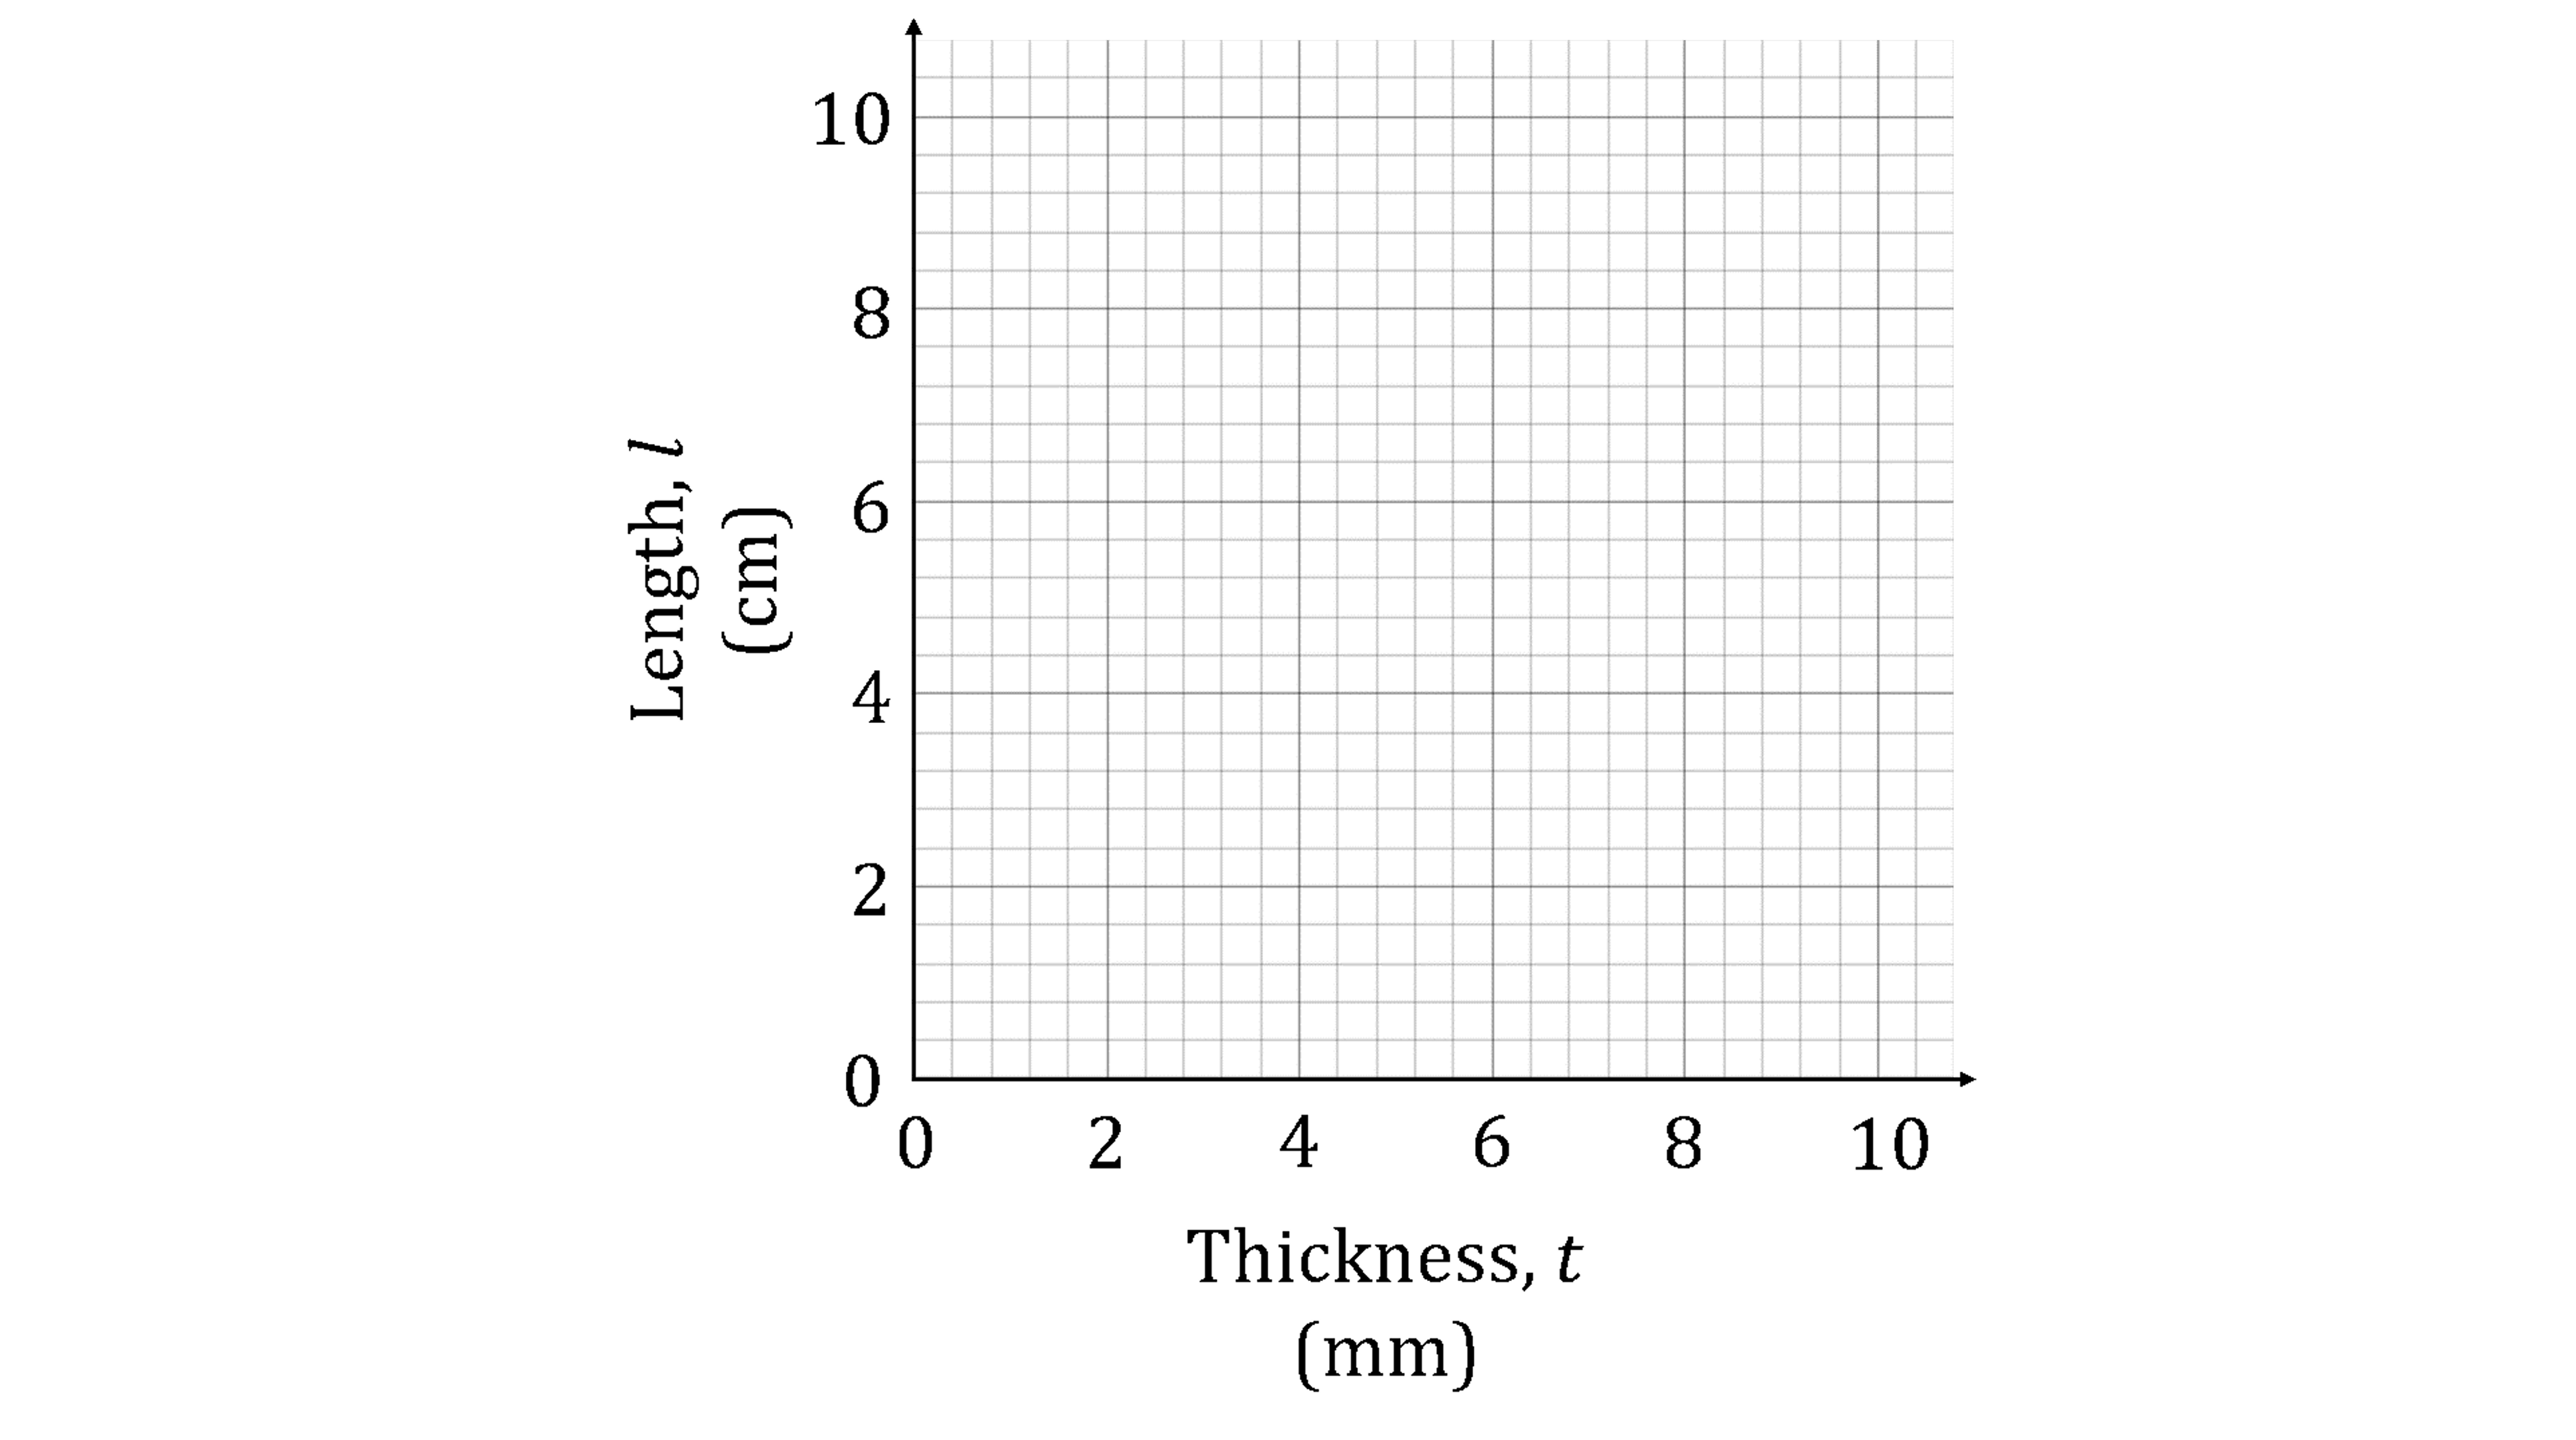
Jun is investigating the growth patterns of a certain species of slug and measures their thickness, t mm, and length, l cm. The results are shown below.

Thickness, t (mm)

9

8

4

3

6

10

Length, l (cm)

5.9

4.1

2.1

1.8

3.0

7.8

Draw a scatter diagram of the data and explain why a line of best fit should not be used for this data.

mi_q1a_4-3_further-correlation-_-regression_hard_dig
14b
4 marks

Jun thinks that an exponential model of the form l=2(1.15)t may fit the data, his sister Lily thinks that a quadratic model of the form l=0.06t2+1 is a better fit for the data.

Calculate the sum of the squared residuals, SSres, for

(i) Jun’s model, 

(ii) Lily’s model.

14c
2 marks

Hence, choose whether Jun’s model or Lily’s model best fits the data, giving a reason for your answer.

15a
2 marks

Wallace wants to model the path of some cylindrical cheeses as they roll down a hill. He measures the vertical distance from the bottom of the hill and the horizontal distance from the point at which the cheese was released at specific points on the path that the cheese takes. These measurements are recorded in the table below.

Horizontal distance, x (m)

0

1

2

3

4

5

6

7

8

Vertical distance, y (m)

8.00

7.47

6.08

4.19

2.23

0.23

0.00

0.29

1.46

By first plotting a scatter diagram on your GDC, choose whether a sinusoidal model or a power model, y=axb, would be a better fit for the data. Justify your choice.

15b
2 marks

Use your graphic display calculator to find the equation of the least squares sinusoidal regression curve for the data.

15c
2 marks

Find the coefficient of determination and comment on the closeness of fit to the original data.

15d
1 mark

Explain why this model could not be used outside of the range of the data collected.

16a
1 mark

A café in the UK begins selling ice creams on 1 April each year and keeps track of their ice cream sales each month until they stop selling them at the end of October. The results from the year 2021 are shown in the table below.

Month

April

May

June

July

August

Sept

Oct

Sales

82

142

391

516

728

312

64

Let x be the number of the month, where x=1 for April, x=2 for May, and so on.

Suggest a reason why the café owner may choose to use a quadratic function to model the monthly number of ice cream sales.

16b
2 marks

Use technology to find the equation of the least squares quadratic regression curve for the data, giving the number of sales, y, in terms of x.

16c
2 marks

Find the coefficient of determination and interpret the result in context.

16d
2 marks

The café owner believes he may have miscalculated the ice cream sales in August. Use the model to find an estimate for the true number of sales of ice creams in August. Comment on the reliability of using the model in this context.

17a
3 marks

An ecologist is researching the connection between the mass of different species of rabbits and the spread of their population. She is looking at the time taken for a population of 100 to increase to 1000 in four different species of rabbit. The table below shows the average mass of an adult male and the time, in months, for the population to reach 1000.

Rabbit species

Brush Rabbit

Lionhead

Swamp Rabbit

English Lop

Average mass, m (kg)

0.7

1.2

2.1

5.2

Time, T (months)

7

8

11

24

The ecologist believes that the amount of time for a population to reach 1000 can be modelled by an exponential function of the form T=5.89e0.273m, where T is the time in months and m is the mass in kg.

Using the exponential model, find the predicted time taken for each species to reach a population of 1000 and hence the sum of the squared residuals, SSres, for the model.

17b
3 marks

Using technology, find the coefficient of determination for

(i) the least squares exponential regression model,

(ii) the least squares quadratic regression model.

17c
2 marks

Hence state which function is more appropriate to model the amount of time for a population to reach 1000. Give a reason for your answer.

17d
1 mark

State one concern about the reliability of the model.

18a
2 marks

A biologist is researching a connection between the mass of an animal, M kg, and its expected lifespan, L years. The biologist suggests that there exists a relationship of the form L=AMB, where A and B are constants to be found.

Show that the relationship can be rewritten using logarithms to base 10 as

logL=logA+BlogM

18b
2 marks

Using data from a wide range of animals, when y=logL is plotted against x=logM on a scatter diagram there seems to be a strong positive correlation. When the regression line of y on x is calculated, the equation is found to be y=0.18x+0.98.

By relating the equation of the regression line to the equation found in part (a), or otherwise, find the values of A and B.

18c
1 mark

Hence, predict the lifespan of a horse with a mass of 600 kg to the nearest year.

18d
1 mark

The biologist concludes the research by suggesting that one way to increase your lifespan is to increase your mass.

Explain, based on these data, why the biologist may be incorrect.

19a
4 marks

A virologist is studying the growth rate of a particular type of virus when attached to a particular host cell. They record the number of cells of the virus and the time in hours that has elapsed since the virus attached to the host cell. The results are recorded in the table below.

Time, t (hours)

0

1

2

3

4

5

Number of cells, n

1

22

604

11 270

125 242

1 007 518

The virologist wants to linearise the data. They take logarithms of the number of cells for 1≤t≤5 and draw a semi-log graph of their calculated data.

Draw a semi-log graph of the calculated data y=lnn, against time, t, for 1≤t≤5.

19b
2 marks

Using the data for 1≤t≤5, find the equation of the regression line of y on t, giving your answer in the form y=at+b, where a and b are constants to be found.

19c
3 marks

By substituting y=lnn into the answer for part (b), find a model for t and n in the form n=Aect, where A and c are constants to be found.

19d
2 marks

Find an estimate for the number of virus cells present after 3.5 hours, comment on the reliability of this estimate.

1a
2 marks

As a unicorn moves through the sky its magical sparkling trail becomes more prominent and draws a crowd of elves out to see it. The unicorn flies up high into the sky for a short while, drops down to a height of just above the elves' heads and then comes to its landing place on a cliff top 10 metres above ground level. The horizontal and vertical distances, in metres, of the sparkling trail from the base of the rock that the unicorn started from have been measured for several points and recorded in the table below.

x

10

20

30

40

50

60

y

53

82

116

95

3

10

Find the equation of the least squares cubic regression curve for the data, giving all coefficients correct to four significant figures.

1b
2 marks

Find the coefficient of determination for the cubic model found in part (a) and comment on how well the model fits the data.

1c
3 marks

State an alternative type of model that may be more suitable for the data and find

(i) an equation for this model,

(ii) the coefficient of determination for this model.

1d
2 marks

Comment on why this model is a better fit for the sparkling trail than the cubic model.

2a
5 marks

Scientists are collecting information about oxygen levels and temperature in the ocean. They collect data from various different sites. The information is recorded in the table below.

Temperature at surface, T (°C)

13.2

11.1

23.6

15.1

4.2

29.1

19.1

Dissolved oxygen content, D (mg per litre)

9.1

10.9

8.7

9.0

13.6

8.1

8.8

Use your graphic display calculator to

(i) find the equations of the least squares quadratic regression curve and the least squares power regression curve, D=aTb, for the data,

(ii) investigate whether the quadratic or the power model fits the data better, giving a reason for your answer.

2b
1 mark

Explain what action the scientists could take to further investigate which model is best.

2c
3 marks

For both models found in part (a), find an approximation for the dissolved oxygen content in an ocean whose surface temperature is 35 °C and comment on the validity of your answers.

3a
4 marks

A new company believes that their net profit, P thousand dollars, t months after opening, can be modelled by the equation

P(t)=Atebt, A, b∈ℝ

Their net profit at different times over the first year is given in the table below.

t (months)

2

5

10

12

P (thousand dollars)

0.2

2.5

51.6

201.9

Given that A=0.04 and b=0.5, calculate the sum of the squared residuals, SSres, for this model.

3b
3 marks

Show that a second model for the net profit over time can be given as

lnP=0.6764t−2.764

3c
3 marks

The sum of the squared residuals for the second model is 94.5.

Choose the model that fits the data better, giving a reason, and use it to find an estimate for the net profit gained by the company after 20 months.

3d
1 mark

Comment on the reliability of the answer found in part (c), giving a reason for your answer.

4a
2 marks

A model of the form V=A×3r, where A>0, is proposed by an internet search engine to estimate the number of visits per day to websites.

Each website is given a rank, r, where 0≤r≤10, based on how popular the search engine company decides that website is.

Write down, in terms of A, the lowest and highest possible numbers of visits a website can achieve in a single day according to the model.

4b
2 marks

Sketch the graph of logV against r, where log is to base 10. Label the points corresponding to the answers found in part (a).

4c
2 marks

Given that the graph of logV against r passes through the point (5,5.08), find the value of A. Give your answer correct to one significant figure.

4d
2 marks

Show that a website with a rank of 7 would have approximately 80 times as many visits per day as a website with a rank of 3 would have.

5a
5 marks

Olivia is modelling a new bowl for her pottery shop. She models the outline of one side of the bowl on a 2D Cartesian coordinate grid and plans to rotate the design 360° about the y-axis. The coordinates Olivia uses to plot the cross-section are given in the table below.

Point

A

B

C

D

E

F

G

H

I

x

5

6

8

10

12

14

16

18

18

y

0

2

4

5

6

6

8

10

12

Point A is connected to the origin, and point I is connected to the point (0, 12) with a straight, horizontal line.

Olivia initially models all of the points using a cubic curve.

(i) Find the equation of the least squares regression cubic curve for all nine points.

(ii) Find the coefficient of determination for the cubic model.

(iii) Explain why this model is not a good model for all of the points and state which points Olivia should use a different model for. Use mathematical reasoning to validate your argument.

5b
3 marks

Olivia decides instead to use two different linear models between points A and C and C and E and then use a quadratic model to connect points E, F, G, H and I. Find the equation of this quadratic model and write down a problem with using this model instead.

5c
1 mark

Suggest a reason, in the context of the bowl, why points H and I have the same x-coordinate.

6a
3 marks

Consider the function v, where v is a function of t and 1≤t≤10.

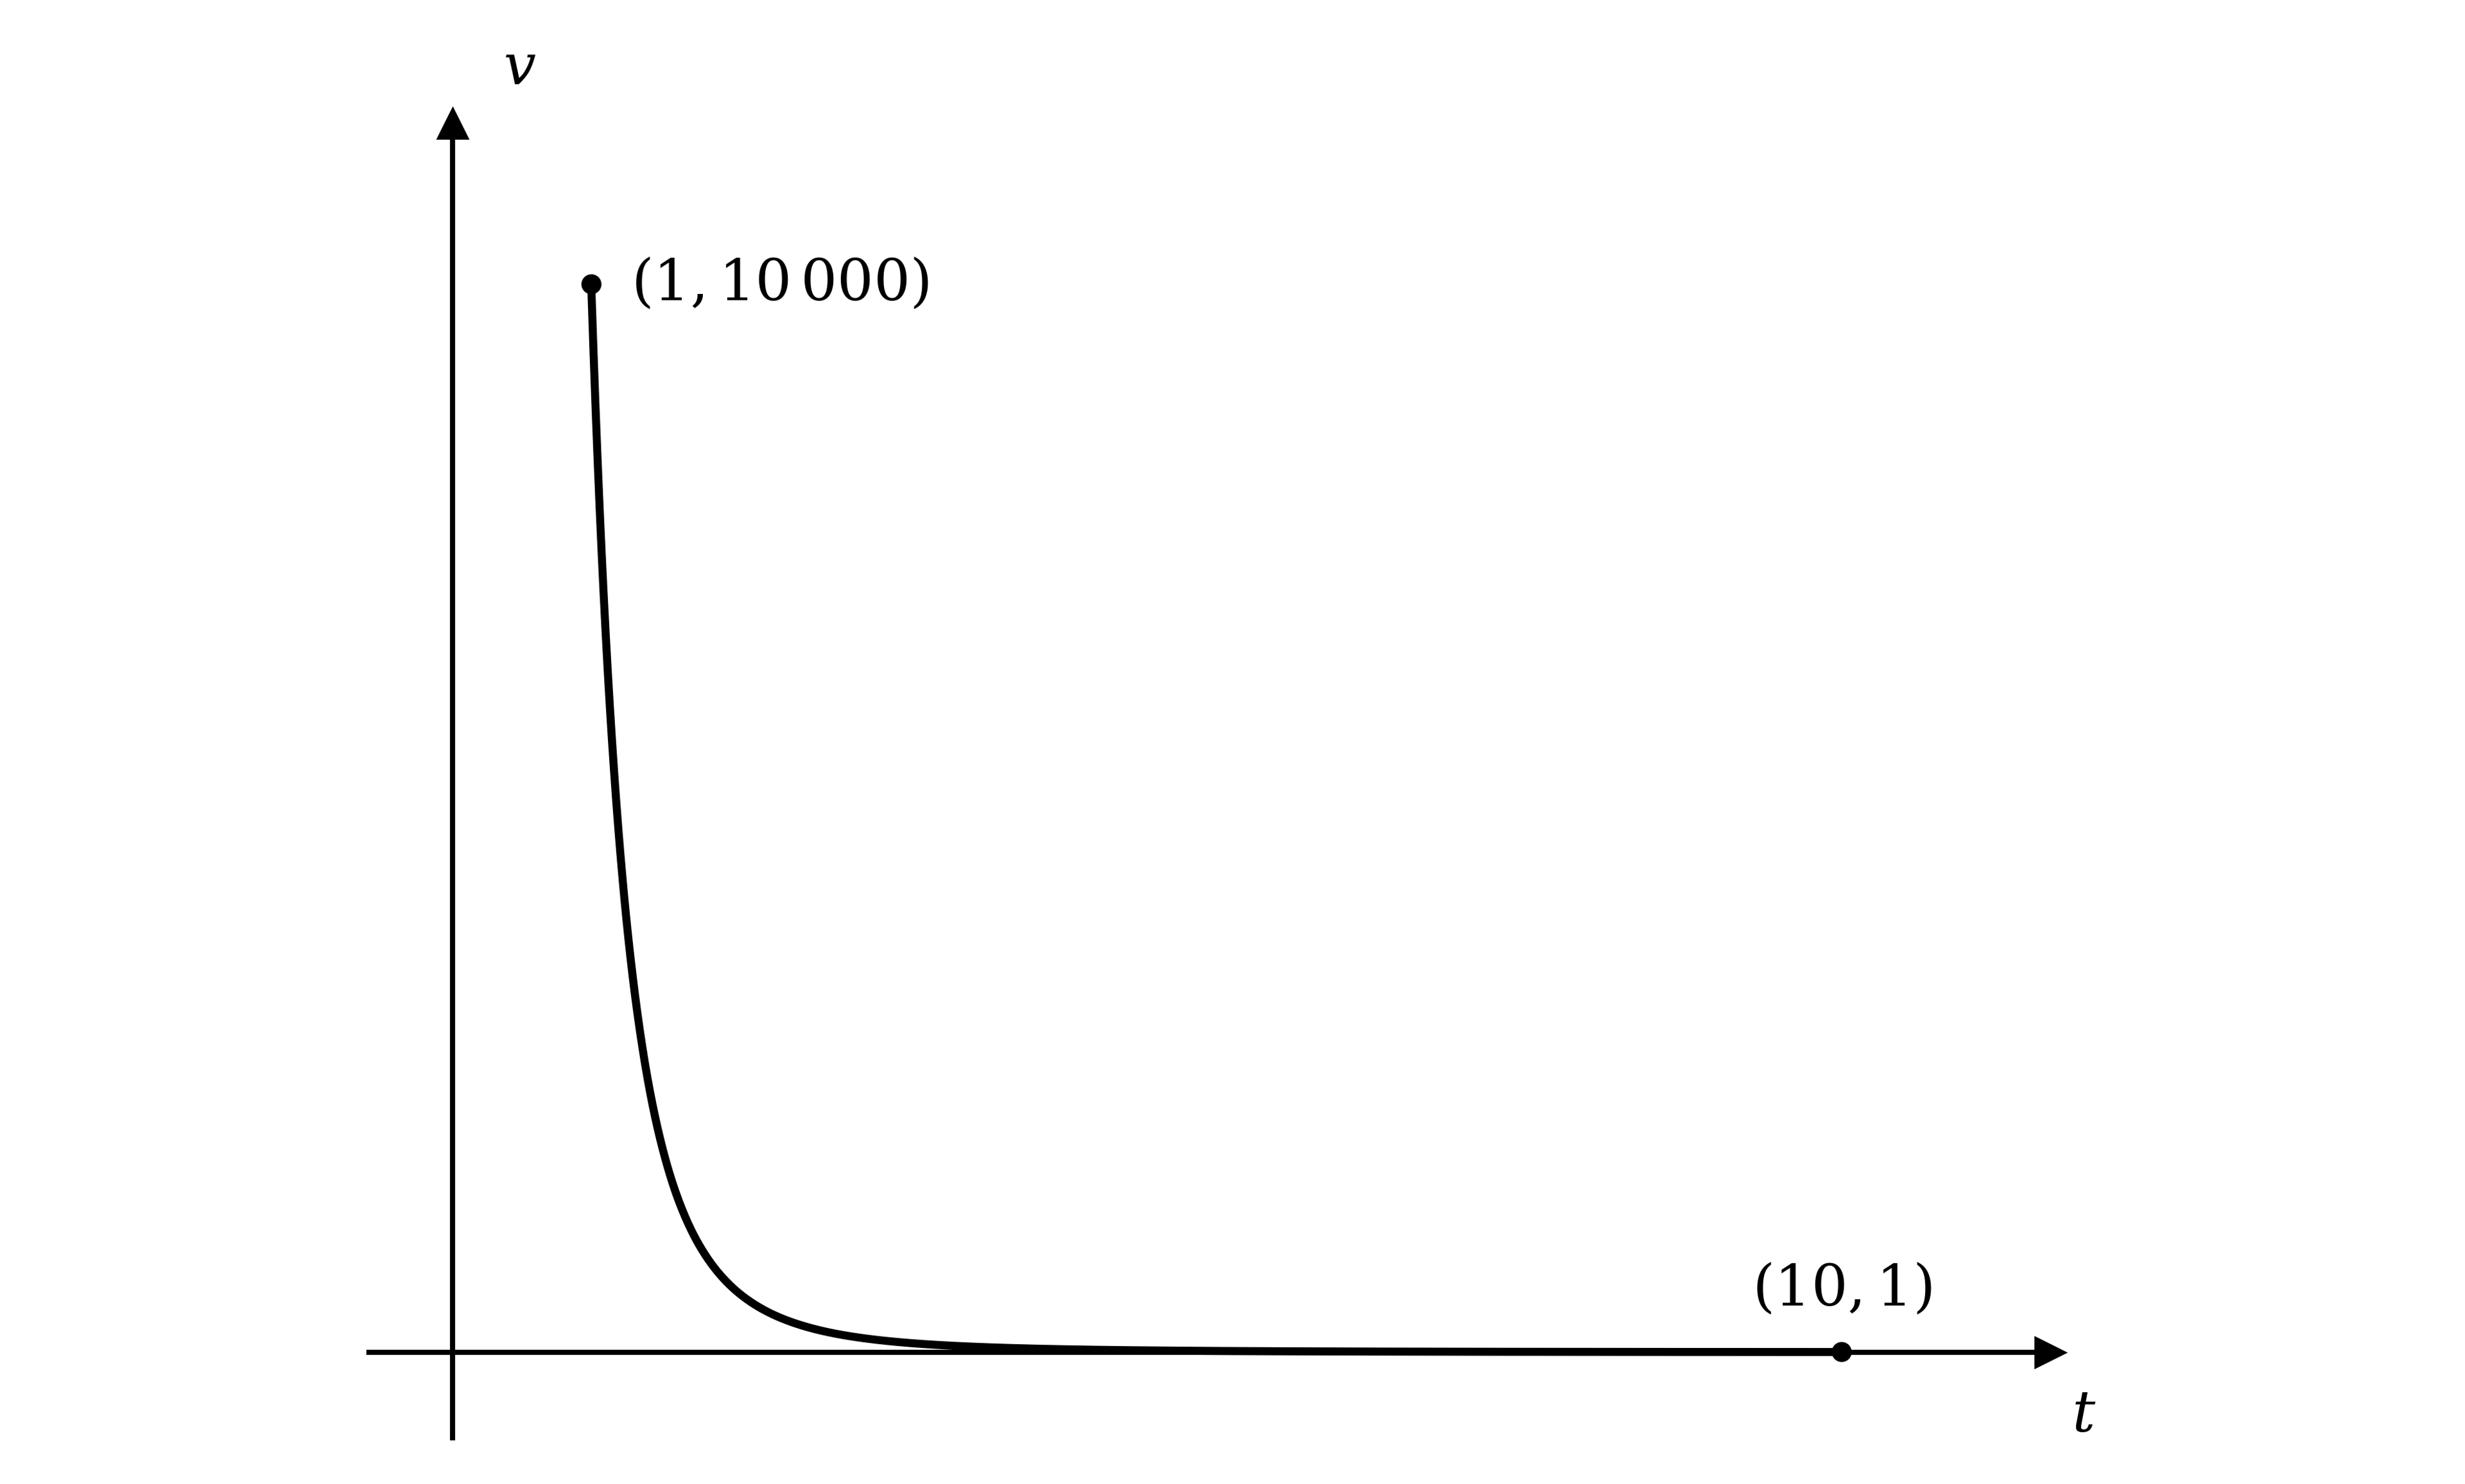
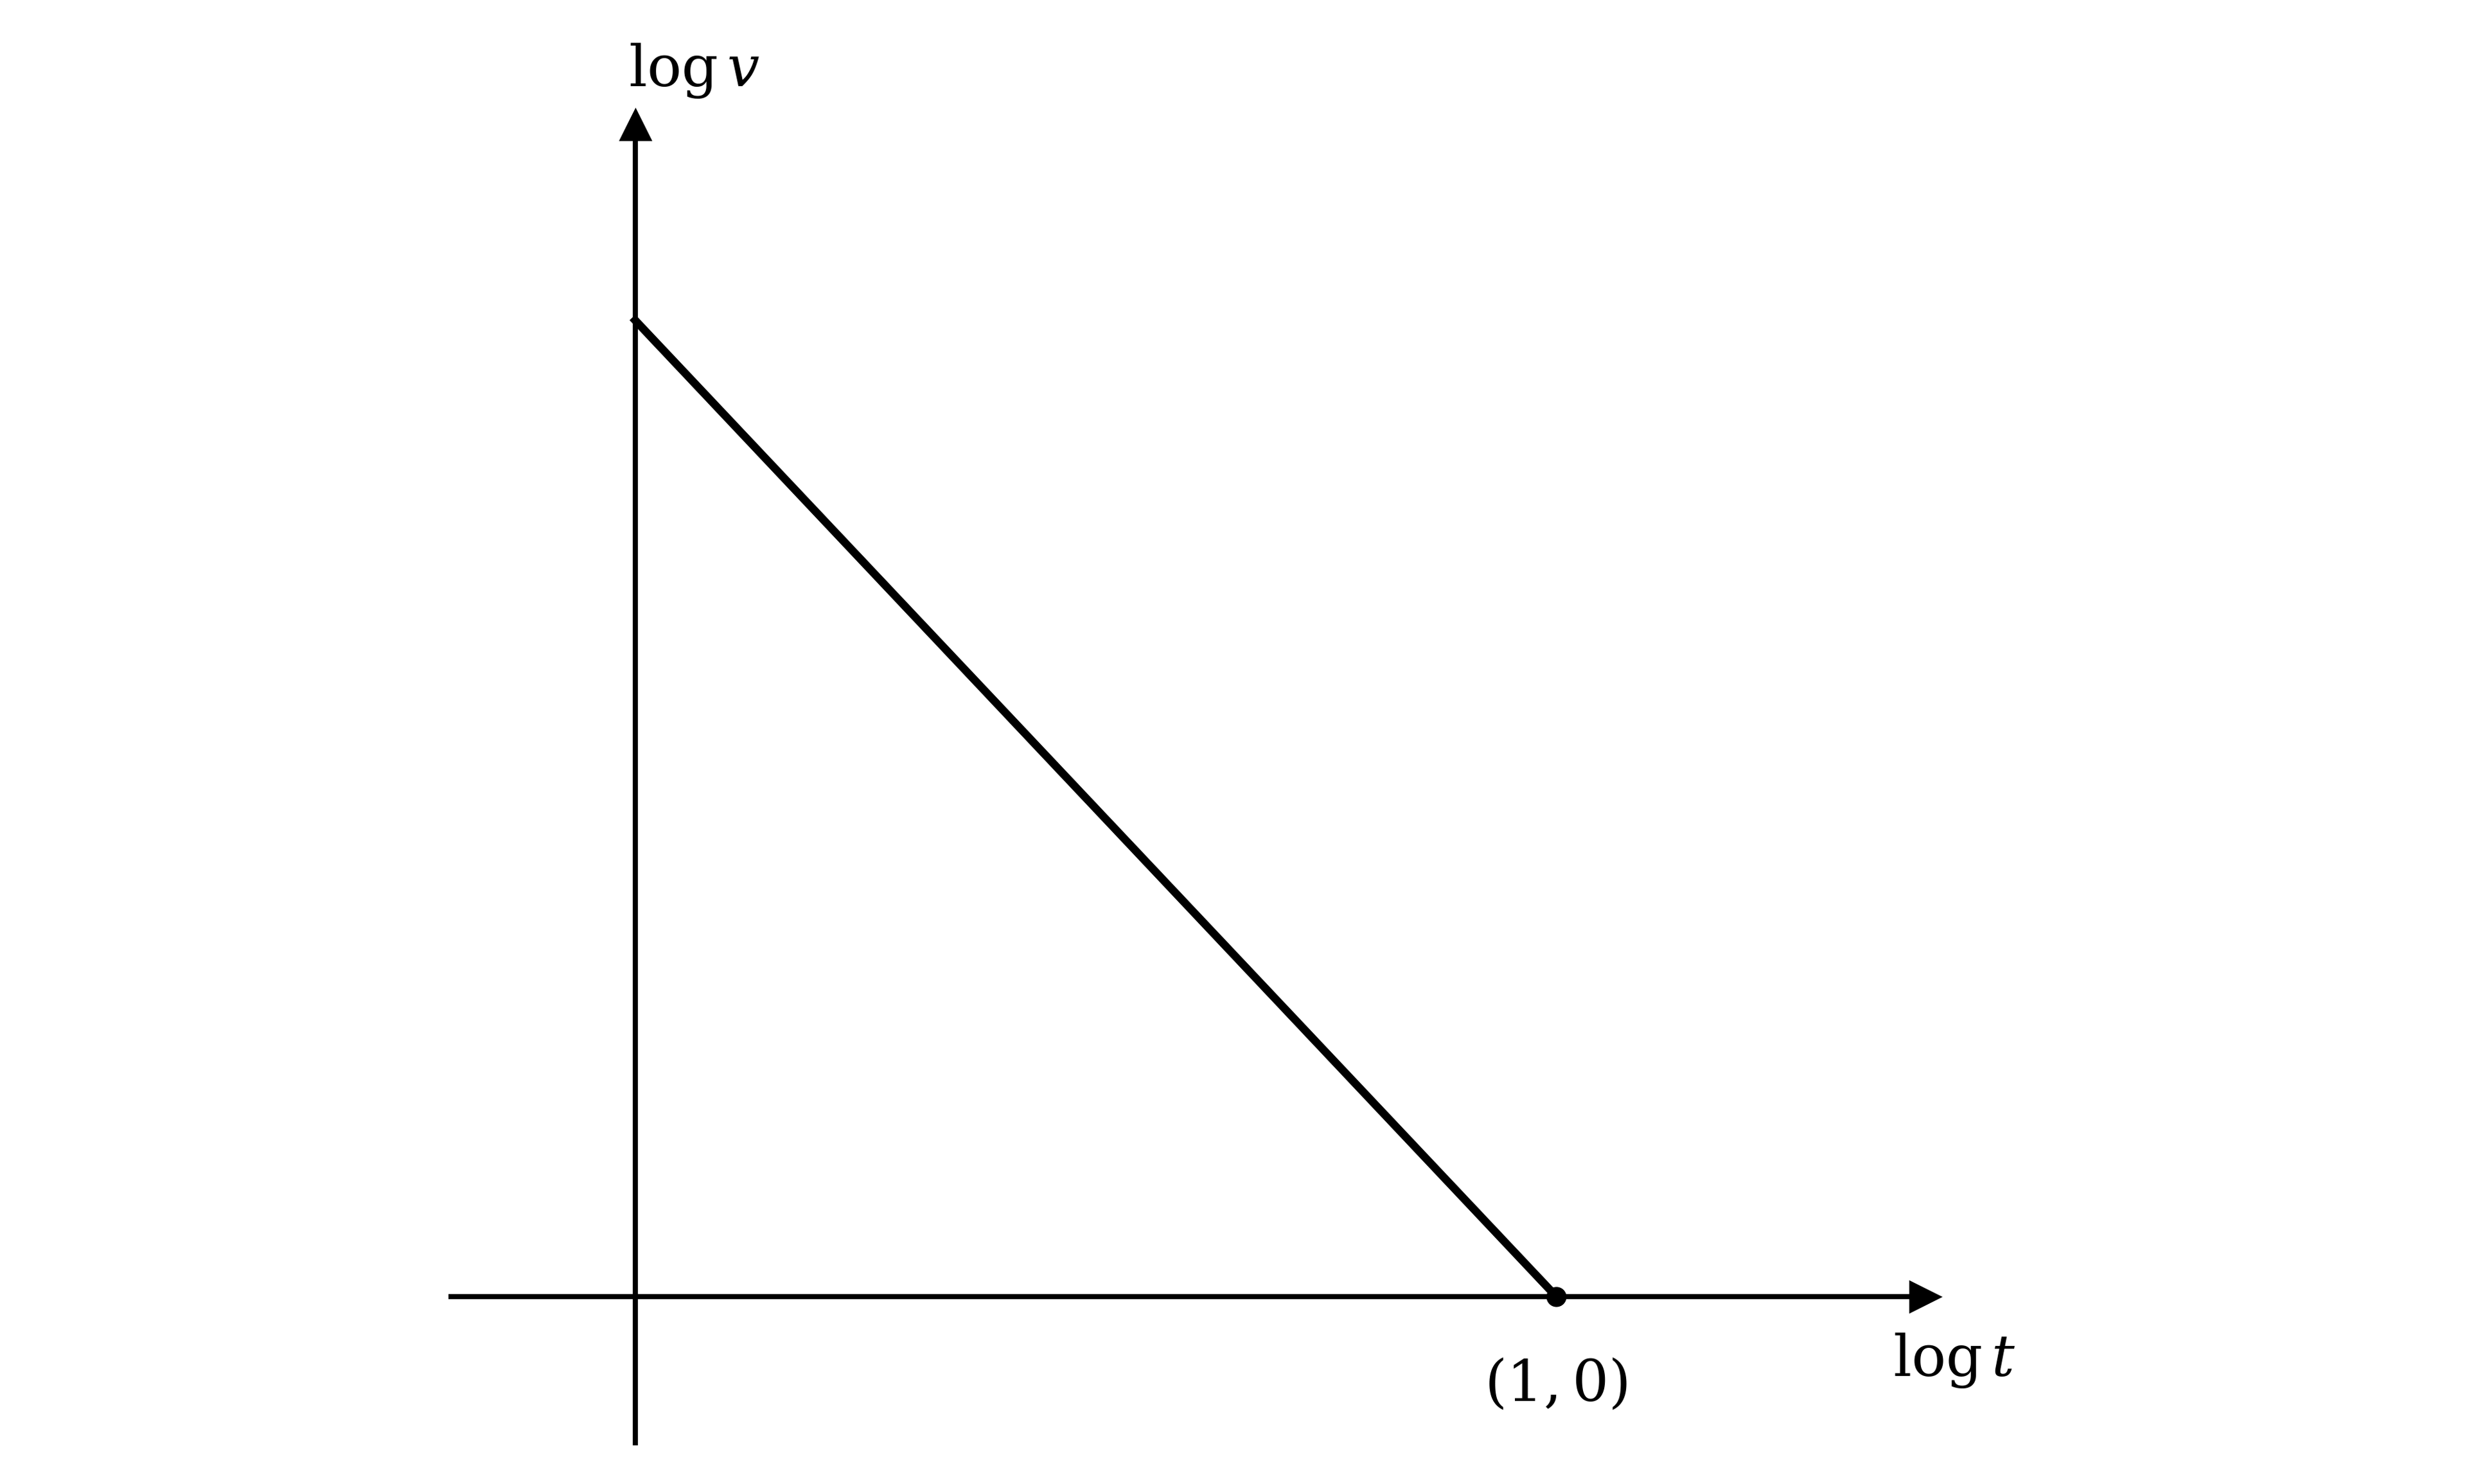
Sketches of the graph of v against t and of the graph of logv against logt, where log is to base 10, are shown below.

Sketch of v against t for 1 ≤ t ≤ 10: a decreasing curve from the labelled point (1, 10 000) to the labelled point (10, 1)
Sketch of log v against log t: a straight line that starts on the vertical axis and ends at the labelled point (1, 0) on the horizontal axis

The graph of v against t has end points (1,10 000) and (10,1). The graph of logv against logt is a straight line that ends at (1,0).

Use the information given in the graph sketches to find v in terms of t.

6b
3 marks

The number of calculations, C, a supercomputer can perform per second is related to the speed of its processor, s GHz.

The graph of C against s is an exponential curve passing through the point (4,2×10⁸).

The semi-log graph of logC against s, where log is to base 10, is a straight line passing through the point (3,8).

Find C as a function of s.

7a
4 marks

The Theoretical Zipf Distribution relates the rank and the frequency of words used in the English language.

For a large body of text, a word of rank r appears f times, where f=kr−1 and k is the number of times the most used word occurs.

The graph below shows logf plotted against logr, where log is to base 10, for a particular novel in which the most used word is "the", which occurs 5623 times.

Graph showing a downward diagonal line on a logarithmic scale, passing through (1, 2.6) and (3, 0.3) with labels logf and logr.

The graph passes through the points (1,2.6) and (3,0.3).

Use the graph to find f in terms of r and comment on whether the distribution of words in this novel follows the Theoretical Zipf Distribution.

7b
2 marks

The 8th ranked word in the novel is "was".

Use your answer to part (a) to estimate how many times "was" is used in the novel.

8a
2 marks

Gromit is researching the perfect basketball shot to get the basketball into a net of height 3.5 metres. He records himself taking ten shots from the same position and uses tracking software to measure the vertical and horizontal distances of the ball from the net t seconds after he shoots the ball. The mean distances are recorded in the table below. A positive value means the ball is above or in front of the net and a negative value means the ball is below or behind the net.

Time, t (seconds)

0.0

0.3

0.6

0.9

1.2

1.5

1.8

Horizontal distance, x (m)

2.52

2.44

2.07

1.12

0.28

0.01

-0.02

Vertical distance, y (m)

-2.05

0.56

2.98

4.09

2.23

0.23

-0.08

Find the height from which Gromit throws the ball.

8b
5 marks

Find the equations of the least squares quadratic and cubic regression curves of y on x, and the coefficient of determination for each.

Gromit chooses the cubic model because its coefficient of determination is higher. Comment on the validity of his method of choosing a model.

9a
3 marks

Jusef is modelling the height of some water as it drains out of a conical tank. He believes that the vertical distance of the water in the tank from the top of the tank, H cm, at time t seconds, can be modelled using the equation H=Abt, where A, b∈ℝ.

Time, t (seconds)

1

5

7

10

12

14

15

Distance from top, H (cm)

0.1

1.3

2.2

5.1

9.4

16.2

26.0

Find the equation of the least squares regression curve and hence write down the values of A and b.

9b
2 marks

Use mathematical reasoning to comment on the suitability of the model found in part (a).

9c
4 marks

Jusef linearises the data by plotting logH against t on a semi-log graph, where log is to base 10.

Calculate

(i) the equation of the least squares regression line of logH on t,

(ii) Pearson's product-moment correlation coefficient, r, and comment on the validity of the regression line found in part (c)(i).

10a
1 mark

Oakley records the vertical height, h metres, of a red kite in flight over the course of 20 seconds. He wishes to find an equation that will model the height of the red kite.

The heights at some times, t seconds after Oakley starts recording, are shown in the table below.

Time, t (s)

0.5

2.2

4.7

8.2

12.1

14.6

16.3

17.7

19.1

Height, h (m)

19.3

19.2

19.1

18.7

18.2

1.9

1.8

1.4

1.5

Suggest a reason why Oakley may choose to use a logistic function to model the height of the red kite.

10b
2 marks

Oakley uses technology to fit the logistic model

h=19.11+1.48×10⁻¹²e2.01t

State a suitable domain for the model and interpret the value 19.1 in context.

10c
1 mark

Use the model to estimate the height of the red kite at t=9.8 seconds.

10d
1 mark

Oakley noted that the red kite was level with his window at a certain point on its flight. If Oakley’s window is 11.1 metres above ground level, find an approximation for the time at which the red kite was level with his window.

11a
3 marks

The velocity, v m s−1, of a vehicle was recorded over 6 seconds and the results are plotted in the velocity-time graph below.

mi_q6a_4-3_further-correlation-_-regression_dig

Use the points on the graph to find the equation of the least squares quadratic regression curve for v in terms of t.

11b
2 marks

Write down the value of R2 and interpret what it tells you about the model.

11c
3 marks

Use the trapezoidal rule with the points on the graph to find an estimate for the distance travelled by the vehicle.

11d
2 marks

By considering the shape of the model found in part (a), explain whether your answer to part (c) is an overestimate or an underestimate of the actual distance travelled.

11e
2 marks

Use the model found in part (a) to find a better estimate for the distance travelled by the vehicle.

12a
3 marks

Each year during the dry season in a particular country a man-made trapezoidal reservoir empties completely and then begins to refill when the rains reappear. In 2021 Bea collected information about the height of the water level a certain number of days after the beginning of the rainy season. Bea believes that the vertical height of the water from the bottom of the reservoir, H metres, can be modelled using the equation H=Atb, where A, b∈ℝ and t is the number of days since the beginning of the rainy season.

Time, t (days)

1

2

3

5

10

20

40

Height, H (m)

1.5

3.8

5.7

8.3

14.5

24.9

30.0

Find the equation of the least squares regression curve and hence write down the values of A and b.

12b
2 marks

Use mathematical reasoning to comment on the suitability of the model found in part (a).

12c
3 marks

Bea wants to linearise the data using logarithms to base 10.

(i) Suggest, with a reason, whether Bea should use a semi-log graph or a log-log graph to linearise her data.

(ii) For this graph, find the equation of the least squares regression line.

1a
1 mark

Effie is carrying out some research into dragon egg incubation patterns. She studies six dragon eggs and records the number of days it takes for each egg to hatch and the wingspan of the newly hatched dragon. Some of Effie's data are displayed in the following table.

Incubation time, t (days)

22

58

41

13

96

11

Wingspan, l (cm)

52.368

x

59.151

y

34.016

16.761

Effie uses a least squares regression curve of the form l=at3+bt2+ct−52 to model the data and calculates the sum of the squared residuals, SSres, to be zero.

Explain what a value of SSres=0 tells you about the curve and the data.

1b
4 marks

Use the data given in the table to find the values of a, b and c and hence find the values of x and y.

1c
3 marks

Effie manages to collect data on one more dragon egg, which has an incubation period of 33 days. Using the same model, with the same values of a, b and c, Effie now calculates the sum of the squared residuals to be 0.0441.

Find the two possible wingspan lengths of this newly hatched dragon.

2a
4 marks

Paul moors his sailboat in a harbour and wants to come up with a model for the daily tidal pattern at a certain time of year. He collects data on the depth of the water every hour over a 24-hour period and uses it to calculate a least squares regression curve of the form D=asin(π12(t−2))+b, where D is the water depth in metres and t is the number of hours after midnight. Some of his data are given in the table below, where each residual is the observed depth minus the depth given by the model.

Time, t (hours)

3

8

16

20

Depth, D (metres)

x

12.87

7.12

4.93

Residual

0.065

-0.13

0.12

y

Use the information in the table to find the values of a and b.

2b
3 marks

Hence, find the values of x and y.

2c
2 marks

Find an estimate for the maximum and minimum tidal depths and the times at which they should occur.

3a
4 marks

A researcher in a particular fitness centre has been collecting data on the number of sleeveless T-shirts sold per week, T, and the number of new gym memberships per week, G. The data are shown in the table below.

T

119

54

92

25

442

340

9

261

G

50

15

25

12

129

22

8

21

The researcher suspects that T and G are related in one of two ways:

T=aGm or T=bpG

where a, b, m and p are constants.

By finding the values of a, b, m and p, and the coefficient of determination given by your GDC for each model, decide which model better represents the relationship between T and G.

3b
3 marks

Without carrying out any further calculations,

(i) write down which model has the higher value of the product-moment correlation coefficient for its linearised data, giving a reason for your answer,

(ii) explain whether it would be best to represent the data on a semi-log graph or a log-log graph.

3c
1 mark

Hence, calculate the value of the product moment correlation coefficient for the chosen model in part (a).

4a
4 marks

When brewing beer, the temperature at which the beer is stored during fermentation, T °C, changes the alcohol content, A %, at the end of the fermentation process. A group of brewers collect data on T and A for their casks of beer. They suspect the data follow a model of the form A=bpT, where b and p are unknown constants. They plot the regression line of y=lnA on x=T and find that the line has a gradient of 0.0392 and passes through the point (0, 0.811).

Using the regression line, calculate the values of b and p.

4b
6 marks

In the data collected by the brewers, the range of values for T was 15 and the range of values for A  was 4. The minimum alcohol content occurred when the temperature was at its minimum and the maximum alcohol content occurred when the temperature was at its maximum.

Find estimates for the minimum values of T and A to 2 significant figures.

4c
1 mark

Hence explain why it would not be appropriate to use the model to predict the alcohol content of beer when the temperature during fermentation is 50 °C.

5a
3 marks

Nora is building a skate ramp for a project at school. She models the first part of the ramp using the points A(0, 5), B(1, 8), C(5, 15) and D(10, 18). These four points fit a cubic model of the form y=ax3+bx2+cx+d.

Find the model for this section of Nora's skate ramp, giving a, b, c and d as exact values. Hence, write down the value of the sum of the squared residuals.

5b
4 marks

Nora models the next part of her skate ramp, starting from the point D, using a curve with equation

y=acos(0.1(x−10))+b

The curve passes through D. The skate ramp also goes through the point E(23, 7), which has a residual of −0.0124824, to six significant figures, for this curve, where a residual is the observed y-value minus the y-value given by the curve.

Find the values of a and b.

5c
2 marks

The final section of Nora's skate ramp goes from E through the points F(30, 2), G(35, 0), H(40, 2) and I(60, 15). Nora models the points E, F, G, H and I using the quadratic model y=0.028x2−2.1x+40.

Find the equation of the least squares sine regression curve for the points E, F, G, H and I.

5d
4 marks

By finding the sum of the squared residuals for each model, show that the model found in part (c) is a better fit for the points E, F, G, H and I than Nora's quadratic model.