Tree Diagrams (DP IB Applications & Interpretation (AI)): Revision Note

Did this video help you?
Tree diagrams
What is a tree diagram?
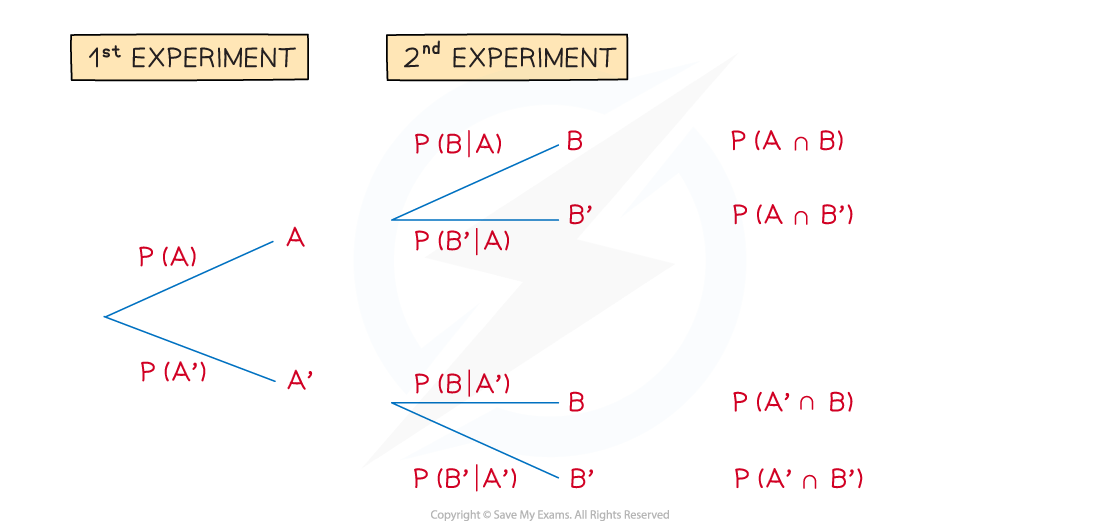
A tree diagram is another way to show the outcomes of combined events
They are very useful for intersections of events
The events on the branches must be mutually exclusive
Usually they are an event and its complement
The probabilities on the second sets of branches can depend on the outcome of the first event
These are conditional probabilities
When selecting the items from a bag:
The second set of branches will be the same as the first if the items are replaced
The second set of branches will be the different to the first if the items are not replaced
How are probabilities calculated using a tree diagram?
To find the probability that two events happen together you multiply the corresponding probabilities on their branches
It is helpful to find the probability of all combined outcomes once you have drawn the tree
To find the probability of an event you can:
add together the probabilities of the combined outcomes that are part of that event
For example:
%3C%2Fmo%3E%3Cmo%3E%3D%3C%2Fmo%3E%3Cmi%20mathvariant%3D%22normal%22%3EP%3C%2Fmi%3E%3Cmo%3E(%3C%2Fmo%3E%3Cmi%3EA%3C%2Fmi%3E%3Cmo%3E%26%23x2229%3B%3C%2Fmo%3E%3Cmi%3EB%3C%2Fmi%3E%3Cmo%3E)%3C%2Fmo%3E%3Cmo%3E%2B%3C%2Fmo%3E%3Cmi%20mathvariant%3D%22normal%22%3EP%3C%2Fmi%3E%3Cmo%3E(%3C%2Fmo%3E%3Cmi%3EA%3C%2Fmi%3E%3Cmo%3E%26%23x2229%3B%3C%2Fmo%3E%3Cmi%3EB%3C%2Fmi%3E%3Cmo%3E'%3C%2Fmo%3E%3Cmo%3E)%3C%2Fmo%3E%3Cmo%3E%2B%3C%2Fmo%3E%3Cmi%20mathvariant%3D%22normal%22%3EP%3C%2Fmi%3E%3Cmo%3E(%3C%2Fmo%3E%3Cmi%3EA%3C%2Fmi%3E%3Cmo%3E'%3C%2Fmo%3E%3Cmo%3E%26%23x2229%3B%3C%2Fmo%3E%3Cmi%3EB%3C%2Fmi%3E%3Cmo%3E)%3C%2Fmo%3E%3C%2Fmath%3E--%3E%3Cdefs%3E%3Cstyle%20type%3D%22text%2Fcss%22%3E%40font-face%7Bfont-family%3A'math1f762cde104efe524ba792b6cfd'%3Bsrc%3Aurl(data%3Afont%2Ftruetype%3Bcharset%3Dutf-8%3Bbase64%2CAAEAAAAMAIAAAwBAT1MvMi7iBBMAAADMAAAATmNtYXDEvmKUAAABHAAAAFRjdnQgDVUNBwAAAXAAAAA6Z2x5ZoPi2VsAAAGsAAAClGhlYWQQC2qxAAAEQAAAADZoaGVhCGsXSAAABHgAAAAkaG10eE2rRkcAAAScAAAAGGxvY2EAHTwYAAAEtAAAABxtYXhwBT0FPgAABNAAAAAgbmFtZaBxlY4AAATwAAABn3Bvc3QB9wD6AAAGkAAAACBwcmVwa1uragAABrAAAAAUAAADSwGQAAUAAAQABAAAAAAABAAEAAAAAAAAAQEAAAAAAAAAAAAAAAAAAAAAAAAAAAAAAAAAAAAAACAgICAAAAAg1UADev96AAAD6ACWAAAAAAACAAEAAQAAABQAAwABAAAAFAAEAEAAAAAMAAgAAgAEACcAKwA9IikiKv%2F%2FAAAAJwArAD0iKSIq%2F%2F%2F%2F2v%2FX%2F8bd293bAAEAAAAAAAAAAAAAAAAAAAFUAywAgAEAAFYAKgJYAh4BDgEsAiwAWgGAAoAAoADUAIAAAAAAAAAAKwBVAIAAqwDVAQABKwAHAAAAAgBVAAADAAOrAAMABwAAMxEhESUhESFVAqv9qwIA%2FgADq%2FxVVQMAAAEAVQHVANUDKwADABsYAbAEELEABfSxAQP0sQUF9ACwBBCxAAL0MDETMwMjVYBWKgMr%2FqoAAQCAAFUC1QKrAAsASQEYsgwBARQTELEAA%2FaxAQT1sAo8sQMF9bAIPLEFBPWwBjyxDQPmALEAABMQsQEG5LEBARMQsAU8sQME5bELBfWwBzyxCQTlMTATIREzESEVIREjESGAAQBVAQD%2FAFX%2FAAGrAQD%2FAFb%2FAAEAAAIAgADrAtUCFQADAAcAZRgBsAgQsAbUsAYQsAXUsAgQsAHUsAEQsADUsAYQsAc8sAUQsAQ8sAEQsAI8sAAQsAM8ALAIELAG1LAGELAH1LAHELAB1LABELAC1LAGELAFPLAHELAEPLABELAAPLACELADPDEwEyE1IR0BITWAAlX9qwJVAcBV1VVVAAEAgAAAAtUDKwAQAGEYAbARELEAA%2FawDzyxAQX9sAM8sQQF%2FLAOPLAAELAJ1LALPLESA%2BaxCAX9sAY8sQUF%2FLAMPACxDQI%2FsQ8D%2FbALPLAQ3bAKPLANELEEBf2wBTyxAwP9sAY8sQEAP7AIPDEwOwERNDYgFhURMxE0JiMiBhWAVVYBAFVVqoCAqwIAVYCAVf4AAgCrgICrAAEAgAAAAtUDKwAQAGEYAbARELEAA%2FawDzyxAQX9sAM8sQQF%2FLAOPLAAELAJ1LALPLESA%2BaxCAX9sAY8sQUF%2FLAMPACxDQI%2FsQ8D%2FbALPLAQ3bAKPLANELEEBf2wBTyxAwP9sAY8sQEAP7AIPDEwEzMRFBYgNjURMxEUBiMiJjWAVVYBAFVVqoCAqwMr%2FgBWgIBWAgD%2BAKuAgKsAAQAAAAEAANV4zkFfDzz1AAMEAP%2F%2F%2F%2F%2FWOhNz%2F%2F%2F%2F%2F9Y6E3MAAP8gBIADqwAAAAoAAgABAAAAAAABAAAD6P9qAAAXcAAA%2F7YEgAABAAAAAAAAAAAAAAAAAAAABgNSAFUBKwBVA1YAgANWAIADVACAA1QAgAAAAAAAAAAoAAAAXQAAANYAAAFgAAAB%2BQAAApQAAQAAAAYAXgAFAAAAAAACAIAEAAAAAAAEAADeAAAAAAAAABUBAgAAAAAAAAABABIAAAAAAAAAAAACAA4AEgAAAAAAAAADADAAIAAAAAAAAAAEABIAUAAAAAAAAAAFABYAYgAAAAAAAAAGAAkAeAAAAAAAAAAIABwAgQABAAAAAAABABIAAAABAAAAAAACAA4AEgABAAAAAAADADAAIAABAAAAAAAEABIAUAABAAAAAAAFABYAYgABAAAAAAAGAAkAeAABAAAAAAAIABwAgQADAAEECQABABIAAAADAAEECQACAA4AEgADAAEECQADADAAIAADAAEECQAEABIAUAADAAEECQAFABYAYgADAAEECQAGAAkAeAADAAEECQAIABwAgQBNAGEAdABoACAARgBvAG4AdABSAGUAZwB1AGwAYQByAE0AYQB0AGgAcwAgAEYAbwByACAATQBvAHIAZQAgAE0AYQB0AGgAIABGAG8AbgB0AE0AYQB0AGgAIABGAG8AbgB0AFYAZQByAHMAaQBvAG4AIAAxAC4AME1hdGhfRm9udABNAGEAdABoAHMAIABGAG8AcgAgAE0AbwByAGUAAAMAAAAAAAAB9AD6AAAAAAAAAAAAAAAAAAAAAAAAAAC5BxEAAI2FGACyAAAAFRQTsQABPw%3D%3D)format('truetype')%3Bfont-weight%3Anormal%3Bfont-style%3Anormal%3B%7D%40font-face%7Bfont-family%3A'round_brackets18549f92a457f2409'%3Bsrc%3Aurl(data%3Afont%2Ftruetype%3Bcharset%3Dutf-8%3Bbase64%2CAAEAAAAMAIAAAwBAT1MvMjwHLFQAAADMAAAATmNtYXDf7xCrAAABHAAAADxjdnQgBAkDLgAAAVgAAAASZ2x5ZmAOz2cAAAFsAAABJGhlYWQOKih8AAACkAAAADZoaGVhCvgVwgAAAsgAAAAkaG10eCA6AAIAAALsAAAADGxvY2EAAARLAAAC%2BAAAABBtYXhwBIgEWQAAAwgAAAAgbmFtZXHR30MAAAMoAAACOXBvc3QDogHPAAAFZAAAACBwcmVwupWEAAAABYQAAAAHAAAGcgGQAAUAAAgACAAAAAAACAAIAAAAAAAAAQIAAAAAAAAAAAAAAAAAAAAAAAAAAAAAAAAAAAAAACAgICAAAAAo8AMGe%2F57AAAHPgGyAAAAAAACAAEAAQAAABQAAwABAAAAFAAEACgAAAAGAAQAAQACACgAKf%2F%2FAAAAKAAp%2F%2F%2F%2F2f%2FZAAEAAAAAAAAAAAFUAFYBAAAsAKgDgAAyAAcAAAACAAAAKgDVA1UAAwAHAAA1MxEjEyMRM9XVq4CAKgMr%2FQAC1QABAAD%2B0AIgBtAACQBNGAGwChCwA9SwAxCwAtSwChCwBdSwBRCwANSwAxCwBzywAhCwCDwAsAoQsAPUsAMQsAfUsAoQsAXUsAoQsADUsAMQsAI8sAcQsAg8MTAREAEzABEQASMAAZCQ%2FnABkJD%2BcALQ%2FZD%2BcAGQAnACcAGQ%2FnAAAQAA%2FtACIAbQAAkATRgBsAoQsAPUsAMQsALUsAoQsAXUsAUQsADUsAMQsAc8sAIQsAg8ALAKELAD1LADELAH1LAKELAF1LAKELAA1LADELACPLAHELAIPDEwARABIwAREAEzAAIg%2FnCQAZD%2BcJABkALQ%2FZD%2BcAGQAnACcAGQ%2FnAAAQAAAAEAAPW2NYFfDzz1AAMIAP%2F%2F%2F%2F%2FVre7u%2F%2F%2F%2F%2F9Wt7u4AAP7QA7cG0AAAAAoAAgABAAAAAAABAAAHPv5OAAAXcAAA%2F%2F4DtwABAAAAAAAAAAAAAAAAAAAAAwDVAAACIAAAAiAAAAAAAAAAAAAkAAAAowAAASQAAQAAAAMACgACAAAAAAACAIAEAAAAAAAEAABNAAAAAAAAABUBAgAAAAAAAAABAD4AAAAAAAAAAAACAA4APgAAAAAAAAADAFwATAAAAAAAAAAEAD4AqAAAAAAAAAAFABYA5gAAAAAAAAAGAB8A%2FAAAAAAAAAAIABwBGwABAAAAAAABAD4AAAABAAAAAAACAA4APgABAAAAAAADAFwATAABAAAAAAAEAD4AqAABAAAAAAAFABYA5gABAAAAAAAGAB8A%2FAABAAAAAAAIABwBGwADAAEECQABAD4AAAADAAEECQACAA4APgADAAEECQADAFwATAADAAEECQAEAD4AqAADAAEECQAFABYA5gADAAEECQAGAB8A%2FAADAAEECQAIABwBGwBSAG8AdQBuAGQAIABiAHIAYQBjAGsAZQB0AHMAIAB3AGkAdABoACAAYQBzAGMAZQBuAHQAIAAxADgANQA0AFIAZQBnAHUAbABhAHIATQBhAHQAaABzACAARgBvAHIAIABNAG8AcgBlACAAUgBvAHUAbgBkACAAYgByAGEAYwBrAGUAdABzACAAdwBpAHQAaAAgAGEAcwBjAGUAbgB0ACAAMQA4ADUANABSAG8AdQBuAGQAIABiAHIAYQBjAGsAZQB0AHMAIAB3AGkAdABoACAAYQBzAGMAZQBuAHQAIAAxADgANQA0AFYAZQByAHMAaQBvAG4AIAAyAC4AMFJvdW5kX2JyYWNrZXRzX3dpdGhfYXNjZW50XzE4NTQATQBhAHQAaABzACAARgBvAHIAIABNAG8AcgBlAAAAAAMAAAAAAAADnwHPAAAAAAAAAAAAAAAAAAAAAAAAAAC5B%2F8AAY2FAA%3D%3D)format('truetype')%3Bfont-weight%3Anormal%3Bfont-style%3Anormal%3B%7D%3C%2Fstyle%3E%3C%2Fdefs%3E%3Ctext%20font-family%3D%22Times%20New%20Roman%22%20font-size%3D%2218%22%20text-anchor%3D%22middle%22%20x%3D%225.5%22%20y%3D%2218%22%3EP%3C%2Ftext%3E%3Ctext%20font-family%3D%22round_brackets18549f92a457f2409%22%20font-size%3D%2218%22%20text-anchor%3D%22middle%22%20x%3D%2213.5%22%20y%3D%2218%22%3E(%3C%2Ftext%3E%3Ctext%20font-family%3D%22Times%20New%20Roman%22%20font-size%3D%2218%22%20font-style%3D%22italic%22%20text-anchor%3D%22middle%22%20x%3D%2222.5%22%20y%3D%2218%22%3EA%3C%2Ftext%3E%3Ctext%20font-family%3D%22math1f762cde104efe524ba792b6cfd%22%20font-size%3D%2216%22%20text-anchor%3D%22middle%22%20x%3D%2238.5%22%20y%3D%2218%22%3E%26%23x222A%3B%3C%2Ftext%3E%3Ctext%20font-family%3D%22Times%20New%20Roman%22%20font-size%3D%2218%22%20font-style%3D%22italic%22%20text-anchor%3D%22middle%22%20x%3D%2253.5%22%20y%3D%2218%22%3EB%3C%2Ftext%3E%3Ctext%20font-family%3D%22round_brackets18549f92a457f2409%22%20font-size%3D%2218%22%20text-anchor%3D%22middle%22%20x%3D%2262.5%22%20y%3D%2218%22%3E)%3C%2Ftext%3E%3Ctext%20font-family%3D%22math1f762cde104efe524ba792b6cfd%22%20font-size%3D%2216%22%20text-anchor%3D%22middle%22%20x%3D%2274.5%22%20y%3D%2218%22%3E%3D%3C%2Ftext%3E%3Ctext%20font-family%3D%22Times%20New%20Roman%22%20font-size%3D%2218%22%20text-anchor%3D%22middle%22%20x%3D%2288.5%22%20y%3D%2218%22%3EP%3C%2Ftext%3E%3Ctext%20font-family%3D%22round_brackets18549f92a457f2409%22%20font-size%3D%2218%22%20text-anchor%3D%22middle%22%20x%3D%2296.5%22%20y%3D%2218%22%3E(%3C%2Ftext%3E%3Ctext%20font-family%3D%22Times%20New%20Roman%22%20font-size%3D%2218%22%20font-style%3D%22italic%22%20text-anchor%3D%22middle%22%20x%3D%22105.5%22%20y%3D%2218%22%3EA%3C%2Ftext%3E%3Ctext%20font-family%3D%22math1f762cde104efe524ba792b6cfd%22%20font-size%3D%2216%22%20text-anchor%3D%22middle%22%20x%3D%22121.5%22%20y%3D%2218%22%3E%26%23x2229%3B%3C%2Ftext%3E%3Ctext%20font-family%3D%22Times%20New%20Roman%22%20font-size%3D%2218%22%20font-style%3D%22italic%22%20text-anchor%3D%22middle%22%20x%3D%22136.5%22%20y%3D%2218%22%3EB%3C%2Ftext%3E%3Ctext%20font-family%3D%22round_brackets18549f92a457f2409%22%20font-size%3D%2218%22%20text-anchor%3D%22middle%22%20x%3D%22145.5%22%20y%3D%2218%22%3E)%3C%2Ftext%3E%3Ctext%20font-family%3D%22math1f762cde104efe524ba792b6cfd%22%20font-size%3D%2216%22%20text-anchor%3D%22middle%22%20x%3D%22157.5%22%20y%3D%2218%22%3E%2B%3C%2Ftext%3E%3Ctext%20font-family%3D%22Times%20New%20Roman%22%20font-size%3D%2218%22%20text-anchor%3D%22middle%22%20x%3D%22171.5%22%20y%3D%2218%22%3EP%3C%2Ftext%3E%3Ctext%20font-family%3D%22round_brackets18549f92a457f2409%22%20font-size%3D%2218%22%20text-anchor%3D%22middle%22%20x%3D%22179.5%22%20y%3D%2218%22%3E(%3C%2Ftext%3E%3Ctext%20font-family%3D%22Times%20New%20Roman%22%20font-size%3D%2218%22%20font-style%3D%22italic%22%20text-anchor%3D%22middle%22%20x%3D%22188.5%22%20y%3D%2218%22%3EA%3C%2Ftext%3E%3Ctext%20font-family%3D%22math1f762cde104efe524ba792b6cfd%22%20font-size%3D%2216%22%20text-anchor%3D%22middle%22%20x%3D%22204.5%22%20y%3D%2218%22%3E%26%23x2229%3B%3C%2Ftext%3E%3Ctext%20font-family%3D%22Times%20New%20Roman%22%20font-size%3D%2218%22%20font-style%3D%22italic%22%20text-anchor%3D%22middle%22%20x%3D%22219.5%22%20y%3D%2218%22%3EB%3C%2Ftext%3E%3Ctext%20font-family%3D%22math1f762cde104efe524ba792b6cfd%22%20font-size%3D%2218%22%20text-anchor%3D%22middle%22%20x%3D%22228.5%22%20y%3D%2218%22%3E'%3C%2Ftext%3E%3Ctext%20font-family%3D%22round_brackets18549f92a457f2409%22%20font-size%3D%2218%22%20text-anchor%3D%22middle%22%20x%3D%22233.5%22%20y%3D%2218%22%3E)%3C%2Ftext%3E%3Ctext%20font-family%3D%22math1f762cde104efe524ba792b6cfd%22%20font-size%3D%2216%22%20text-anchor%3D%22middle%22%20x%3D%22245.5%22%20y%3D%2218%22%3E%2B%3C%2Ftext%3E%3Ctext%20font-family%3D%22Times%20New%20Roman%22%20font-size%3D%2218%22%20text-anchor%3D%22middle%22%20x%3D%22259.5%22%20y%3D%2218%22%3EP%3C%2Ftext%3E%3Ctext%20font-family%3D%22round_brackets18549f92a457f2409%22%20font-size%3D%2218%22%20text-anchor%3D%22middle%22%20x%3D%22267.5%22%20y%3D%2218%22%3E(%3C%2Ftext%3E%3Ctext%20font-family%3D%22Times%20New%20Roman%22%20font-size%3D%2218%22%20font-style%3D%22italic%22%20text-anchor%3D%22middle%22%20x%3D%22276.5%22%20y%3D%2218%22%3EA%3C%2Ftext%3E%3Ctext%20font-family%3D%22math1f762cde104efe524ba792b6cfd%22%20font-size%3D%2218%22%20text-anchor%3D%22middle%22%20x%3D%22286.5%22%20y%3D%2218%22%3E'%3C%2Ftext%3E%3Ctext%20font-family%3D%22math1f762cde104efe524ba792b6cfd%22%20font-size%3D%2216%22%20text-anchor%3D%22middle%22%20x%3D%22297.5%22%20y%3D%2218%22%3E%26%23x2229%3B%3C%2Ftext%3E%3Ctext%20font-family%3D%22Times%20New%20Roman%22%20font-size%3D%2218%22%20font-style%3D%22italic%22%20text-anchor%3D%22middle%22%20x%3D%22312.5%22%20y%3D%2218%22%3EB%3C%2Ftext%3E%3Ctext%20font-family%3D%22round_brackets18549f92a457f2409%22%20font-size%3D%2218%22%20text-anchor%3D%22middle%22%20x%3D%22321.5%22%20y%3D%2218%22%3E)%3C%2Ftext%3E%3C%2Fsvg%3E)
subtract the probabilities of the combined outcomes that are not part of that event from 1
For example:
%3C%2Fmo%3E%3Cmo%3E%3D%3C%2Fmo%3E%3Cmn%3E1%3C%2Fmn%3E%3Cmo%3E-%3C%2Fmo%3E%3Cmi%20mathvariant%3D%22normal%22%3EP%3C%2Fmi%3E%3Cmo%3E(%3C%2Fmo%3E%3Cmi%3EA%3C%2Fmi%3E%3Cmo%3E'%3C%2Fmo%3E%3Cmo%3E%26%23x2229%3B%3C%2Fmo%3E%3Cmi%3EB%3C%2Fmi%3E%3Cmo%3E'%3C%2Fmo%3E%3Cmo%3E)%3C%2Fmo%3E%3C%2Fmath%3E--%3E%3Cdefs%3E%3Cstyle%20type%3D%22text%2Fcss%22%3E%40font-face%7Bfont-family%3A'math1c88336ed8e1b559a4dd1ba43c4'%3Bsrc%3Aurl(data%3Afont%2Ftruetype%3Bcharset%3Dutf-8%3Bbase64%2CAAEAAAAMAIAAAwBAT1MvMi7iBBMAAADMAAAATmNtYXDEvmKUAAABHAAAAFRjdnQgDVUNBwAAAXAAAAA6Z2x5ZoPi2VsAAAGsAAACZWhlYWQQC2qxAAAEFAAAADZoaGVhCGsXSAAABEwAAAAkaG10eE2rRkcAAARwAAAAGGxvY2EAHTwYAAAEiAAAABxtYXhwBT0FPgAABKQAAAAgbmFtZaBxlY4AAATEAAABn3Bvc3QB9wD6AAAGZAAAACBwcmVwa1uragAABoQAAAAUAAADSwGQAAUAAAQABAAAAAAABAAEAAAAAAAAAQEAAAAAAAAAAAAAAAAAAAAAAAAAAAAAAAAAAAAAACAgICAAAAAg1UADev96AAAD6ACWAAAAAAACAAEAAQAAABQAAwABAAAAFAAEAEAAAAAMAAgAAgAEACcAPSISIikiKv%2F%2FAAAAJwA9IhIiKSIq%2F%2F%2F%2F2v%2FF3fHd293bAAEAAAAAAAAAAAAAAAAAAAFUAywAgAEAAFYAKgJYAh4BDgEsAiwAWgGAAoAAoADUAIAAAAAAAAAAKwBVAIAAqwDVAQABKwAHAAAAAgBVAAADAAOrAAMABwAAMxEhESUhESFVAqv9qwIA%2FgADq%2FxVVQMAAAEAVQHVANUDKwADABsYAbAEELEABfSxAQP0sQUF9ACwBBCxAAL0MDETMwMjVYBWKgMr%2FqoAAgCAAOsC1QIVAAMABwBlGAGwCBCwBtSwBhCwBdSwCBCwAdSwARCwANSwBhCwBzywBRCwBDywARCwAjywABCwAzwAsAgQsAbUsAYQsAfUsAcQsAHUsAEQsALUsAYQsAU8sAcQsAQ8sAEQsAA8sAIQsAM8MTATITUhHQEhNYACVf2rAlUBwFXVVVUAAQCAAVUC1QGrAAMAMBgBsAQQsQAD9rADPLECB%2FWwATyxBQPmALEAABMQsQAG5bEAARMQsAE8sQMF9bACPBMhFSGAAlX9qwGrVgABAIAAAALVAysAEABhGAGwERCxAAP2sA88sQEF%2FbADPLEEBfywDjywABCwCdSwCzyxEgPmsQgF%2FbAGPLEFBfywDDwAsQ0CP7EPA%2F2wCzywEN2wCjywDRCxBAX9sAU8sQMD%2FbAGPLEBAD%2BwCDwxMDsBETQ2IBYVETMRNCYjIgYVgFVWAQBVVaqAgKsCAFWAgFX%2BAAIAq4CAqwABAIAAAALVAysAEABhGAGwERCxAAP2sA88sQEF%2FbADPLEEBfywDjywABCwCdSwCzyxEgPmsQgF%2FbAGPLEFBfywDDwAsQ0CP7EPA%2F2wCzywEN2wCjywDRCxBAX9sAU8sQMD%2FbAGPLEBAD%2BwCDwxMBMzERQWIDY1ETMRFAYjIiY1gFVWAQBVVaqAgKsDK%2F4AVoCAVgIA%2FgCrgICrAAAAAAEAAAABAADVeM5BXw889QADBAD%2F%2F%2F%2F%2F1joTc%2F%2F%2F%2F%2F%2FWOhNzAAD%2FIASAA6sAAAAKAAIAAQAAAAAAAQAAA%2Bj%2FagAAF3AAAP%2B2BIAAAQAAAAAAAAAAAAAAAAAAAAYDUgBVASsAVQNWAIADVgCAA1QAgANUAIAAAAAAAAAAKAAAAF0AAADnAAABMQAAAcoAAAJlAAEAAAAGAF4ABQAAAAAAAgCABAAAAAAABAAA3gAAAAAAAAAVAQIAAAAAAAAAAQASAAAAAAAAAAAAAgAOABIAAAAAAAAAAwAwACAAAAAAAAAABAASAFAAAAAAAAAABQAWAGIAAAAAAAAABgAJAHgAAAAAAAAACAAcAIEAAQAAAAAAAQASAAAAAQAAAAAAAgAOABIAAQAAAAAAAwAwACAAAQAAAAAABAASAFAAAQAAAAAABQAWAGIAAQAAAAAABgAJAHgAAQAAAAAACAAcAIEAAwABBAkAAQASAAAAAwABBAkAAgAOABIAAwABBAkAAwAwACAAAwABBAkABAASAFAAAwABBAkABQAWAGIAAwABBAkABgAJAHgAAwABBAkACAAcAIEATQBhAHQAaAAgAEYAbwBuAHQAUgBlAGcAdQBsAGEAcgBNAGEAdABoAHMAIABGAG8AcgAgAE0AbwByAGUAIABNAGEAdABoACAARgBvAG4AdABNAGEAdABoACAARgBvAG4AdABWAGUAcgBzAGkAbwBuACAAMQAuADBNYXRoX0ZvbnQATQBhAHQAaABzACAARgBvAHIAIABNAG8AcgBlAAADAAAAAAAAAfQA%2BgAAAAAAAAAAAAAAAAAAAAAAAAAAuQcRAACNhRgAsgAAABUUE7EAAT8%3D)format('truetype')%3Bfont-weight%3Anormal%3Bfont-style%3Anormal%3B%7D%40font-face%7Bfont-family%3A'round_brackets18549f92a457f2409'%3Bsrc%3Aurl(data%3Afont%2Ftruetype%3Bcharset%3Dutf-8%3Bbase64%2CAAEAAAAMAIAAAwBAT1MvMjwHLFQAAADMAAAATmNtYXDf7xCrAAABHAAAADxjdnQgBAkDLgAAAVgAAAASZ2x5ZmAOz2cAAAFsAAABJGhlYWQOKih8AAACkAAAADZoaGVhCvgVwgAAAsgAAAAkaG10eCA6AAIAAALsAAAADGxvY2EAAARLAAAC%2BAAAABBtYXhwBIgEWQAAAwgAAAAgbmFtZXHR30MAAAMoAAACOXBvc3QDogHPAAAFZAAAACBwcmVwupWEAAAABYQAAAAHAAAGcgGQAAUAAAgACAAAAAAACAAIAAAAAAAAAQIAAAAAAAAAAAAAAAAAAAAAAAAAAAAAAAAAAAAAACAgICAAAAAo8AMGe%2F57AAAHPgGyAAAAAAACAAEAAQAAABQAAwABAAAAFAAEACgAAAAGAAQAAQACACgAKf%2F%2FAAAAKAAp%2F%2F%2F%2F2f%2FZAAEAAAAAAAAAAAFUAFYBAAAsAKgDgAAyAAcAAAACAAAAKgDVA1UAAwAHAAA1MxEjEyMRM9XVq4CAKgMr%2FQAC1QABAAD%2B0AIgBtAACQBNGAGwChCwA9SwAxCwAtSwChCwBdSwBRCwANSwAxCwBzywAhCwCDwAsAoQsAPUsAMQsAfUsAoQsAXUsAoQsADUsAMQsAI8sAcQsAg8MTAREAEzABEQASMAAZCQ%2FnABkJD%2BcALQ%2FZD%2BcAGQAnACcAGQ%2FnAAAQAA%2FtACIAbQAAkATRgBsAoQsAPUsAMQsALUsAoQsAXUsAUQsADUsAMQsAc8sAIQsAg8ALAKELAD1LADELAH1LAKELAF1LAKELAA1LADELACPLAHELAIPDEwARABIwAREAEzAAIg%2FnCQAZD%2BcJABkALQ%2FZD%2BcAGQAnACcAGQ%2FnAAAQAAAAEAAPW2NYFfDzz1AAMIAP%2F%2F%2F%2F%2FVre7u%2F%2F%2F%2F%2F9Wt7u4AAP7QA7cG0AAAAAoAAgABAAAAAAABAAAHPv5OAAAXcAAA%2F%2F4DtwABAAAAAAAAAAAAAAAAAAAAAwDVAAACIAAAAiAAAAAAAAAAAAAkAAAAowAAASQAAQAAAAMACgACAAAAAAACAIAEAAAAAAAEAABNAAAAAAAAABUBAgAAAAAAAAABAD4AAAAAAAAAAAACAA4APgAAAAAAAAADAFwATAAAAAAAAAAEAD4AqAAAAAAAAAAFABYA5gAAAAAAAAAGAB8A%2FAAAAAAAAAAIABwBGwABAAAAAAABAD4AAAABAAAAAAACAA4APgABAAAAAAADAFwATAABAAAAAAAEAD4AqAABAAAAAAAFABYA5gABAAAAAAAGAB8A%2FAABAAAAAAAIABwBGwADAAEECQABAD4AAAADAAEECQACAA4APgADAAEECQADAFwATAADAAEECQAEAD4AqAADAAEECQAFABYA5gADAAEECQAGAB8A%2FAADAAEECQAIABwBGwBSAG8AdQBuAGQAIABiAHIAYQBjAGsAZQB0AHMAIAB3AGkAdABoACAAYQBzAGMAZQBuAHQAIAAxADgANQA0AFIAZQBnAHUAbABhAHIATQBhAHQAaABzACAARgBvAHIAIABNAG8AcgBlACAAUgBvAHUAbgBkACAAYgByAGEAYwBrAGUAdABzACAAdwBpAHQAaAAgAGEAcwBjAGUAbgB0ACAAMQA4ADUANABSAG8AdQBuAGQAIABiAHIAYQBjAGsAZQB0AHMAIAB3AGkAdABoACAAYQBzAGMAZQBuAHQAIAAxADgANQA0AFYAZQByAHMAaQBvAG4AIAAyAC4AMFJvdW5kX2JyYWNrZXRzX3dpdGhfYXNjZW50XzE4NTQATQBhAHQAaABzACAARgBvAHIAIABNAG8AcgBlAAAAAAMAAAAAAAADnwHPAAAAAAAAAAAAAAAAAAAAAAAAAAC5B%2F8AAY2FAA%3D%3D)format('truetype')%3Bfont-weight%3Anormal%3Bfont-style%3Anormal%3B%7D%3C%2Fstyle%3E%3C%2Fdefs%3E%3Ctext%20font-family%3D%22Times%20New%20Roman%22%20font-size%3D%2218%22%20text-anchor%3D%22middle%22%20x%3D%225.5%22%20y%3D%2218%22%3EP%3C%2Ftext%3E%3Ctext%20font-family%3D%22round_brackets18549f92a457f2409%22%20font-size%3D%2218%22%20text-anchor%3D%22middle%22%20x%3D%2213.5%22%20y%3D%2218%22%3E(%3C%2Ftext%3E%3Ctext%20font-family%3D%22Times%20New%20Roman%22%20font-size%3D%2218%22%20font-style%3D%22italic%22%20text-anchor%3D%22middle%22%20x%3D%2222.5%22%20y%3D%2218%22%3EA%3C%2Ftext%3E%3Ctext%20font-family%3D%22math1c88336ed8e1b559a4dd1ba43c4%22%20font-size%3D%2216%22%20text-anchor%3D%22middle%22%20x%3D%2238.5%22%20y%3D%2218%22%3E%26%23x222A%3B%3C%2Ftext%3E%3Ctext%20font-family%3D%22Times%20New%20Roman%22%20font-size%3D%2218%22%20font-style%3D%22italic%22%20text-anchor%3D%22middle%22%20x%3D%2253.5%22%20y%3D%2218%22%3EB%3C%2Ftext%3E%3Ctext%20font-family%3D%22round_brackets18549f92a457f2409%22%20font-size%3D%2218%22%20text-anchor%3D%22middle%22%20x%3D%2262.5%22%20y%3D%2218%22%3E)%3C%2Ftext%3E%3Ctext%20font-family%3D%22math1c88336ed8e1b559a4dd1ba43c4%22%20font-size%3D%2216%22%20text-anchor%3D%22middle%22%20x%3D%2274.5%22%20y%3D%2218%22%3E%3D%3C%2Ftext%3E%3Ctext%20font-family%3D%22Times%20New%20Roman%22%20font-size%3D%2218%22%20text-anchor%3D%22middle%22%20x%3D%2287.5%22%20y%3D%2218%22%3E1%3C%2Ftext%3E%3Ctext%20font-family%3D%22math1c88336ed8e1b559a4dd1ba43c4%22%20font-size%3D%2216%22%20text-anchor%3D%22middle%22%20x%3D%22100.5%22%20y%3D%2218%22%3E%26%23x2212%3B%3C%2Ftext%3E%3Ctext%20font-family%3D%22Times%20New%20Roman%22%20font-size%3D%2218%22%20text-anchor%3D%22middle%22%20x%3D%22114.5%22%20y%3D%2218%22%3EP%3C%2Ftext%3E%3Ctext%20font-family%3D%22round_brackets18549f92a457f2409%22%20font-size%3D%2218%22%20text-anchor%3D%22middle%22%20x%3D%22122.5%22%20y%3D%2218%22%3E(%3C%2Ftext%3E%3Ctext%20font-family%3D%22Times%20New%20Roman%22%20font-size%3D%2218%22%20font-style%3D%22italic%22%20text-anchor%3D%22middle%22%20x%3D%22131.5%22%20y%3D%2218%22%3EA%3C%2Ftext%3E%3Ctext%20font-family%3D%22math1c88336ed8e1b559a4dd1ba43c4%22%20font-size%3D%2218%22%20text-anchor%3D%22middle%22%20x%3D%22141.5%22%20y%3D%2218%22%3E'%3C%2Ftext%3E%3Ctext%20font-family%3D%22math1c88336ed8e1b559a4dd1ba43c4%22%20font-size%3D%2216%22%20text-anchor%3D%22middle%22%20x%3D%22152.5%22%20y%3D%2218%22%3E%26%23x2229%3B%3C%2Ftext%3E%3Ctext%20font-family%3D%22Times%20New%20Roman%22%20font-size%3D%2218%22%20font-style%3D%22italic%22%20text-anchor%3D%22middle%22%20x%3D%22167.5%22%20y%3D%2218%22%3EB%3C%2Ftext%3E%3Ctext%20font-family%3D%22math1c88336ed8e1b559a4dd1ba43c4%22%20font-size%3D%2218%22%20text-anchor%3D%22middle%22%20x%3D%22176.5%22%20y%3D%2218%22%3E'%3C%2Ftext%3E%3Ctext%20font-family%3D%22round_brackets18549f92a457f2409%22%20font-size%3D%2218%22%20text-anchor%3D%22middle%22%20x%3D%22181.5%22%20y%3D%2218%22%3E)%3C%2Ftext%3E%3C%2Fsvg%3E)
Do I have to use a tree diagram?
If there are multiple events or trials then a tree diagram can get big
You can break down the problem by using the words AND/OR/NOT to help you find probabilities without a tree
You can speed up the process by only drawing parts of the tree that you are interested in
Which events do I put on the first branch?
If the events A and B are independent then the order does not matter
If the events A and B are not independent then the order does matter
If you have the probability of A given B then put B on the first set of branches
If you have the probability of B given A then put A on the first set of branches
Examiner Tips and Tricks
In an exam do not waste time drawing a full tree diagram for scenarios with lots of events unless the question asks you to. Only draw the parts that you are interested in.
For example, consider tokens drawn from a bag with red, purple, green, blue and yellow tokens in it. If you are only interested in the probabilities of drawing red tokens, then only draw branches for 'red' and 'not red', instead of branches for every single colour.
Worked Example
20% of people in a company wear glasses. 40% of people in the company who wear glasses are right-handed. 50% of people in the company who don’t wear glasses are right-handed.
a) Draw a tree diagram to represent the information.
Answer:

b) One of the people in the company is randomly selected. Find the probability that the person is right-handed.
Answer:

c) Given that a person who is right-handed is selected at random, find the probability that the person wears glasses.
Answer:


Unlock more, it's free!
Join the 100,000+ Students that ❤️ Save My Exams
the (exam) results speak for themselves:

Was this revision note helpful?
