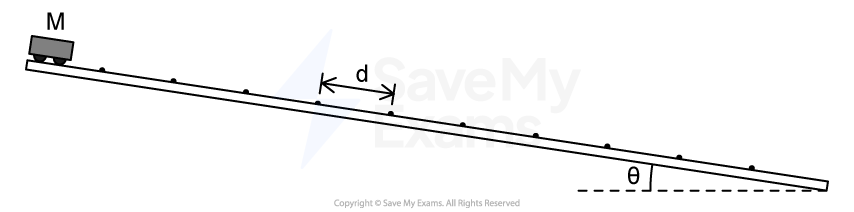
Figure 1
A long track, inclined at an angle ![]() to the horizontal, has small speed bumps on it. The bumps are evenly spaced a distance
to the horizontal, has small speed bumps on it. The bumps are evenly spaced a distance ![]() apart, as shown in Figure 1. The track is actually much longer than shown, with over 100 bumps. A cart of mass
apart, as shown in Figure 1. The track is actually much longer than shown, with over 100 bumps. A cart of mass ![]() is released from rest at the top of the track. A student notices that after reaching the 40th bump the cart's average speed between successive bumps no longer increases, reaching a maximum value
is released from rest at the top of the track. A student notices that after reaching the 40th bump the cart's average speed between successive bumps no longer increases, reaching a maximum value ![]() . This means the time interval taken to move from one bump to the next bump becomes constant.
. This means the time interval taken to move from one bump to the next bump becomes constant.
Consider the cart's motion between bump 41 and bump 44.
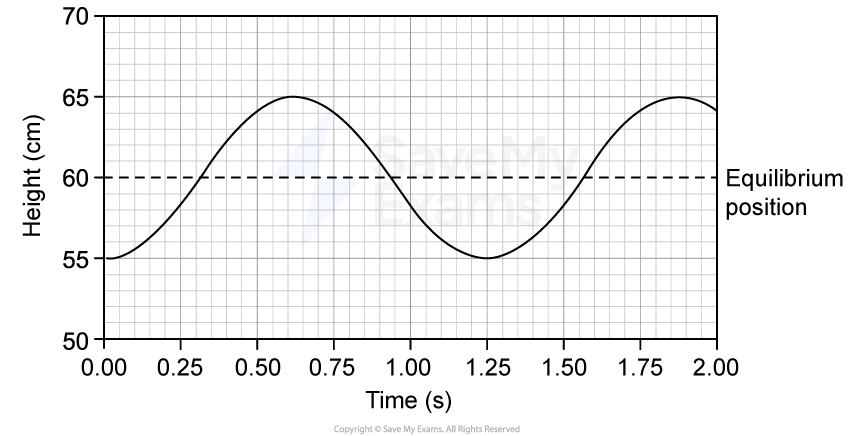
i) On Figure 2, sketch a graph of the cart's velocity ![]() as a function of time from the moment it reaches bump 41 until it reaches bump 44.
as a function of time from the moment it reaches bump 41 until it reaches bump 44.
ii) Over the same time interval draw a dashed horizontal line at ![]() . Label this line
. Label this line ![]() .
.

Figure 2
Derive an expression for the time interval ![]() taken for the cart to travel between two successive bumps. Write your expression in terms of
taken for the cart to travel between two successive bumps. Write your expression in terms of ![]() ,
, ![]() ,
, ![]() and physical constants as appropriate. Begin your derivation by writing a fundamental physics principle or an equation from the reference booklet.
and physical constants as appropriate. Begin your derivation by writing a fundamental physics principle or an equation from the reference booklet.
In experiment 2, the student increases the angle of incline of the ramp, but everything else stays the same.
Indicate whether the maximum speed of the cart in experiment 2 is greater than, less than, or equal to that in experiment 1.
⎽⎽⎽⎽⎽⎽⎽⎽⎽⎽ ![]() ⎽⎽⎽⎽⎽⎽⎽⎽⎽⎽
⎽⎽⎽⎽⎽⎽⎽⎽⎽⎽ ![]() ⎽⎽⎽⎽⎽⎽⎽⎽⎽⎽
⎽⎽⎽⎽⎽⎽⎽⎽⎽⎽ ![]()
Use ideas about energy to justify your answer.
Was this exam question helpful?