A student investigates the forces acting on the pendulum bob as it moves in a vertical circle. The student uses a pendulum bob of mass and a string of unknown length . A force sensor is used to measure the tension in the string, and a motion sensor is used to measure the speed of the bob as it passes through the lowest point of the swing. The recorded data is shown in Table 1.
Table 1
Velocity, (m/s) | Tension, (N) |
|---|
1.0 | 2.4 |
1.5 | 3.9 |
2.0 | 5.4 |
2.5 | 7.9 |
3.0 | 10.4 |
The student correctly determines that the relationship between and at the lowest point is given by:
The student wants to determine an experimental value for the length of the string.
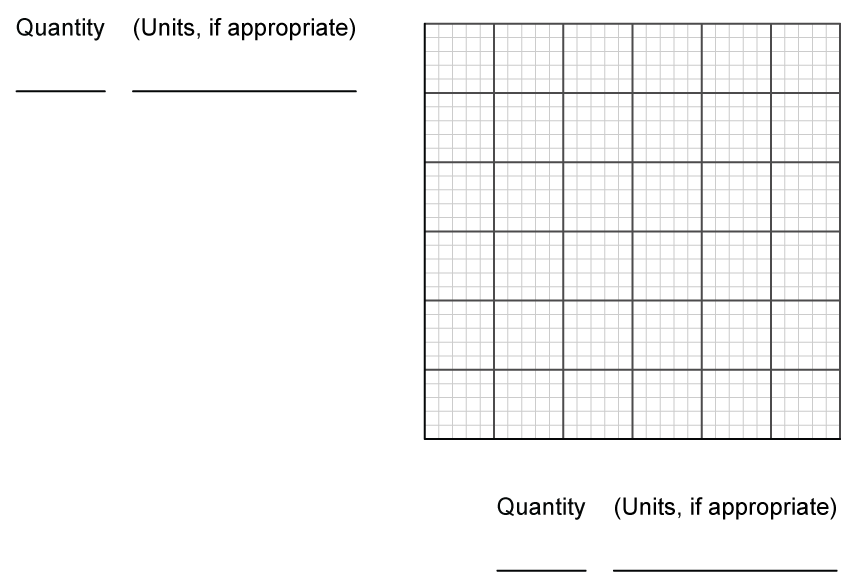
i) Label the axes of Figure 1 with measured or calculated quantities. Include units, as appropriate. The graphed quantities should yield a linear graph that can be used to determine .
ii) On the grid provided in Figure 1, create a graph of the quantities indicated in part a)i).
Clearly label the horizontal and vertical axes with numerical scales.
Plot the corresponding data points on the grid
Any columns added to Table 1 for scratch work will not be scored.
Figure 1
iii) Draw a best fit line for the data plotted in part a)ii).