Translational Kinetic Energy & Potential Energy (College Board AP® Physics 1: Algebra-Based): Exam Questions

1 hour25 questions
1a
Sme Calculator
1 mark

Define the term translational motion.

1b
Sme Calculator
1 mark

Define the term translational kinetic energy.

1c
Sme Calculator
1 mark

Describe qualitatively the relationship between translational kinetic energy and the mass of the moving object.

1d
Sme Calculator
1 mark

Describe qualitatively the relationship between translational kinetic energy and the velocity of the moving object.

2a
Sme Calculator
1 mark

Name one example of a type of potential energy.

2b
Sme Calculator
2 marks

Describe the two conditions which must be met for a system to have potential energy.

2c
Sme Calculator
3 marks

A student makes the following claim:

"The potential energy of a system is path independent."

Indicate whether the student is correct or incorrect.

⎽⎽⎽⎽⎽⎽⎽⎽⎽⎽ correct‎ ‎ ‎‎ ‎ ‎ ‎ ‎ ‎ ‎ ⎽⎽⎽⎽⎽⎽⎽⎽⎽⎽ incorrect

Justify your reasoning.

3a
Sme Calculator
1 mark

Define elastic potential energy.

3b
Sme Calculator
2 marks

A spring is one example of an object that can store elastic potential energy.

Describe the properties of an ideal spring.

3c
Sme Calculator
1 mark

Describe qualitatively the relationship between elastic potential energy and the spring constant of the material.

3d
Sme Calculator
1 mark

Describe qualitatively the relationship between elastic potential energy and the extension or compression distance of the material.

4a
Sme Calculator
2 marks

On the diagram in Figure 1, draw lines to represent the gravitational field lines around the Earth.

Simple black outline of a circle centred on a white background, representing the Earth.

Figure 1

4b
2 marks

On the diagram in Figure 2, draw lines to represent the gravitational field lines at the surface of the Earth.

A thin, black horizontal line representing the surface of the Earth.

Figure 2

4c
Sme Calculator
2 marks

A student makes the following claim:

"The gravitational field around the Earth is nearly constant at all points."

Indicate whether the student is correct or incorrect.

⎽⎽⎽⎽⎽⎽⎽⎽⎽⎽ correct‎ ‎ ‎‎ ‎ ‎ ‎ ‎ ‎ ‎ ⎽⎽⎽⎽⎽⎽⎽⎽⎽⎽ incorrect

Justify your reasoning using your sketches from parts a) and b).

4d
Sme Calculator
2 marks

Describe qualitatively the relationship between the change in gravitational potential energy at the Earth's surface and the height through which an object moves.

5a
Sme Calculator
1 mark

State the equation used for gravitational field strength when the moving object is so far from the Earth's surface that the field strength can no longer be approximated to be constant.

5b
Sme Calculator
4 marks

A student makes the following claim:

"Absolute gravitational potential energy always has a positive value."

Indicate whether the student is correct or incorrect.

⎽⎽⎽⎽⎽⎽⎽⎽⎽⎽ correct‎ ‎ ‎‎ ‎ ‎ ‎ ‎ ‎ ‎ ⎽⎽⎽⎽⎽⎽⎽⎽⎽⎽ incorrect

Justify your reasoning.

5c
Sme Calculator
1 mark

A system contains a star and three planets.

Write an expression for the absolute gravitational potential energy of the system.

1
Sme Calculator
3 marks
A long inclined ramp with evenly-spaced small speed bumps along its surface. A cart of mass M is shown at the top of the track. The angle of inclination is labelled theta and the distance between successive bumps is labelled d.

Figure 1

A long track, inclined at an angle \theta to the horizontal, has small speed bumps on it. The bumps are evenly spaced a distance d apart, as shown in Figure 1. The track is actually much longer than shown, with over 100 bumps. A cart of mass M is released from rest at the top of the track. A student notices that after reaching the 40th bump the cart's average speed between successive bumps no longer increases, reaching a maximum value v_{a v g}. This means the time interval taken to move from one bump to the next bump becomes constant.

In experiment 2, the student increases the angle of incline of the ramp, but everything else stays the same.

Indicate whether the maximum speed of the cart in experiment 2 is greater than, less than, or equal to that in experiment 1 by writing one of the following:

  • v_{m a x 2} > v_{m a x 1}

  • v_{m a x 2} = v_{m a x 1}

  • v_{m a x 2} < v_{m a x 1}

Use ideas about energy to justify your answer. In your justification, include qualitative reasoning beyond mathematical derivations or expressions.

2a
Sme Calculator
3 marks
Diagram shows two blocks at height d on curved ramps on tables h; labelled Team 1 and Team 2. The trajectory of blocks differs between teams.

Figure 1

A physics class is asked to design a low-friction slide that will launch a block horizontally from the top of a lab table. Teams 1 and 2 assemble the slides as shown in Figure 1 and use identical blocks 1 and 2, respectively. Both slides start at the same height d above the tabletop. However, Team 2's table is lower than Team 1's table. To compensate for the lower table, Team 2 constructs the right end of the slide to rise above the table top so that the block leaves the slide horizontally at the same height h above the floor as does Team 1's block.

Both blocks are released from rest at the top of their respective slides. Block 1 lands a horizontal distance x subscript 1, and Block 2 lands a horizontal distance x subscript 2 from their respective tables.

Indicate whether x subscript 1 is greater than, less than, or equal to x subscript 2.

⎽⎽⎽⎽⎽⎽⎽⎽⎽⎽ x subscript 1 space greater than space x subscript 2‎ ‎ ‎ ‎ ‎ ‎ ‎ ‎ ‎ ‎ ⎽⎽⎽⎽⎽⎽⎽⎽⎽⎽ x subscript 1 space equals space x subscript 2 ‎ ‎ ‎‎ ‎ ‎ ‎ ‎ ‎ ‎ ⎽⎽⎽⎽⎽⎽⎽⎽⎽⎽ x subscript 1 space less than space x subscript 2

Justify your answer using qualitative reasoning beyond referencing equations.

2b
Sme Calculator
3 marks

Derive an expression for the time taken by Block 1 to hit the floor after leaving the slide in terms of d, h, x subscript 1 and physical constants as appropriate. Begin your derivation by writing a fundamental physics principle or an equation from the reference book.

2c
Sme Calculator
2 marks

In another experiment, teams 1 and 2 use tables and low friction slides with the same height. However, the two slides have different shapes, as shown in Figure 2.

Diagram showing two tables with curved surfaces labeled Block 1 and Block 2. Height measurements d and h are indicated. The tables are marked for Team 1 and Team 2.

Figure 2

Both blocks 1 and 2 are released from rest at the top of their respective slides at the same time.

Does Block 1 hit the floor in more time, less time, or the same time as Block 2? Use the equation derived in part b) to justify your answer.

3
Sme Calculator
2 marks
Mass M1 on a table connected to a spring, and mass M2 hanging off the edge of the table connected to a pulley.

Figure 1

Two blocks are connected by a string that passes over a pulley, as shown in Figure 1. Block 1 is on a horizontal surface and is attached to a spring that is at its unstretched length. Frictional forces are negligible in the pulley's axle and between the block and surface. Block 2 is released from rest and moves downward before momentarily coming to rest.

The spring constant of the spring is k subscript 0, the mass of block 1 is M subscript 1 and the mass of block 2 is M subscript 2. Block 2 starts from rest and speeds up, then it slows down and momentarily comes to rest at a position below its initial position. increment y is the distance moved by block 2 before momentarily coming to rest.

The system includes the spring, Earth, both blocks, and the string, but not the surface. The initial state is taken to be when the blocks are at rest just before they start moving, and the final state is taken to be when the blocks first come momentarily to rest.

Diagram A shows the initial and final states for the system when the surface has negligible friction. Diagram B shows the initial and final states for the system when the surface has nonnegligible friction.

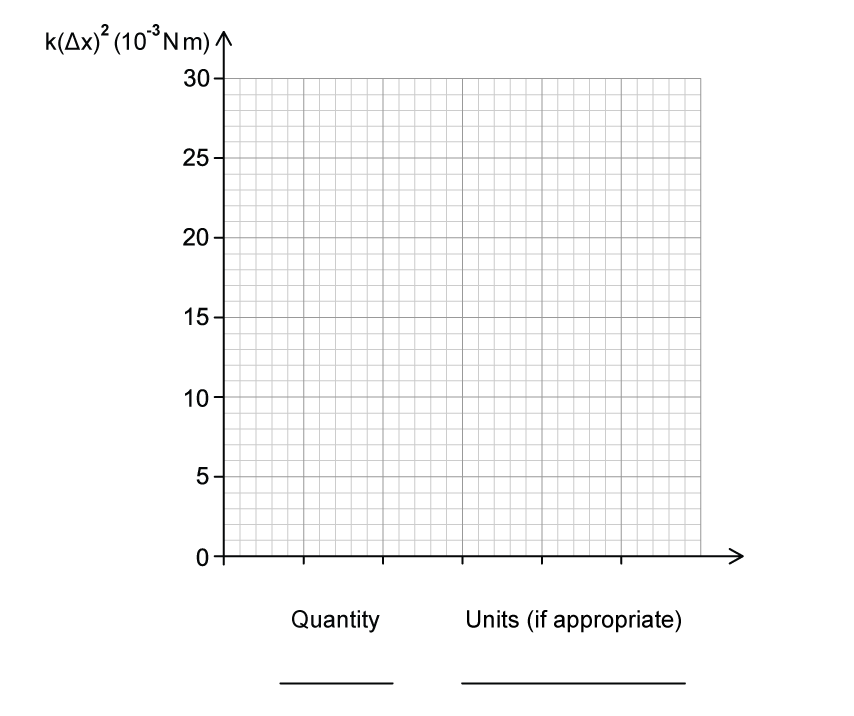
The shaded bars in the energy bar charts represent the potential energy of the spring and the gravitational potential energy of the blocks-Earth system, U subscript s and U subscript g respectively, in the initial and final states. Draw shaded rectangles to complete the energy bar chart for the final state when the surface has nonnegligible friction.

  • Positive energy values are above the zero-energy line (“0”), and

    negative energy values are below the zero-energy line.

  • Shaded regions should start at the dashed line representing zero energy.

  • Represent any energy that is equal to zero with a distinct line on the

    zero-energy line.

  • The relative height of each shaded region should reflect the magnitude

    of the respective energy consistent with the scale shown.

Two bar graphs compare potential energy with negligible and non-negligible friction. For negligible friction in the initial state, elastic potential is zero, gravitational potential is 4. For negligible friction in the final state, elastic potential is 4, gravitational potential is zero. For nonnegligible friction in the initial state, elastic potential is zero, gravitational potential is 4. For nonnegligible friction in the final state, the bar chart is empty.

Figure 2

4a
Sme Calculator
2 marks
A wheel mounted on an axle at its center with a block hanging from a string wound around the wheel. The block hangs from a height above the floor below.

Figure 1

A group of students have a wheel mounted on a horizontal axle and a small block of known mass attached to one end of a light string. The other end of the string is attached to the wheel's rim and wrapped around it several times, as shown in Figure 1. When the block is released from rest and begins to fall, the wheel begins to rotate with negligible friction.

The students hypothesize that the decrease in the gravitational potential energy of the block-Earth system is equal to the increase in the block's translational kinetic energy from when the block starts moving to immediately before it reaches the floor, and want to collect data to test this hypothesis.

i) Indicate quantities that could be measured by the students that would allow them to determine the decrease in gravitational potential energy of the block-Earth system and the increase in the translational kinetic energy of the block as it falls.

ii) Briefly describe a method to reduce experimental uncertainty for the measured quantities.

4b
Sme Calculator
2 marks

i) Indicate what quantities the students could graph on the horizontal and vertical axes to create a linear graph that can be used to determine whether the decrease in gravitational potential energy is equal to the increase in translational kinetic energy.

ii) Briefly describe how the graph will be analyzed to determine whether the decrease in gravitational potential energy is equal to the increase in translational kinetic energy.

1a
Sme Calculator
2 marks
A spring projectile launcher consisting of a coiled spring attached to a flat plate. Three pin positions A, B, and C are marked along the barrel where the plate can be held in place when the spring is compressed.

Figure 1

A group of students are given a projectile launcher which consists of a spring with an attached plate, as shown in Figure 1. When the spring is compressed, the plate can be held in place by a pin at any of three positions A, B, or C.

The same spring launcher with a steel sphere placed against the plate, which is held by the pin at position C with the spring fully compressed.

Figure 2

Figure 2 shows a steel sphere of known mass placed against the plate, which is held in place by a pin at position C. The sphere is launched upon release of the pin.

The students have access to the projectile launcher and equipment usually found in a school laboratory. The students are asked to take measurements to create a graph that could be used to determine the spring constant of the spring.

i) Indicate the measurements the students could make that would allow them to determine the spring constant of the spring.

ii) Briefly describe a method to reduce experimental uncertainty for the measured quantities.

1b
Sme Calculator
2 marks

i) Indicate what quantities the students could graph on the horizontal and vertical axes to create a linear graph that could be used to determine the spring constant k of the spring.

ii) Briefly describe the relationship between the spring constant k and a feature of the graph from part b)i).

1c
Sme Calculator
4 marks

The students perform another experiment using the projectile launcher, where they measure the range of spheres of different masses and their time of flight. The spring constant of the spring is k equals 6 space straight N divided by straight m. Table 1 shows the horizontal range R of each sphere and its time of flight t.

Table 1

Position

Compression distance, ∆ x (m)

Time of flight, t (s)

Range, R (m)

A

0.02

1.00

0.69

B

0.04

1.01

1.40

C

0.06

1.02

2.12

The students create a graph with k \left(∆ x\right)^{2} plotted on the vertical axis.

i) Label the horizontal axis of Figure 3 with a measured or calculated quantity. Include units, as appropriate. The graphed quantities should yield a linear graph that can be used to determine an experimental value for the mass of the sphere.

ii) On the grid in Figure 3, create a graph of the quantities indicated in part c)i).

  • Clearly label the horizontal axis with a numerical scale

  • Plot the corresponding data points on the grid

  • Any columns added to Table 1 for scratch work will not be scored

Blank graph with vertical axis labelled k(Δx)² in units of 1 × 10⁻³ N·m, ranging from 0 to 30 with evenly spaced gridlines. Horizontal axis is blank with spaces for "Quantity" and "Units (if appropriate)" labelled.

Figure 3

iii) Draw a best-fit line to the data graphed in part c)ii).

1d
Sme Calculator
2 marks

Calculate an experimental value for the mass of the sphere using the best-fit line that you drew in part c)iii).