Plotting Graphs (Edexcel International A Level (IAL) Physics): Revision Note
Exam code: YPH11

Plotting Graphs
When plotting graphs, it is important to consider the importance of the following factors:
Selecting appropriate scales
Labelling axes with quantities and units
Carefully plotting the points
Choice of Scale
When choosing a scale, it must be big enough to accommodate all the collected values using as much of the graph paper as possible
At least half of the graph grid should be occupied in both the x and y directions
Scales should be clearly indicated and have suitable, sensible ranges that are easy to work with
For example, scales with multiples of 3 should be avoided
The scales should increase outwards and upwards from the origin
Each axis should be labelled with the quantity that is being plotted, along with the correct unit
Labelling the Axes
Label each axis with the name of the quantity and its unit
For example, F / N means force measured in Newtons
The convention is that a forward slash ( / ) is used to separate the quantity and the unit
In general:
The independent variable goes on the x-axis
The dependent variable goes on the y-axis

Example of labelled axes with the name of the variable, its symbol and its unit
Plotting the Points
Points should be plotted so that they all fit on the graph grid and not outside it
All values should be plotted, and the points must be precise to within half a small square
Points must be clear, and not obscured by the line of best fit, and they need to be plotted with a sharp pencil so that they are thin
There should be at least six points plotted on the graph, with any major outliers identified
Line or Curve of Best Fit
There should be equal numbers of points above and below the line of best fit
Using a clear plastic ruler will help with this
Not all lines will pass through the origin and nor should they be forced to
The line (or curve) of best fit should not be too thick or joined dot-to-dot like a frequency polygon
Anomalous values that have not been identified during the implementation stage should be ignored if they are obviously incorrect
This is because they will have a large effect on the gradient of the line of best fit
Determining the y-intercept
The y-intercept is the y value obtained where the line crosses the y-axis at x = 0
Values should be read accurately from the graph, with the scale on the y-axis being interpreted correctly
Worked Example
A student investigates the effect of placing an electric fan in front of a wind turbine. The wind turbine is connected to a voltmeter. When the wind turbine turns, it generates voltage. The student obtains the following results:
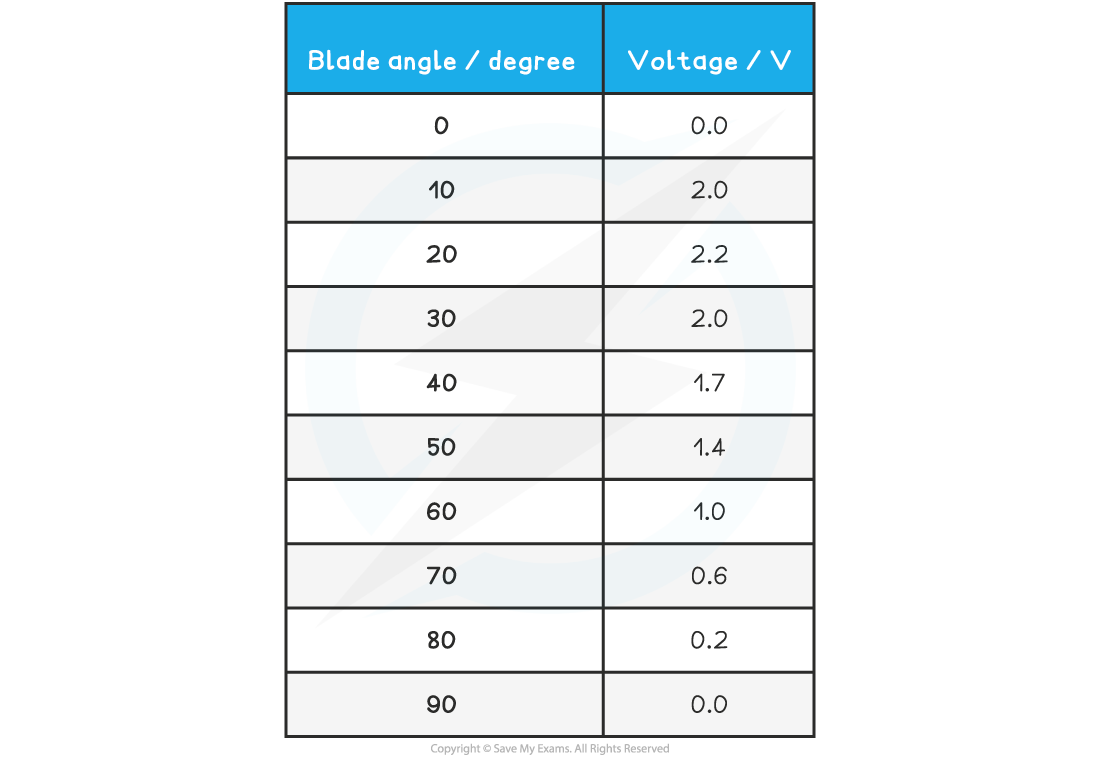
Plot the student’s results on the grid and draw a curve of best fit on the graph.
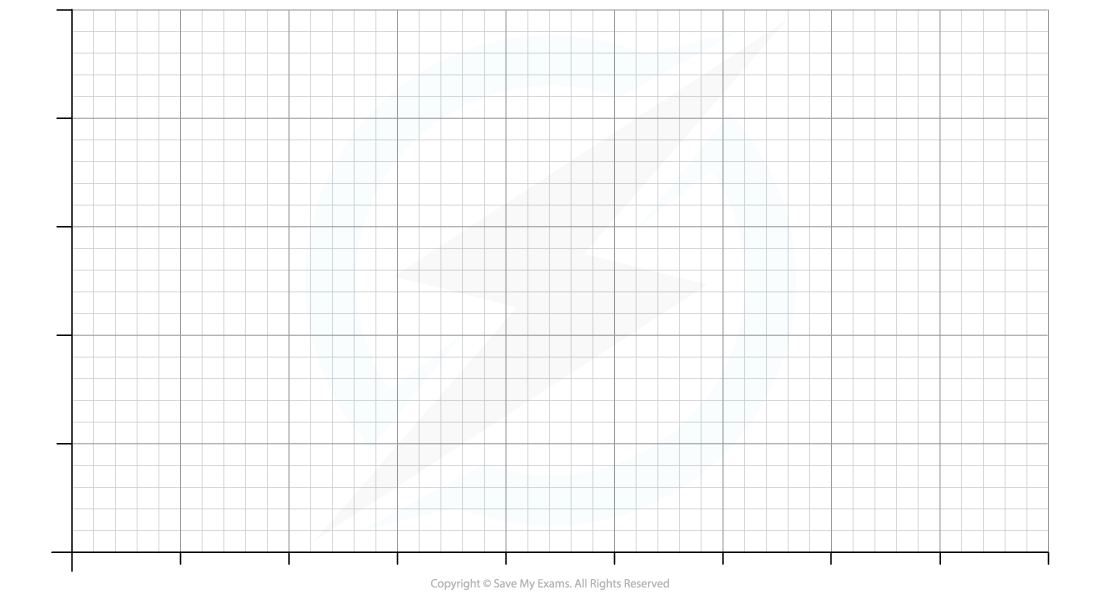
Answer:
Step 1: Identify the independent and dependent variables
Independent variable = blade angle / °
Dependent variable = voltage / V
Step 2: Choose an appropriate scale
The range of the blade angle is 0 – 90°
Ideally, every small square represents 10°
The range of the voltage is 0 – 2.2 V
Ideally, each small square represents 0.5 V
Both axes should occupy at least 50% of the grid
Step 3: Label the axes
The dependent variable (voltage / V) goes on the y-axis
The independent variable (blade angle / °) goes on the x-axis
Both axes should be labelled with a quantity and a unit
Step 4: Plot the points
Each point should be accurate within half a small square
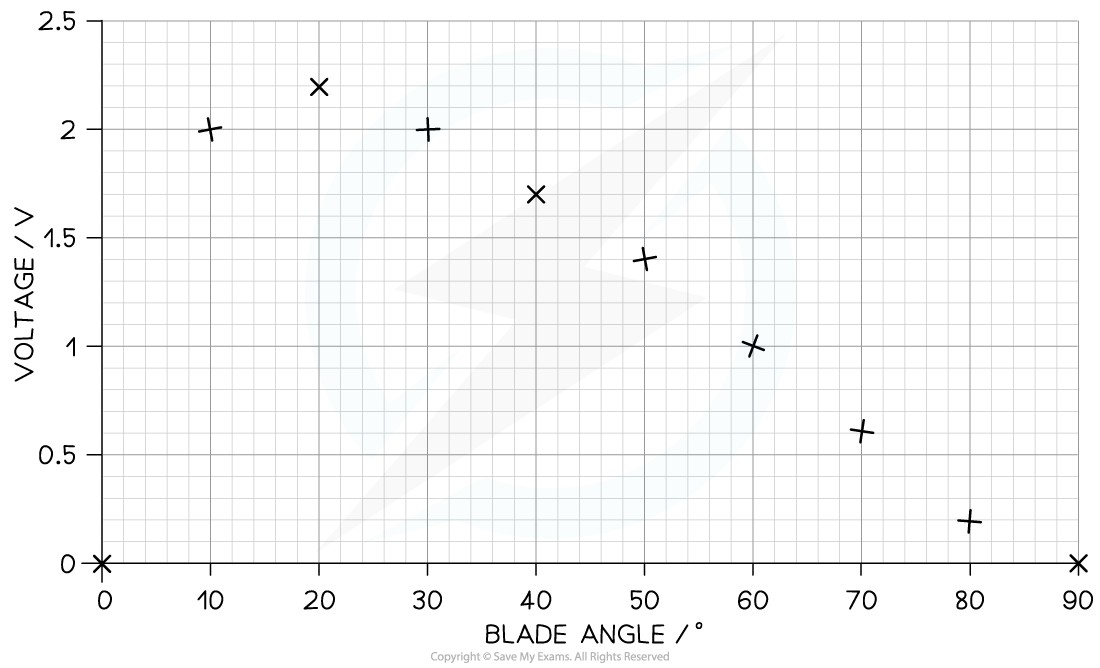
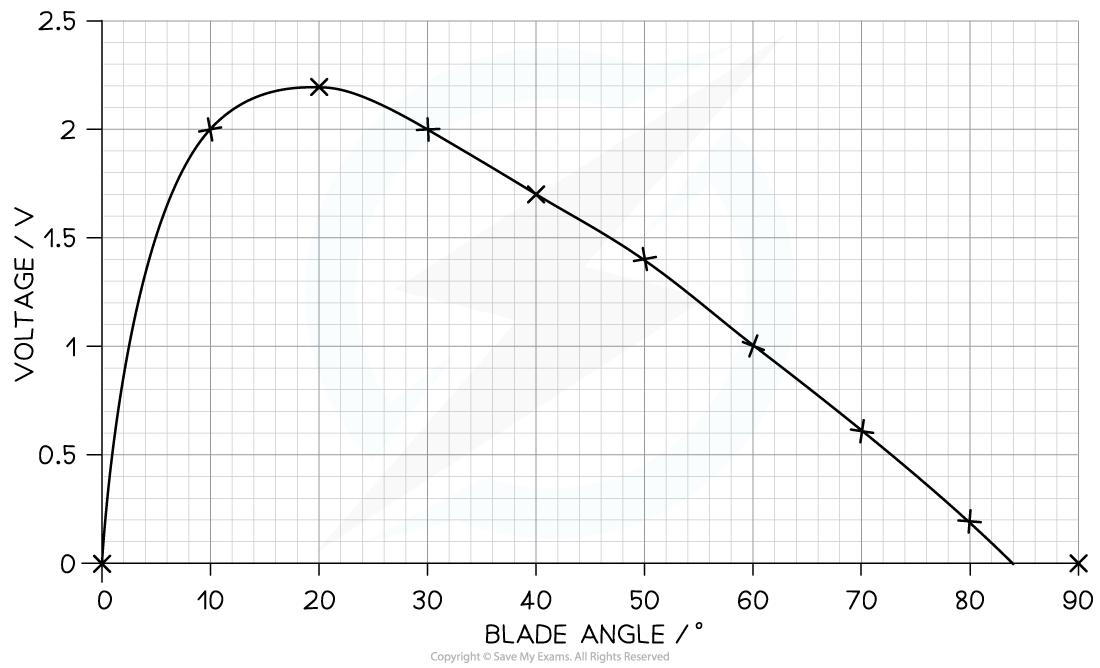
Step 5: Draw a curve of best fit
The curve should be smooth with a roughly equal distribution of points on either side of the curve
It must start at (0,0) and peak at (20, 2.2)
Examiner Tips and Tricks
Remember that 'sketching' and 'plotting' a graph are two different command words
'Sketch' means – Produce a freehand drawing. For a graph, this would require a line and labelled axis with important features indicated, the axes are not scaled.
'Plot' means – Produce a graph by marking points accurately on a grid from data that is provided and then drawing a line of best fit through these points. A suitable scale and appropriately labelled axes must be included if these are not provided in the question
The difference between these two command words is the use of scales. A plotted graph has scaled axes, whilst a sketch doesn't have to be but both times the axes should be clearly labelled
Logarithmic Scales
Graphs can be logarithmic in nature
A logarithmic (log) scale is a non-linear scale often used for analysing a large range of quantities
The log of a number is always greater than 1, so all log values are only positive
Hence, when drawing a log-log graph, the graph will only have a positive quadrant
Often, in practicals, if the log of a value is required, then a separate column is needed in the data table to calculate this, for example:
Table of Results Using ln
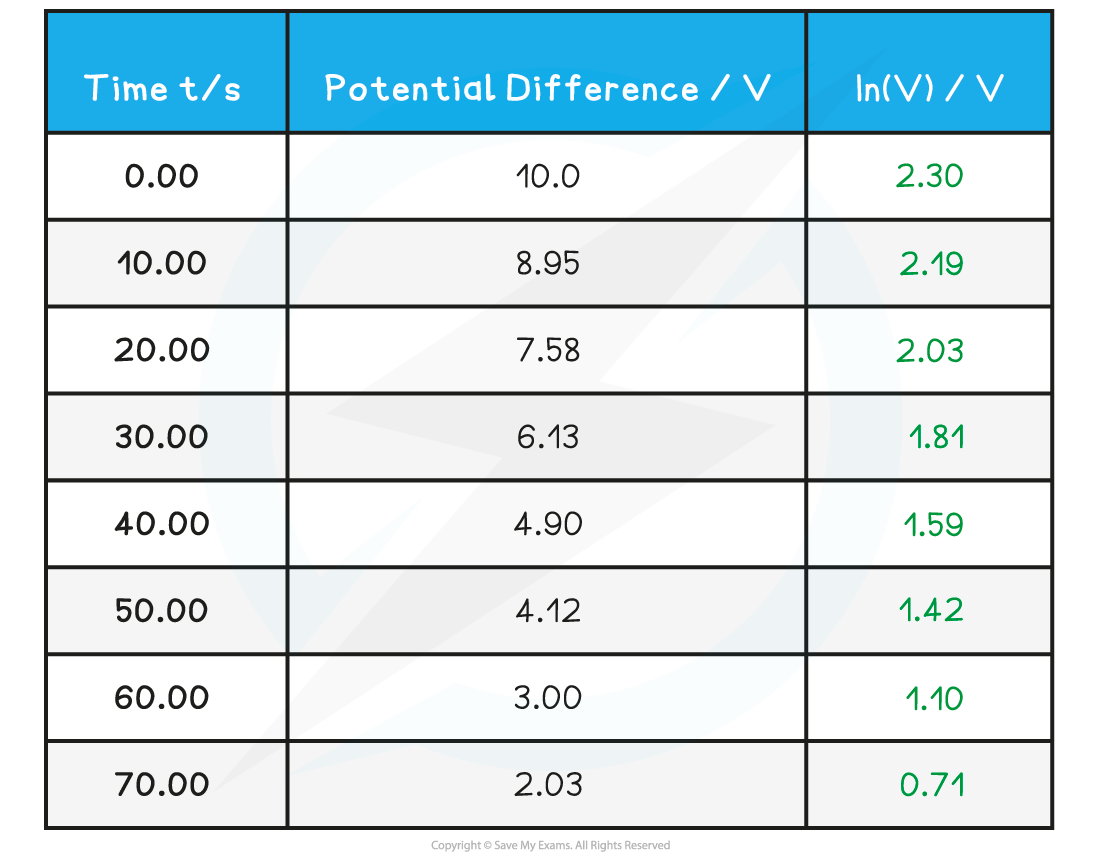
A separate column is often needed to calculate ln(V)
In the above case, the potential difference V is determined from a voltmeter, but the ln(V) values are calculated using a calculator
The most common example of this in A level physics is in:
Radioactive decay
capacitor charge and discharge equations
Using Natural logs (ln)
Taking natural logs (ln) of an equation with an exponential function means the equation can become linear i.e. in the form y = mx + c
Straight-line graphs tend to be more useful than curves for interpreting data
Gradients and intercepts are useful values that can be seen from a straight-line graph
Nuclei decay exponentially, therefore, to achieve a straight-line plot, logarithms can be used
Take the exponential decay equation for the number of nuclei
N = N0 e–λt
Taking the natural logs of both sides
ln N = ln (N0e–λt) = ln (N0) + ln(e–λt)
ln N = ln (N0) − λt
In this form, this equation can be compared to the equation of a straight line
y = mx + c
ln N = − λt + ln (N0)
Where:
y = ln (N) is plotted on the y-axis
x = t is plotted on the x-axis
gradient, m = −λ
y-intercept = ln (N0) is a constant
The exponential decay version of the equation could produce a curve, whilst the ln(N) equation produces a straight line
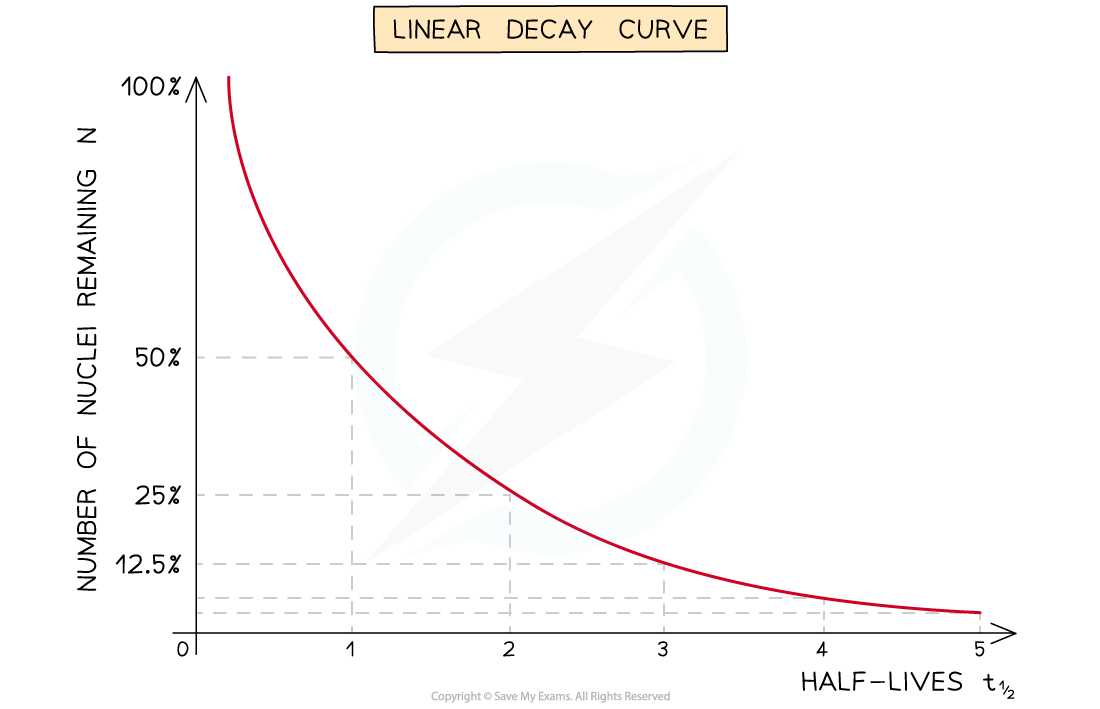
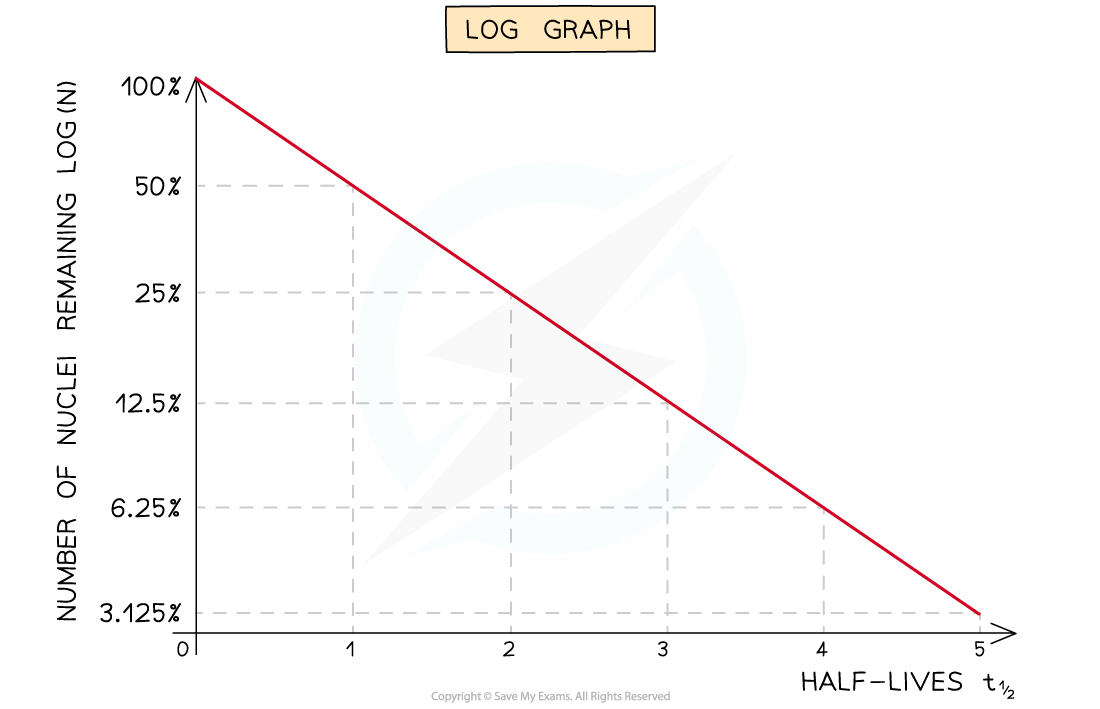
Linear decay curve vs. a log graph
Examiner Tips and Tricks
Remember that log and ln are subtly different! There are two different functions on your calculator.
By default, log is to the base 10, log10 E.g., log 100 = log10 100 = 2
This is very rarely used, if at all, in A level physics
'ln' is just log to the base e (the exponential function). Therefore, ln = loge E.g., ln(ex) = loge(ex) = x
Therefore, if you ever have an exponential function, e in the equation - use 'ln' and not 'log'
'ln' follows all the same laws of logarithms of addition, subtraction and power. You can find more in the 'Logarithmic Function' A level Maths notes here on Save My Exams

Unlock more, it's free!
Join the 100,000+ Students that ❤️ Save My Exams
the (exam) results speak for themselves:

Was this revision note helpful?
Build on this topic