Calibrating Instruments (Edexcel International A Level (IAL) Physics): Revision Note
Exam code: YPH11

Calibrating Instruments
Calibration is a comparison between a known measurement and the measurement you achieve using the instrument
This checks the accuracy of the instrument, especially for higher readings
An example is checking whether a meter (e.g., voltmeter, micrometer, ammeter) reads zero before measurements are made
This helps avoid zero error
To calibrate a thermometer means to put the correct mark of readings at the correct place so that other temperatures can be deduced from these marks
An uncalibrated thermometer may not read 0 °C for the freezing point of water, or 100 °C for its boiling point, but we know these values to be accurate

Calibration Curves
Calibration curves are used to convert measurements made on one measurement scale to another measurement scale
These are useful in experiments when the instruments used have outputs which are not proportional to the value they are measuring
e.g. e.m.f and temperature (thermocouple) or resistance against temperature (thermistor)
For example, the calibration curve for a thermocouple, in which the e.m.f varies with temperature, is shown below:
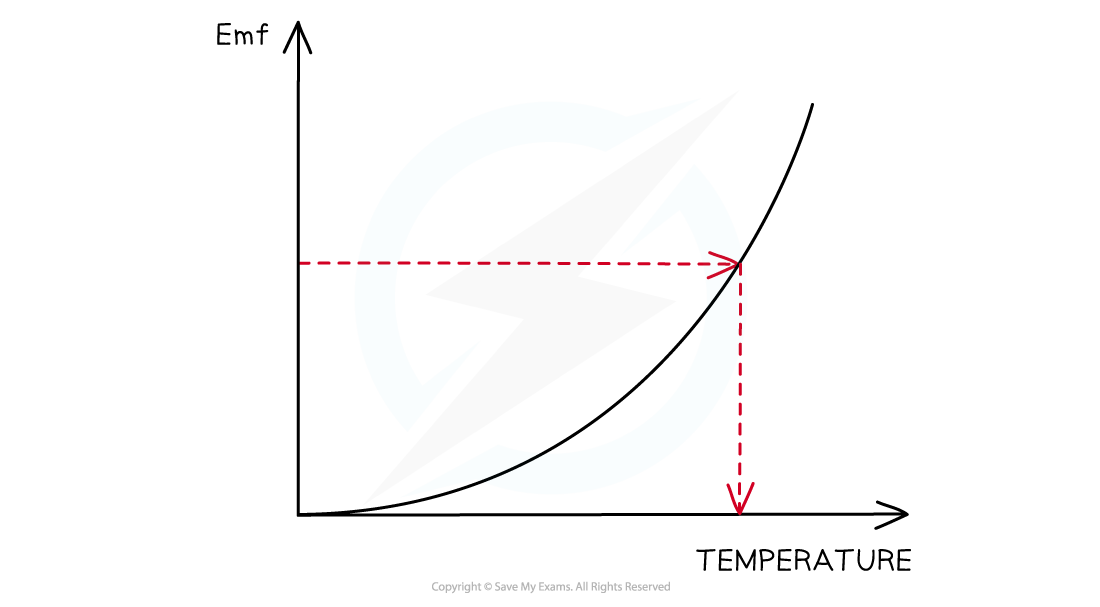
A curve of voltage against temperature can be used as a temperature sensor
The calibration curve for a thermistor looks like:

Thermistor calibration curve
The accuracy of all measuring devices degrades over time. This is typically caused by normal wear and tear
Calibration improves the accuracy of the measuring device
Worked Example
A voltmeter gives readings that are larger than the true values and has a systematic error that varies with voltage. Which graph shows the calibration curve for the voltmeter?

Answer: A
The voltmeter has a systematic error as the reading it gives is always greater than the true value
If the true value is zero, the voltmeter would give a value greater than zero
Therefore, the curve doesn’t pass through the origin (0,0) as this would indicate that the reading is the same as the true value, and not greater - this rule out graph C
So, when the true value is zero, the meter would give a reading greater than zero. This is either graph A or B
The systematic error varies with voltage
So, the amount by which the meter reading is greater than the true value changes
Therefore, graph A is correct, because the difference between the meter reading and the true value increases with voltage
Examiner Tips and Tricks
You will be expected to use a calibration curve for the Core Practical 12: Calibrate a thermistor in a potential divider circuit as a thermostat

Unlock more, it's free!
Join the 100,000+ Students that ❤️ Save My Exams
the (exam) results speak for themselves:

Was this revision note helpful?
Build on this topic