Data Collection (Edexcel International A Level (IAL) Physics): Revision Note
Exam code: YPH11

Written by: Katie M
Updated on
Data Collection
After an experiment has been carried out, sometimes the raw results will need to be processed before they are in a useful or meaningful format
Sometimes, various calculations will need to be carried out in order to get the data in the form of a straight line
This is normally done by comparing the equation to that of a straight line: y = mx + c
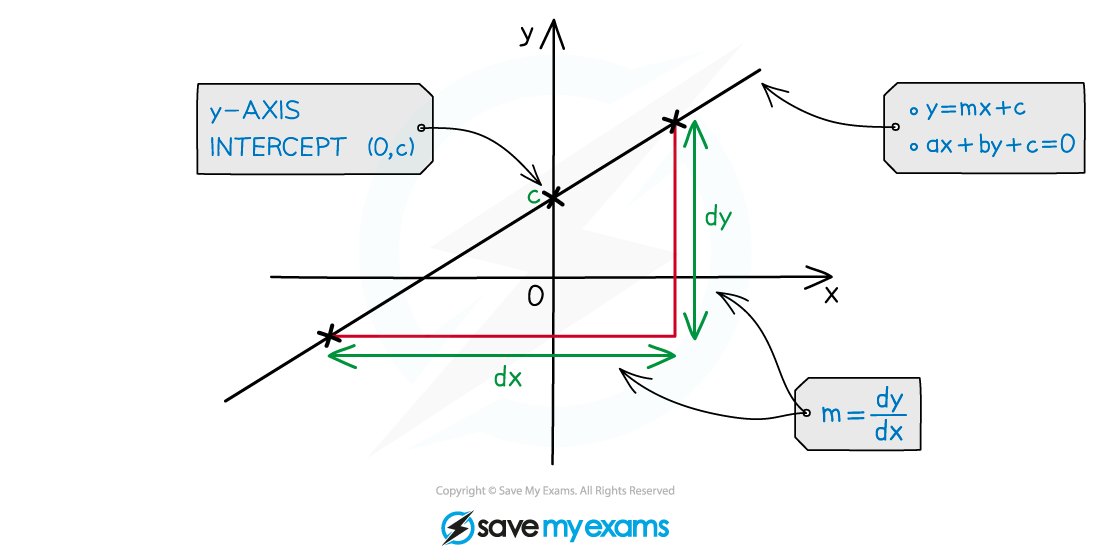
A straight life graph showing the y-intercept and gradient, m
The mathematical skills required for the analysis of quantitative data include:
Using standard form
Quoting an appropriate number of significant figures
Calculating mean values
Using Standard Form
Often, physical quantities will be presented in standard form
For example, the speed of light in a vacuum equal to 3.00 × 10⁸ m s−1This makes it easier to present numbers that are very large or very small without having to repeat many zeros
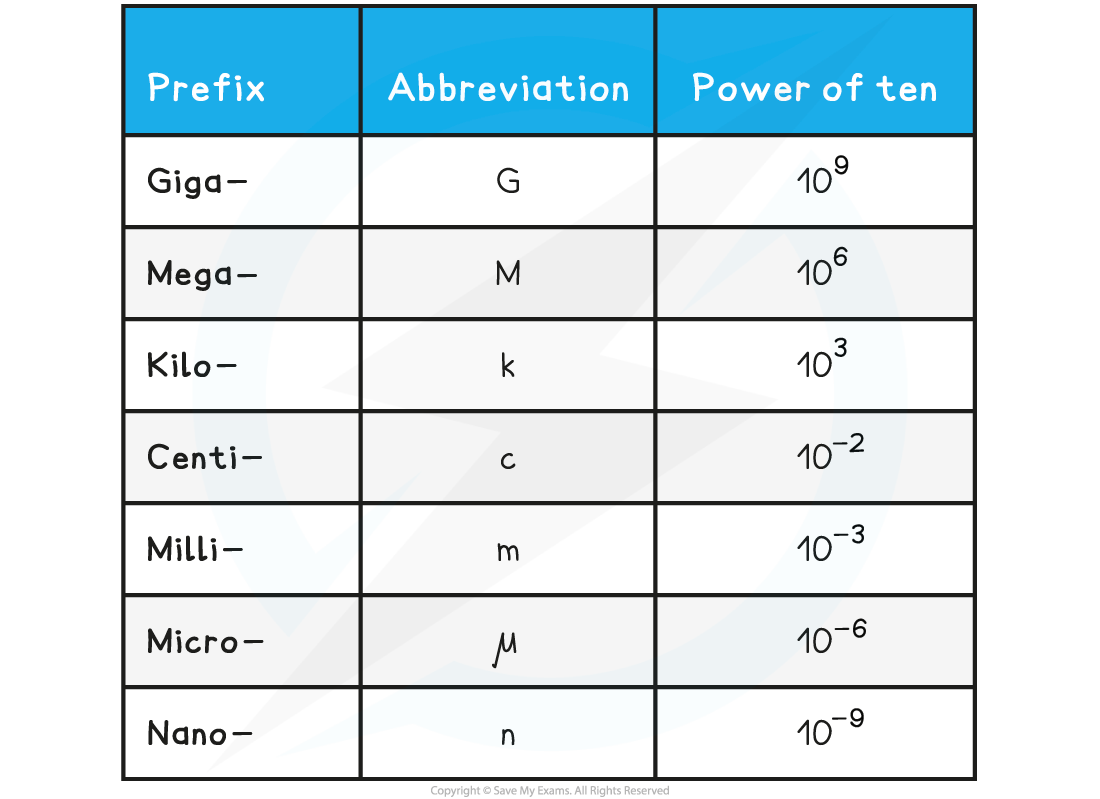
It will also be necessary to know the prefixes for the numbers of ten
Prefixes Table
Using Significant Figures
Calculations must be reported to an appropriate number of significant figures
Also, all the data in a column should be quoted to the same number of significant figures
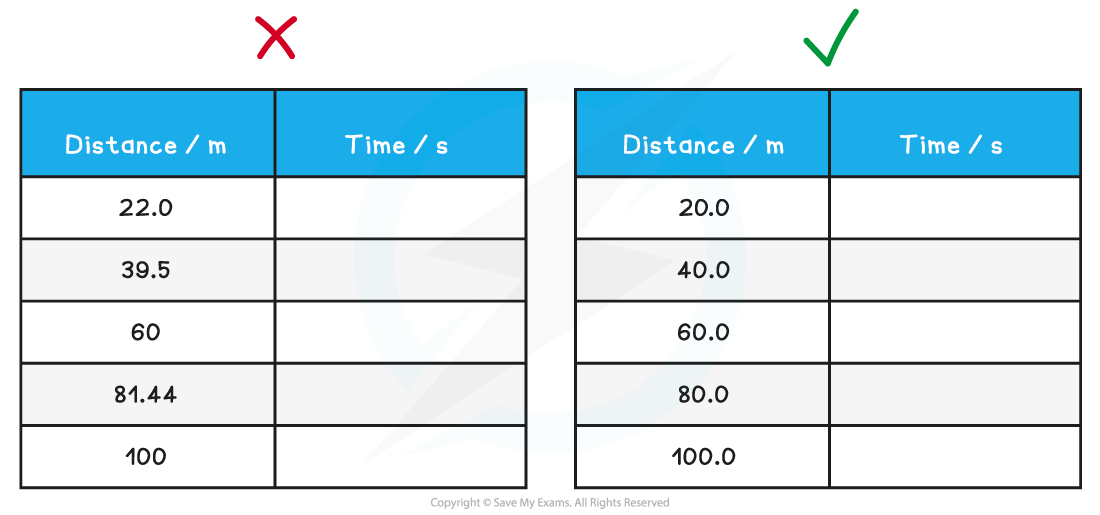
It is important that the significant figures are consistent in data
Calculating Mean Values
When several repeat readings are made, it will be necessary to calculate a mean value
When calculating the mean value of measurements, it is acceptable to increase the number of significant figures by 1

Graph Skills
In several experiments during A-Level Physics, the aim is generally to find if there is a relationship between two variables
This can be done by translating information between graphical, numerical, and algebraic forms
For example, plotting a graph from data of displacement and time, and calculating the rate of change (instantaneous velocity) from the tangent to the curve at any point
Graph skills that will be expected during A-Level include:
Understanding that if a relationship obeys the equation of a straight-line y = mx + c then the gradient and the y-intercept will provide values that can be analysed to draw conclusions
Finding the area under a graph, including estimating the area under graphs that are not linear
Using and interpreting logarithmic plots
Drawing tangents and calculating the gradient of these
Calculating the gradient of a straight-line graph
Understanding where asymptotes may be required
Worked Example
A student measures the background radiation count in a laboratory and obtains the following readings:

The student is trying to verify the inverse square law of gamma radiation on a sample of Radium-226. He collects the following data:
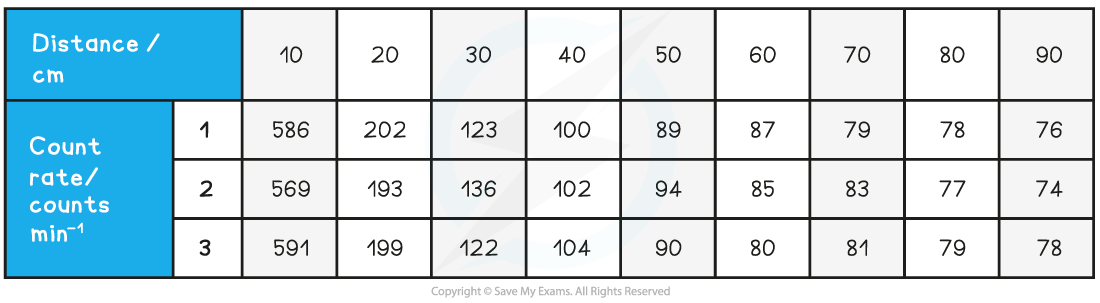
Use this data to determine if the student’s data follows an inverse square law.

Answer:
Step 1: Determine a mean value of background radiation

The background radiation must be subtracted from each count rate reading to determine the corrected count rate, C
Step 2: Compare the inverse square law to the equation of a straight line
According to the inverse square law, the intensity, I, of the γ radiation from a point source depends on the distance, x, from the source

Intensity is proportional to the corrected count rate, C, so

The graph provided is of the form 1/C–1/2 against x
Comparing this to the equation of a straight line, y = mx
y = 1/C–1/2 (counts min–1/2)
x = x (m)
Gradient = constant, k
If it is a straight-line graph through the origin, this shows they are directly proportional, and the inverse square relationship is confirmed
Step 3: Calculate C (corrected average count rate) and C–1/2
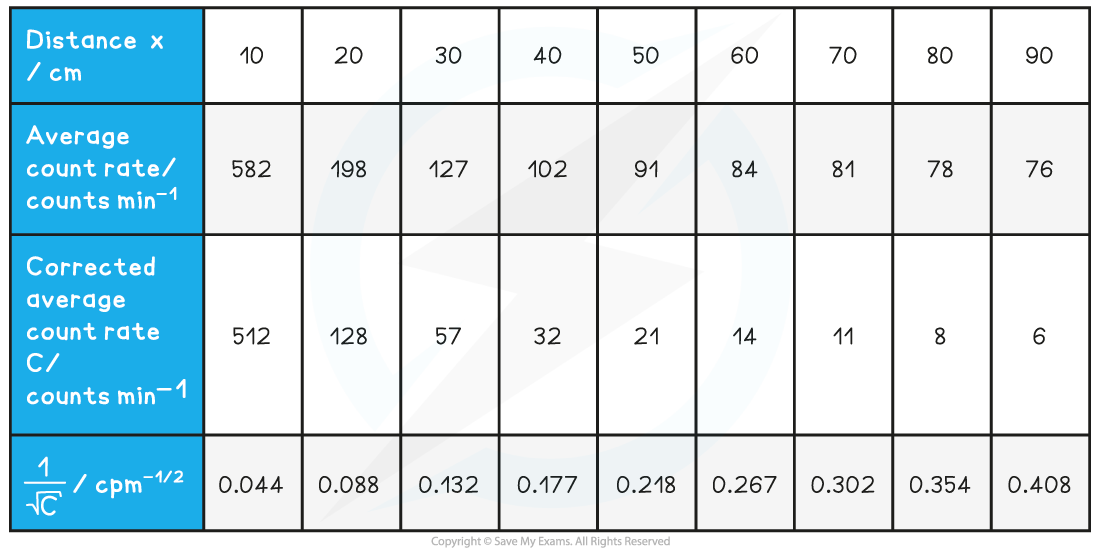
Step 4: Plot a graph of C–1/2 against x and draw a line of best fit
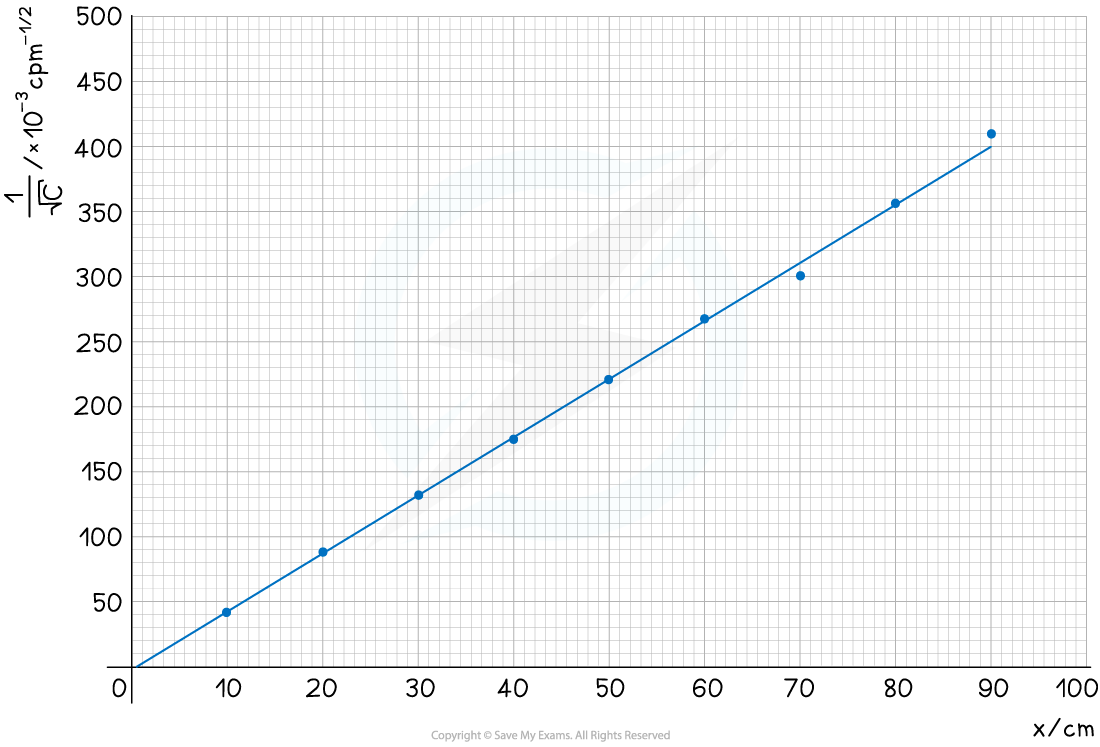
The graph shows C–1/2 is directly proportional to x, therefore, the data follows an inverse square law

Unlock more, it's free!
Join the 100,000+ Students that ❤️ Save My Exams
the (exam) results speak for themselves:

Was this revision note helpful?