Graphs of Trigonometric Functions (Cambridge (CIE) IGCSE Additional Maths): Revision Note
Exam code: 606
Did this video help you?
Graphs of trig functions
What are the graphs of trigonometric functions?
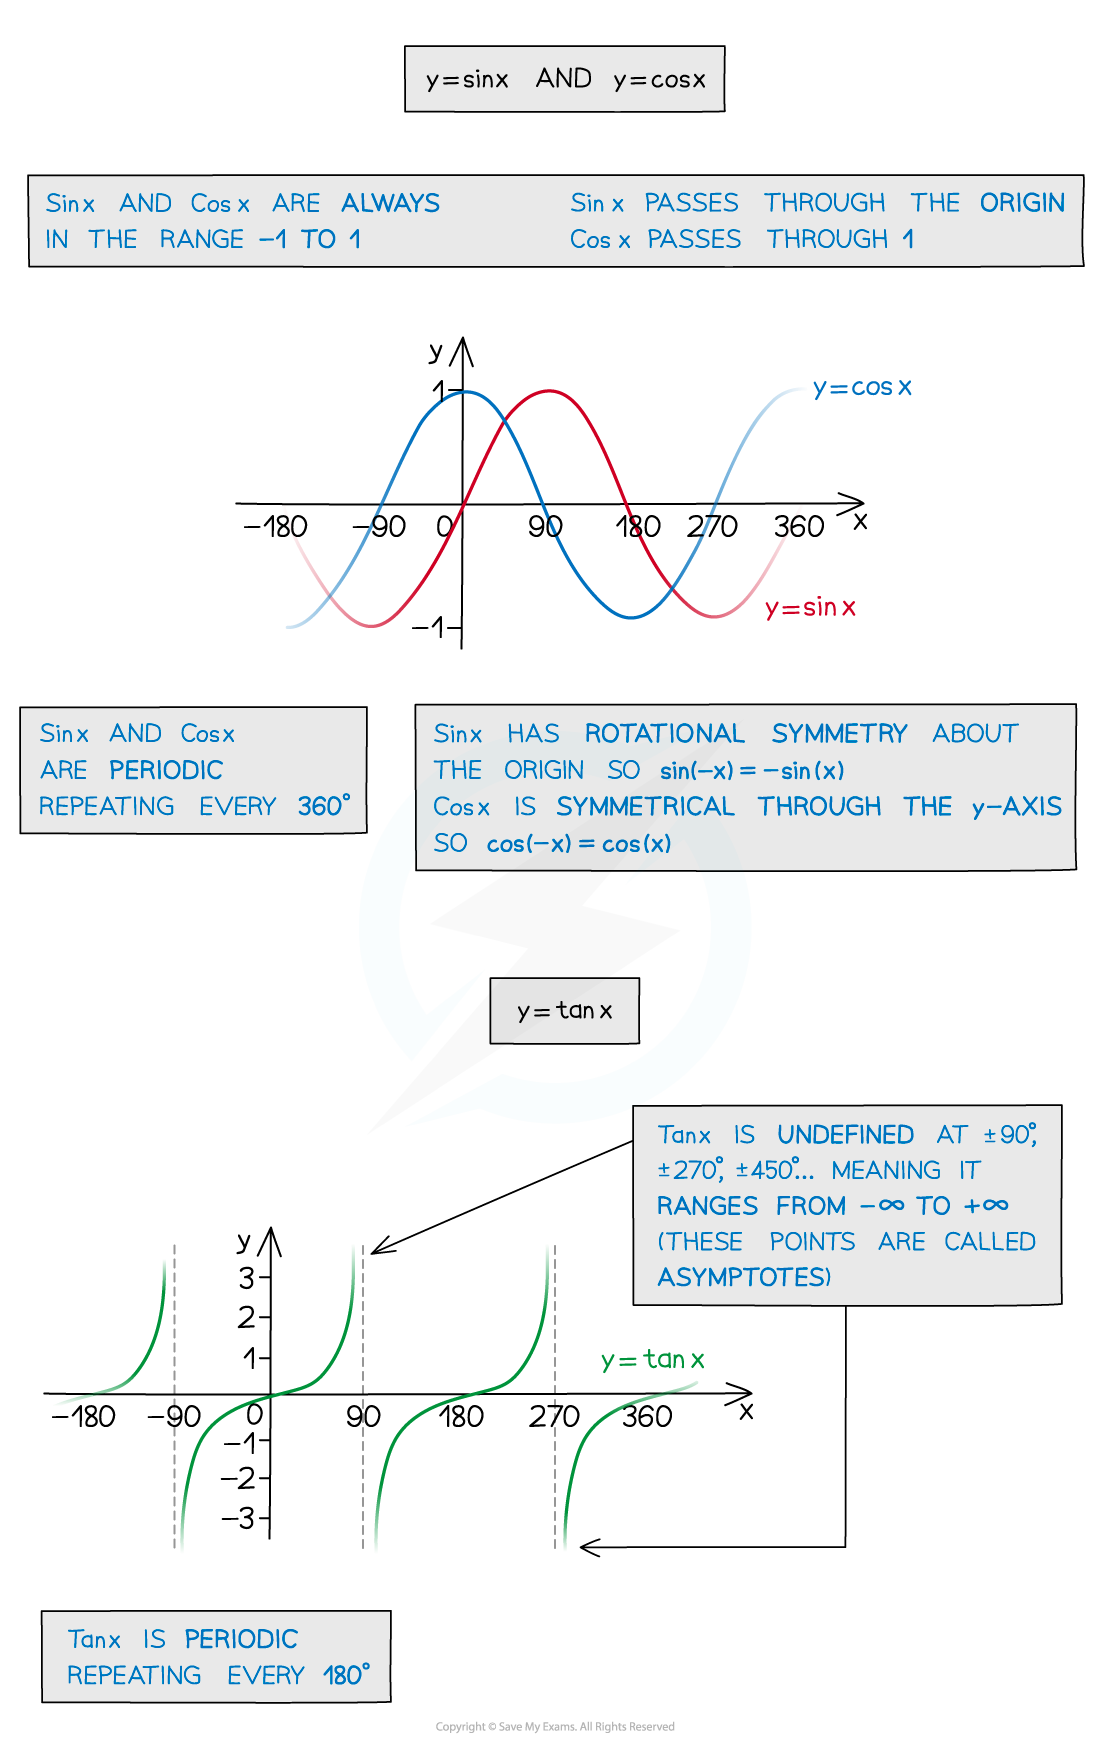
The trigonometric functions sin, cos and tan all have special periodic graphs
You’ll need to know their properties and how to sketch them for a given domain in either degrees or radians
Sketching the trigonometric graphs can help to
Solve trigonometric equations and find all solutions
Understand transformations of trigonometric functions
What are the properties of the graphs of sin x and cos x?
The graphs of sin x and cos x are both periodic
They repeat every 360° (2π radians)
The angle will always be on the x-axis
Either in degrees or radians
The graphs of sin x and cos x are always in the range -1 ≤ y ≤ 1
Domain:
format('truetype')%3Bfont-weight%3Anormal%3Bfont-style%3Anormal%3B%7D%3C%2Fstyle%3E%3C%2Fdefs%3E%3Ctext%20font-family%3D%22Times%20New%20Roman%22%20font-size%3D%2218%22%20text-anchor%3D%22middle%22%20x%3D%224.5%22%20y%3D%2216%22%3E%7B%3C%2Ftext%3E%3Ctext%20font-family%3D%22Times%20New%20Roman%22%20font-size%3D%2218%22%20text-anchor%3D%22middle%22%20x%3D%2289.5%22%20y%3D%2216%22%3E%7D%3C%2Ftext%3E%3Ctext%20font-family%3D%22Times%20New%20Roman%22%20font-size%3D%2218%22%20font-style%3D%22italic%22%20font-weight%3D%22bold%22%20text-anchor%3D%22middle%22%20x%3D%2214.5%22%20y%3D%2216%22%3Ex%3C%2Ftext%3E%3Ctext%20font-family%3D%22math110fad8c4e8597264278582a569%22%20font-size%3D%2216%22%20text-anchor%3D%22middle%22%20x%3D%2228.5%22%20y%3D%2216%22%3E%7C%3C%2Ftext%3E%3Ctext%20font-family%3D%22Times%20New%20Roman%22%20font-size%3D%2218%22%20font-style%3D%22italic%22%20font-weight%3D%22bold%22%20text-anchor%3D%22middle%22%20x%3D%2242.5%22%20y%3D%2216%22%3Ex%3C%2Ftext%3E%3Ctext%20font-family%3D%22math110fad8c4e8597264278582a569%22%20font-size%3D%2216%22%20text-anchor%3D%22middle%22%20x%3D%2260.5%22%20y%3D%2216%22%3E%26%23x2208%3B%3C%2Ftext%3E%3Ctext%20font-family%3D%22math110fad8c4e8597264278582a569%22%20font-size%3D%2216%22%20text-anchor%3D%22middle%22%20x%3D%2278.5%22%20y%3D%2216%22%3E%26%23x211D%3B%3C%2Ftext%3E%3C%2Fsvg%3E)
Range:
format('truetype')%3Bfont-weight%3Anormal%3Bfont-style%3Anormal%3B%7D%3C%2Fstyle%3E%3C%2Fdefs%3E%3Ctext%20font-family%3D%22Times%20New%20Roman%22%20font-size%3D%2218%22%20text-anchor%3D%22middle%22%20x%3D%224.5%22%20y%3D%2216%22%3E%7B%3C%2Ftext%3E%3Ctext%20font-family%3D%22Times%20New%20Roman%22%20font-size%3D%2218%22%20text-anchor%3D%22middle%22%20x%3D%22133.5%22%20y%3D%2216%22%3E%7D%3C%2Ftext%3E%3Ctext%20font-family%3D%22Times%20New%20Roman%22%20font-size%3D%2218%22%20font-style%3D%22italic%22%20font-weight%3D%22bold%22%20text-anchor%3D%22middle%22%20x%3D%2214.5%22%20y%3D%2216%22%3Ey%3C%2Ftext%3E%3Ctext%20font-family%3D%22math105870d177921851ce329aaa3b2%22%20font-size%3D%2216%22%20text-anchor%3D%22middle%22%20x%3D%2228.5%22%20y%3D%2216%22%3E%7C%3C%2Ftext%3E%3Ctext%20font-family%3D%22math105870d177921851ce329aaa3b2%22%20font-size%3D%2216%22%20text-anchor%3D%22middle%22%20x%3D%2240.5%22%20y%3D%2216%22%3E%26%23x2212%3B%3C%2Ftext%3E%3Ctext%20font-family%3D%22Times%20New%20Roman%22%20font-size%3D%2218%22%20text-anchor%3D%22middle%22%20x%3D%2253.5%22%20y%3D%2216%22%3E1%3C%2Ftext%3E%3Ctext%20font-family%3D%22math105870d177921851ce329aaa3b2%22%20font-size%3D%2216%22%20text-anchor%3D%22middle%22%20x%3D%2272.5%22%20y%3D%2216%22%3E%26%23x2264%3B%3C%2Ftext%3E%3Ctext%20font-family%3D%22Times%20New%20Roman%22%20font-size%3D%2218%22%20font-style%3D%22italic%22%20font-weight%3D%22bold%22%20text-anchor%3D%22middle%22%20x%3D%2289.5%22%20y%3D%2216%22%3Ey%3C%2Ftext%3E%3Ctext%20font-family%3D%22math105870d177921851ce329aaa3b2%22%20font-size%3D%2216%22%20text-anchor%3D%22middle%22%20x%3D%22108.5%22%20y%3D%2216%22%3E%26%23x2264%3B%3C%2Ftext%3E%3Ctext%20font-family%3D%22Times%20New%20Roman%22%20font-size%3D%2218%22%20text-anchor%3D%22middle%22%20x%3D%22124.5%22%20y%3D%2216%22%3E1%3C%2Ftext%3E%3C%2Fsvg%3E)
The graphs of sin x and cos x are identical however one is a translation of the other
sin x passes through the origin
cos x passes through (0, 1)
The amplitude of the graphs of sin x and cos x is 1
What are the properties of the graph of tan x?
The graph of tan x is periodic
It repeats every 180° (π radians)
The angle will always be on the x-axis
Either in degrees or radians
The graph of tan x is undefined at the points ± 90°, ± 270° etc
There are asymptotes at these points on the graph
In radians this is at the points ±
format('truetype')%3Bfont-weight%3Anormal%3Bfont-style%3Anormal%3B%7D%3C%2Fstyle%3E%3C%2Fdefs%3E%3Cline%20stroke%3D%22%23000%22%20stroke-linecap%3D%22square%22%20stroke-width%3D%221%22%20x1%3D%222.5%22%20x2%3D%2216.5%22%20y1%3D%2218.5%22%20y2%3D%2218.5%22%2F%3E%3Ctext%20font-family%3D%22math1437d7d1d97917cd627a34a6a0f%22%20font-size%3D%2214%22%20text-anchor%3D%22middle%22%20x%3D%229.5%22%20y%3D%2214%22%3E%26%23x3C0%3B%3C%2Ftext%3E%3Ctext%20font-family%3D%22Times%20New%20Roman%22%20font-size%3D%2216%22%20text-anchor%3D%22middle%22%20x%3D%2210.5%22%20y%3D%2235%22%3E2%3C%2Ftext%3E%3C%2Fsvg%3E) , ±
, ± format('truetype')%3Bfont-weight%3Anormal%3Bfont-style%3Anormal%3B%7D%3C%2Fstyle%3E%3C%2Fdefs%3E%3Cline%20stroke%3D%22%23000%22%20stroke-linecap%3D%22square%22%20stroke-width%3D%221%22%20x1%3D%222.5%22%20x2%3D%2224.5%22%20y1%3D%2220.5%22%20y2%3D%2220.5%22%2F%3E%3Ctext%20font-family%3D%22Times%20New%20Roman%22%20font-size%3D%2216%22%20text-anchor%3D%22middle%22%20x%3D%228.5%22%20y%3D%2215%22%3E3%3C%2Ftext%3E%3Ctext%20font-family%3D%22math1437d7d1d97917cd627a34a6a0f%22%20font-size%3D%2214%22%20text-anchor%3D%22middle%22%20x%3D%2217.5%22%20y%3D%2215%22%3E%26%23x3C0%3B%3C%2Ftext%3E%3Ctext%20font-family%3D%22Times%20New%20Roman%22%20font-size%3D%2216%22%20text-anchor%3D%22middle%22%20x%3D%2214.5%22%20y%3D%2237%22%3E2%3C%2Ftext%3E%3C%2Fsvg%3E) etc
etc
The range of the graph of tan x is
Domain:
format('truetype')%3Bfont-weight%3Anormal%3Bfont-style%3Anormal%3B%7D%40font-face%7Bfont-family%3A'brack_sm1837c52e4f2c6bfec104885'%3Bsrc%3Aurl(data%3Afont%2Ftruetype%3Bcharset%3Dutf-8%3Bbase64%2CAAEAAAAMAIAAAwBAT1MvMi7PH4UAAADMAAAATmNtYXA3kjw6AAABHAAAAGxjdnQgAQYDiAAAAYgAAAASZ2x5ZkyYQ7YAAAGcAAACQmhlYWQLyR8fAAAD4AAAADZoaGVhAq0XCAAABBgAAAAkaG10eDEjA%2FUAAAQ8AAAAJGxvY2EAAEKZAAAEYAAAAChtYXhwBJsEcQAABIgAAAAgbmFtZW7QvZAAAASoAAAB5XBvc3QArQBVAAAGkAAAACBwcmVwu5WEAAAABrAAAAAHAAACDAGQAAUAAAQABAAAAAAABAAEAAAAAAAAAQEAAAAAAAAAAAAAAAAAAAAAAAAAAAAAAAAAAAAAACAgICAAAAAg9AMD%2FP%2F8AAABVAABAAAAAAACAAEAAQAAABQAAwABAAAAFAAEAFgAAAASABAAAwACI6cjqCOpI6ojqyOsI60jrv%2F%2FAAAjpyOoI6kjqiOrI6wjrSOu%2F%2F%2FcWtxa3FrcWtxa3FrcWtxaAAEAAAAAAAAAAAAAAAAAAAAAAAAAAAFUAFQBAAArAIwAgACoAAcAAAACAAAAAADVAQEAAwAHAAAxMxEjFyM1M9XVq4CAAQHWqwABAAAAAAEAAVUABwAjGAGxAAA%2FsQcC%2FbEDB%2FywBDwAsQAAP7AHPLEDAfaxBAT9MTAxNDY3FQ4BFWuVa0BrwCoqK8BAAAH%2FgAAAAFUBVAAJACEYAbEFAD%2BwATyxBgL9sAA8ALEFAD%2BwBjyxAQE%2FsAA8MTATIxQHFhUzNCc2VVWAgFWAgAFUVVRWVVVWVAABAAAAAAEAAVQABwAjGAGxAAA%2FsQcC%2FbEDB%2FywBDwAsQABP7AHPLEDAfaxBAT9MTARFBYXNS4BNWuVa0ABVGrAKispwEAAAQAAAAAAVQFUAAMAIBgBsAQQsAA8sAM8sQEC9bACPACwAy%2BwAjyxAAH1sAE8ETMRI1VVAVT%2BrAABAAAAAAEAAVQABwAlGAGwCS%2BwADyxAQL9sQUH%2FLAEPACxAAA%2FsAE8sQUB9rEEBP0xMCEjNCYnNR4BAQBVQGuVaz%2FAKyoqwQABAKsAAAGAAVQACQAiGAGwCy%2BxBgA8PLEFAv2wATwAsQUAP7AGPLEBAT%2BwADwxMAEjFBcGFTM0NyYBAFWAgFWAgAFUVFVWVVVWVQABAAAAAAEAAVQABwAlGAGwCS%2BwADyxAQL9sQUH%2FLAEPACxAAE%2FsAE8sQUB9rEEBP0xMAEjFAYHFT4BAQBVQWqVawFUVKsqKyvAAAEAqwAAAQABVAADACAYAbAFL7ABPLACPLEAAvWwAzwAsAMvsAI8sQAB9bABPBMzESOrVVUBVP6sAAAAAQAAAAEAAIsesexfDzz1AAMEAP%2F%2F%2F%2F%2FVre5k%2F%2F%2F%2F%2F9Wt7mT%2FgP%2F%2FAdYBWAAAAAoAAgABAAAAAAABAAABVP%2F%2FAAAXcP%2BA%2F4AB1gABAAAAAAAAAAAAAAAAAAAACQDVAAABAAAAAQD%2FgAEAAAABAAAAAQAAAAEAAKsBAAAAAQAAqwAAAAAAAAAhAAAAZQAAAK4AAAD0AAABLAAAAXQAAAG%2FAAACCQAAAkIAAQAAAAkACgACAAAAAAACAIAEAAAAAAAEAABlAAAAAAAAABUBAgAAAAAAAAABACYAAAAAAAAAAAACAA4AJgAAAAAAAAADAEQANAAAAAAAAAAEACYAeAAAAAAAAAAFABYAngAAAAAAAAAGABMAtAAAAAAAAAAIABwAxwABAAAAAAABACYAAAABAAAAAAACAA4AJgABAAAAAAADAEQANAABAAAAAAAEACYAeAABAAAAAAAFABYAngABAAAAAAAGABMAtAABAAAAAAAIABwAxwADAAEECQABACYAAAADAAEECQACAA4AJgADAAEECQADAEQANAADAAEECQAEACYAeAADAAEECQAFABYAngADAAEECQAGABMAtAADAAEECQAIABwAxwBCAHIAYQBjAGsAZQB0AHMAIABzAG0AYQBsAGwAIABzAGkAegBlAFIAZQBnAHUAbABhAHIATQBhAHQAaABzACAARgBvAHIAIABNAG8AcgBlACAAQgByAGEAYwBrAGUAdABzACAAcwBtAGEAbABsACAAcwBpAHoAZQBCAHIAYQBjAGsAZQB0AHMAIABzAG0AYQBsAGwAIABzAGkAegBlAFYAZQByAHMAaQBvAG4AIAAyAC4AMEJyYWNrZXRzX3NtYWxsX3NpemUATQBhAHQAaABzACAARgBvAHIAIABNAG8AcgBlAAAAAAMAAAAAAAAAqgBVAAAAAAAAAAAAAAAAAAAAAAAAAAC5B%2F8AAo2FAA%3D%3D)format('truetype')%3Bfont-weight%3Anormal%3Bfont-style%3Anormal%3B%7D%3C%2Fstyle%3E%3C%2Fdefs%3E%3Ctext%20font-family%3D%22brack_sm1837c52e4f2c6bfec104885%22%20font-size%3D%2218%22%20text-anchor%3D%22start%22%20x%3D%223.5%22%20y%3D%227%22%3E%26%23x23A7%3B%3C%2Ftext%3E%3Ctext%20font-family%3D%22brack_sm1837c52e4f2c6bfec104885%22%20font-size%3D%2218%22%20text-anchor%3D%22start%22%20x%3D%223.5%22%20y%3D%2213%22%3E%26%23x23AA%3B%3C%2Ftext%3E%3Ctext%20font-family%3D%22brack_sm1837c52e4f2c6bfec104885%22%20font-size%3D%2218%22%20text-anchor%3D%22start%22%20x%3D%223.5%22%20y%3D%2219%22%3E%26%23x23AA%3B%3C%2Ftext%3E%3Ctext%20font-family%3D%22brack_sm1837c52e4f2c6bfec104885%22%20font-size%3D%2218%22%20text-anchor%3D%22start%22%20x%3D%223.5%22%20y%3D%2225%22%3E%26%23x23A8%3B%3C%2Ftext%3E%3Ctext%20font-family%3D%22brack_sm1837c52e4f2c6bfec104885%22%20font-size%3D%2218%22%20text-anchor%3D%22start%22%20x%3D%223.5%22%20y%3D%2231%22%3E%26%23x23AA%3B%3C%2Ftext%3E%3Ctext%20font-family%3D%22brack_sm1837c52e4f2c6bfec104885%22%20font-size%3D%2218%22%20text-anchor%3D%22start%22%20x%3D%223.5%22%20y%3D%2237%22%3E%26%23x23AA%3B%3C%2Ftext%3E%3Ctext%20font-family%3D%22brack_sm1837c52e4f2c6bfec104885%22%20font-size%3D%2218%22%20text-anchor%3D%22start%22%20x%3D%223.5%22%20y%3D%2243%22%3E%26%23x23A9%3B%3C%2Ftext%3E%3Ctext%20font-family%3D%22brack_sm1837c52e4f2c6bfec104885%22%20font-size%3D%2218%22%20text-anchor%3D%22start%22%20x%3D%22195.5%22%20y%3D%227%22%3E%26%23x23AB%3B%3C%2Ftext%3E%3Ctext%20font-family%3D%22brack_sm1837c52e4f2c6bfec104885%22%20font-size%3D%2218%22%20text-anchor%3D%22start%22%20x%3D%22195.5%22%20y%3D%2213%22%3E%26%23x23AE%3B%3C%2Ftext%3E%3Ctext%20font-family%3D%22brack_sm1837c52e4f2c6bfec104885%22%20font-size%3D%2218%22%20text-anchor%3D%22start%22%20x%3D%22195.5%22%20y%3D%2219%22%3E%26%23x23AE%3B%3C%2Ftext%3E%3Ctext%20font-family%3D%22brack_sm1837c52e4f2c6bfec104885%22%20font-size%3D%2218%22%20text-anchor%3D%22start%22%20x%3D%22195.5%22%20y%3D%2225%22%3E%26%23x23AC%3B%3C%2Ftext%3E%3Ctext%20font-family%3D%22brack_sm1837c52e4f2c6bfec104885%22%20font-size%3D%2218%22%20text-anchor%3D%22start%22%20x%3D%22195.5%22%20y%3D%2231%22%3E%26%23x23AE%3B%3C%2Ftext%3E%3Ctext%20font-family%3D%22brack_sm1837c52e4f2c6bfec104885%22%20font-size%3D%2218%22%20text-anchor%3D%22start%22%20x%3D%22195.5%22%20y%3D%2237%22%3E%26%23x23AE%3B%3C%2Ftext%3E%3Ctext%20font-family%3D%22brack_sm1837c52e4f2c6bfec104885%22%20font-size%3D%2218%22%20text-anchor%3D%22start%22%20x%3D%22195.5%22%20y%3D%2243%22%3E%26%23x23AD%3B%3C%2Ftext%3E%3Ctext%20font-family%3D%22Times%20New%20Roman%22%20font-size%3D%2218%22%20font-style%3D%22italic%22%20font-weight%3D%22bold%22%20text-anchor%3D%22middle%22%20x%3D%2214.5%22%20y%3D%2227%22%3Ex%3C%2Ftext%3E%3Ctext%20font-family%3D%22math12eb8730e7a9c2a19e14e19f87f%22%20font-size%3D%2216%22%20text-anchor%3D%22middle%22%20x%3D%2228.5%22%20y%3D%2227%22%3E%7C%3C%2Ftext%3E%3Ctext%20font-family%3D%22Times%20New%20Roman%22%20font-size%3D%2218%22%20font-style%3D%22italic%22%20font-weight%3D%22bold%22%20text-anchor%3D%22middle%22%20x%3D%2242.5%22%20y%3D%2227%22%3Ex%3C%2Ftext%3E%3Ctext%20font-family%3D%22math12eb8730e7a9c2a19e14e19f87f%22%20font-size%3D%2216%22%20text-anchor%3D%22middle%22%20x%3D%2261.5%22%20y%3D%2227%22%3E%26%23x2260%3B%3C%2Ftext%3E%3Cline%20stroke%3D%22%23000%22%20stroke-linecap%3D%22square%22%20stroke-width%3D%221%22%20x1%3D%2272.5%22%20x2%3D%2289.5%22%20y1%3D%2220.5%22%20y2%3D%2220.5%22%2F%3E%3Ctext%20font-family%3D%22math12eb8730e7a9c2a19e14e19f87f%22%20font-size%3D%2216%22%20font-style%3D%22italic%22%20font-weight%3D%22bold%22%20text-anchor%3D%22middle%22%20x%3D%2280.5%22%20y%3D%2216%22%3E%26%23x3C0%3B%3C%2Ftext%3E%3Ctext%20font-family%3D%22Times%20New%20Roman%22%20font-size%3D%2218%22%20text-anchor%3D%22middle%22%20x%3D%2281.5%22%20y%3D%2238%22%3E2%3C%2Ftext%3E%3Ctext%20font-family%3D%22math12eb8730e7a9c2a19e14e19f87f%22%20font-size%3D%2216%22%20text-anchor%3D%22middle%22%20x%3D%22100.5%22%20y%3D%2227%22%3E%2B%3C%2Ftext%3E%3Ctext%20font-family%3D%22Times%20New%20Roman%22%20font-size%3D%2218%22%20font-style%3D%22italic%22%20font-weight%3D%22bold%22%20text-anchor%3D%22middle%22%20x%3D%22114.5%22%20y%3D%2227%22%3Ek%3C%2Ftext%3E%3Ctext%20font-family%3D%22math12eb8730e7a9c2a19e14e19f87f%22%20font-size%3D%2216%22%20font-style%3D%22italic%22%20font-weight%3D%22bold%22%20text-anchor%3D%22middle%22%20x%3D%22125.5%22%20y%3D%2227%22%3E%26%23x3C0%3B%3C%2Ftext%3E%3Ctext%20font-family%3D%22math12eb8730e7a9c2a19e14e19f87f%22%20font-size%3D%2216%22%20text-anchor%3D%22middle%22%20x%3D%22135.5%22%20y%3D%2227%22%3E%2C%3C%2Ftext%3E%3Ctext%20font-family%3D%22Times%20New%20Roman%22%20font-size%3D%2218%22%20font-style%3D%22italic%22%20font-weight%3D%22bold%22%20text-anchor%3D%22middle%22%20x%3D%22153.5%22%20y%3D%2227%22%3Ek%3C%2Ftext%3E%3Ctext%20font-family%3D%22math12eb8730e7a9c2a19e14e19f87f%22%20font-size%3D%2216%22%20text-anchor%3D%22middle%22%20x%3D%22171.5%22%20y%3D%2227%22%3E%26%23x2208%3B%3C%2Ftext%3E%3Ctext%20font-family%3D%22math12eb8730e7a9c2a19e14e19f87f%22%20font-size%3D%2216%22%20text-anchor%3D%22middle%22%20x%3D%22188.5%22%20y%3D%2227%22%3E%26%23x2124%3B%3C%2Ftext%3E%3C%2Fsvg%3E)
Range:
format('truetype')%3Bfont-weight%3Anormal%3Bfont-style%3Anormal%3B%7D%3C%2Fstyle%3E%3C%2Fdefs%3E%3Ctext%20font-family%3D%22Times%20New%20Roman%22%20font-size%3D%2218%22%20text-anchor%3D%22middle%22%20x%3D%224.5%22%20y%3D%2216%22%3E%7B%3C%2Ftext%3E%3Ctext%20font-family%3D%22Times%20New%20Roman%22%20font-size%3D%2218%22%20text-anchor%3D%22middle%22%20x%3D%2289.5%22%20y%3D%2216%22%3E%7D%3C%2Ftext%3E%3Ctext%20font-family%3D%22Times%20New%20Roman%22%20font-size%3D%2218%22%20font-style%3D%22italic%22%20font-weight%3D%22bold%22%20text-anchor%3D%22middle%22%20x%3D%2214.5%22%20y%3D%2216%22%3Ey%3C%2Ftext%3E%3Ctext%20font-family%3D%22math110fad8c4e8597264278582a569%22%20font-size%3D%2216%22%20text-anchor%3D%22middle%22%20x%3D%2228.5%22%20y%3D%2216%22%3E%7C%3C%2Ftext%3E%3Ctext%20font-family%3D%22Times%20New%20Roman%22%20font-size%3D%2218%22%20font-style%3D%22italic%22%20font-weight%3D%22bold%22%20text-anchor%3D%22middle%22%20x%3D%2242.5%22%20y%3D%2216%22%3Ey%3C%2Ftext%3E%3Ctext%20font-family%3D%22math110fad8c4e8597264278582a569%22%20font-size%3D%2216%22%20text-anchor%3D%22middle%22%20x%3D%2260.5%22%20y%3D%2216%22%3E%26%23x2208%3B%3C%2Ftext%3E%3Ctext%20font-family%3D%22math110fad8c4e8597264278582a569%22%20font-size%3D%2216%22%20text-anchor%3D%22middle%22%20x%3D%2278.5%22%20y%3D%2216%22%3E%26%23x211D%3B%3C%2Ftext%3E%3C%2Fsvg%3E)
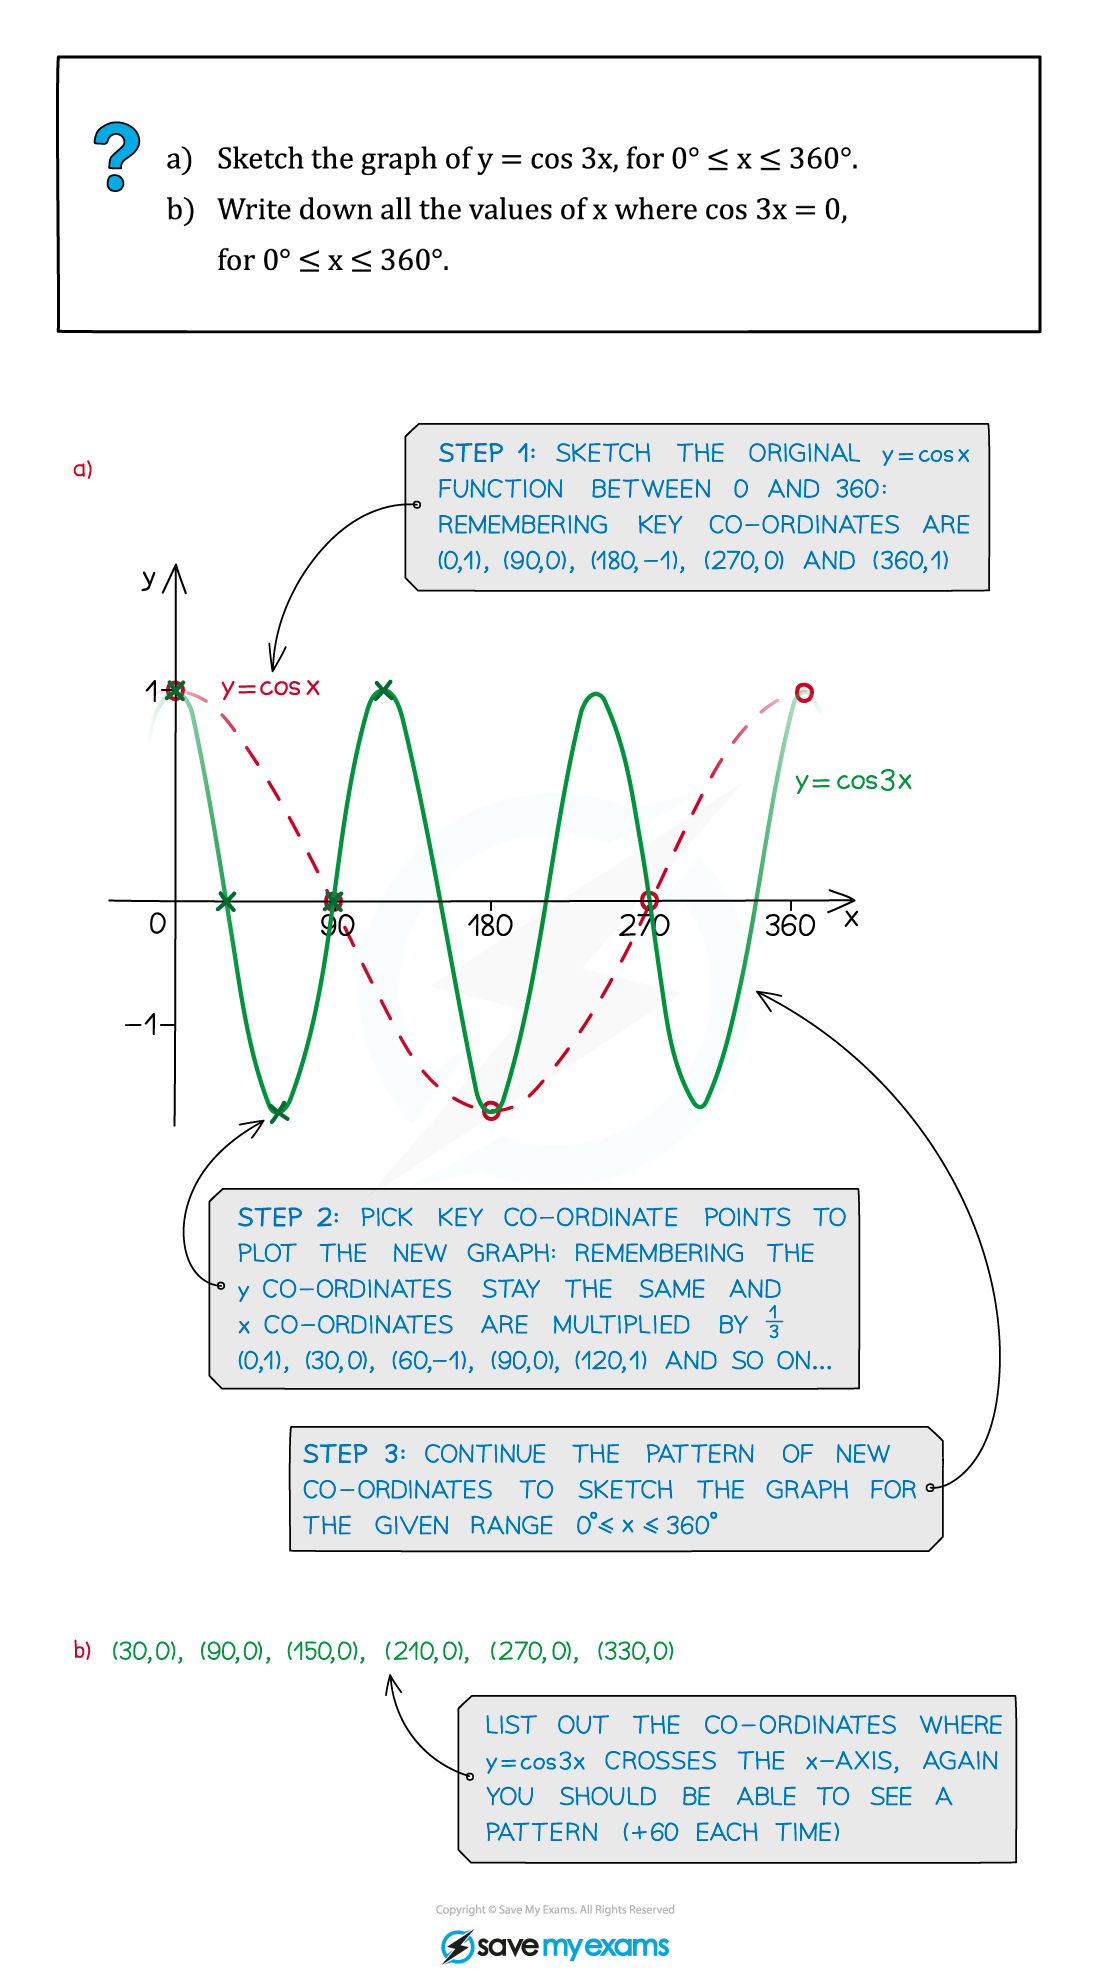
How do I sketch trigonometric graphs?
You may need to sketch a trigonometric graph so you will need to remember the key features of each one
The following steps may help you sketch a trigonometric graph
STEP 1: Check whether you should be working in degrees or radians
You should check the domain given for this
If you see π in the given domain then you should work in radians
STEP 2: Label the x-axis in multiples of 90°
This will be multiples of
if you are working in radiansMake sure you cover the whole domain on the x-axis
STEP 3: Label the y-axis
The range for the y-axis will be – 1 ≤ y ≤ 1 for sin or cos
For tan you will not need any specific points on the y-axis
STEP 4: Draw the graph
Knowing exact values will help with this, such as remembering that sin(0) = 0 and cos(0) = 1
Mark the important points on the axis first
If you are drawing the graph of tan x put the asymptotes in first
If you are drawing sin x or cos x mark in where the maximum and minimum points will be
Try to keep the symmetry and rotational symmetry as you sketch, as this will help when using the graph to find solutions

How do I use trigonometric graphs?
By sketching the graph you can read off all the solutions in a given range (or interval)
Your calculator will only give you the principal value
However, due to the periodic nature of the trig functions there could be an infinite number of solutions
Further solutions are called the secondary values
This is why you will be given a domain (interval) in which your solutions should be found
This could either be in degrees or in radians
If you see π or some multiple of π then you must work in radians
The following steps will help you use the trigonometric graphs to find secondary values
STEP 1: Sketch the graph for the given function and interval
Check whether you should be working in degrees or radians and label the axes with the key values
STEP 2: Draw a horizontal line going through the y-axis at the point you are trying to find the values for
For example if you are looking for the solutions to sin-1(-0.5) then draw the horizontal line going through the y-axis at -0.5
The number of times this line cuts the graph is the number of solutions within the given interval
STEP 3: Find the primary value and mark it on the graph
This will either be an exact value and you should know it
Or you will be able to use your calculator to find it
STEP 4: Use the symmetry of the graph to find all the solutions in the interval by adding or subtracting from the key values on the graph
You should recognise any values/angles associated with exact values
You should be able to spot the pattern of solutions using the symmetry and periodicity of the graph

Examiner Tips and Tricks
Always sketch with a pencil, draw a smooth curve and pay attention to the key features of each graph:
Where it crosses the x and y axes
How often it repeats
Whether it is symmetrical
Remember, when answering exam questions that ask for solutions, a sketch will help ensure you give all the appropriate solutions for a given interval
Worked Example

Transformations of trig functions
What transformations of trigonometric functions do I need to know?
As with other graphs of functions, trigonometric graphs can be transformed through translations, stretches and reflections
Translations can be either horizontal (parallel to the x-axis) or vertical (parallel to the y-axis)
For the function y = sin (x)
A vertical translation of a units in the positive direction (up) is denoted by y = sin (x) + a
A vertical translation of a units in the negative direction (down) is denoted by y = sin (x) - a
A horizontal translation in the positive direction (right) is denoted by y = sin (x - a)
A horizontal translation in the negative direction (left) is denoted by y = sin (x + a)
Stretches can be either horizontal (parallel to the x-axis) or vertical (parallel to the y-axis)
For the function y = sin (x)
A vertical stretch of a factor a units is denoted by y = a sin (x)
A horizontal stretch of a factor a units is denoted by y = sin (
 )
)
Reflections can be either across the x-axis or across the y-axis
For the function y = sin (x)
A reflection across the x-axis is denoted by y = - sin (x)

What combined transformations are there?
Stretches in the horizontal and vertical direction are often combined
The functions a sin(bx) and a cos(bx) have the following properties:
The amplitude of the graph is |a |
The period of the graph is
 ° (or
° (or format('truetype')%3Bfont-weight%3Anormal%3Bfont-style%3Anormal%3B%7D%3C%2Fstyle%3E%3C%2Fdefs%3E%3Cline%20stroke%3D%22%23000%22%20stroke-linecap%3D%22square%22%20stroke-width%3D%221%22%20x1%3D%222.5%22%20x2%3D%2224.5%22%20y1%3D%2220.5%22%20y2%3D%2220.5%22%2F%3E%3Ctext%20font-family%3D%22Times%20New%20Roman%22%20font-size%3D%2216%22%20text-anchor%3D%22middle%22%20x%3D%228.5%22%20y%3D%2215%22%3E2%3C%2Ftext%3E%3Ctext%20font-family%3D%22math1437d7d1d97917cd627a34a6a0f%22%20font-size%3D%2214%22%20text-anchor%3D%22middle%22%20x%3D%2217.5%22%20y%3D%2215%22%3E%26%23x3C0%3B%3C%2Ftext%3E%3Ctext%20font-family%3D%22Times%20New%20Roman%22%20font-size%3D%2216%22%20font-style%3D%22italic%22%20text-anchor%3D%22middle%22%20x%3D%2213.5%22%20y%3D%2237%22%3Eb%3C%2Ftext%3E%3C%2Fsvg%3E) rad)
rad)In this course, a will always be a positive integer and b will be a simple fraction or integer
Translations in both directions could also be combined with the stretches
The functions a sinbx + c and a cosbx + c have the following properties:
The amplitude of the graph is |a |
The period of the graph is
 ° (or
° (or format('truetype')%3Bfont-weight%3Anormal%3Bfont-style%3Anormal%3B%7D%3C%2Fstyle%3E%3C%2Fdefs%3E%3Cline%20stroke%3D%22%23000%22%20stroke-linecap%3D%22square%22%20stroke-width%3D%221%22%20x1%3D%222.5%22%20x2%3D%2225.5%22%20y1%3D%2220.5%22%20y2%3D%2220.5%22%2F%3E%3Ctext%20font-family%3D%22Times%20New%20Roman%22%20font-size%3D%2216%22%20text-anchor%3D%22middle%22%20x%3D%228.5%22%20y%3D%2215%22%3E2%3C%2Ftext%3E%3Ctext%20font-family%3D%22math1437d7d1d97917cd627a34a6a0f%22%20font-size%3D%2214%22%20font-style%3D%22italic%22%20text-anchor%3D%22middle%22%20x%3D%2217.5%22%20y%3D%2215%22%3E%26%23x3C0%3B%3C%2Ftext%3E%3Ctext%20font-family%3D%22Times%20New%20Roman%22%20font-size%3D%2216%22%20font-style%3D%22italic%22%20text-anchor%3D%22middle%22%20x%3D%2214.5%22%20y%3D%2237%22%3Eb%3C%2Ftext%3E%3C%2Fsvg%3E) )
)The translation in the vertical direction is c
c represents the principal axis (the line that the function fluctuates about)
It helps to start by sketching the principle axis
The function a tanbx + c has the following properties:
The amplitude of the graph does not exist
The period of the graph is
 ° (or
° (or format('truetype')%3Bfont-weight%3Anormal%3Bfont-style%3Anormal%3B%7D%3C%2Fstyle%3E%3C%2Fdefs%3E%3Cline%20stroke%3D%22%23000%22%20stroke-linecap%3D%22square%22%20stroke-width%3D%221%22%20x1%3D%222.5%22%20x2%3D%2217.5%22%20y1%3D%2218.5%22%20y2%3D%2218.5%22%2F%3E%3Ctext%20font-family%3D%22math1437d7d1d97917cd627a34a6a0f%22%20font-size%3D%2214%22%20font-style%3D%22italic%22%20text-anchor%3D%22middle%22%20x%3D%229.5%22%20y%3D%2214%22%3E%26%23x3C0%3B%3C%2Ftext%3E%3Ctext%20font-family%3D%22Times%20New%20Roman%22%20font-size%3D%2216%22%20font-style%3D%22italic%22%20text-anchor%3D%22middle%22%20x%3D%2210.5%22%20y%3D%2235%22%3Eb%3C%2Ftext%3E%3C%2Fsvg%3E) )
)The translation in the vertical direction (principal axis) is c
Finding and drawing the asymptotes first can help to sketch these graphs
How do I sketch transformations of trigonometric functions?
Sketch the graph of the original function first
Carry out each transformation separately
The order in which you carry out the transformations is important
Given the form y = a sinbx + c carry out any stretches first, translations next and reflections last
Use a very light pencil to mark where the graph has moved for each transformation
It is a good idea to mark in the principal axis the lines corresponding to the maximum and minimum points first
The principal axis will be the line y = c
The maximum points will be on the line y = c + a
The minimum points will be on the line y = c - a
Sketch in the new transformed graph
Check it is correct by looking at some key points from the exact values
Examiner Tips and Tricks
Always sketch with a pencil and draw a smooth curve
When you sketch the transformation of a graph, be sure to indicate the new coordinates of any points that are marked on the original graph
Fir any graph involving tan the asymptotes must be clearly labelled
Try to indicate the coordinates of points where the new graph intersects the axes
Worked Example

Unlock more, it's free!
Did this page help you?